Converting Desktop MapObjects Applications to ArcIMS: Case Studies for Environmentally Sensitive Sites
Joseph F. Giacinto
Robert F. Nickols
James W. Bodamer
Lonnie D. Norman
Abstract
Desktop GIS applications were developed with MapObjects for environmentally sensitive sites that integrated tabular database query and overlay capabilities with the power of GIS. The desktop application and database required a significant amount of disk space and processing power on the client PC. In order to make the application more easily available to the user groups, centralize the spatial and tabular database, and provide for a lighter processing load on the client PC, the desktop application was converted entirely to a Web-based application utilizing ArcIMS and SQL Server. This study documents the problems and solutions of the application and database conversion process, and advantages gained from the Web-based application.
Introduction
This study documents the conversion process from desktop MapObjects applications developed for environmentally sensitive sites to ArcIMS and the choices and tradeoffs involved in porting the desktop applications to an ArcIMS Web site application. The desktop applications included access to historical aerial photographs, historical and current site maps, well construction and boring logs, site photographs, subsurface cross-sections, and contaminant plume maps. The applications accessed a spatial database from the local hard drive. An analytical SQL database was queried from a remote server and returned to the application as a shape file for map overlays, symbol manipulation, and customized graphics.
For installation, the applications and associated maps and documents typically required 600 megabytes of disk space. Bundling the applications for installation required extensive and time consuming deployment testing on various Windows (95, 98, and 2000) operating systems configured with various software (e.g., Office 95, 97, and 2000) combinations. Methodical checking of various operating system file dependencies was also necessary during the bundling of the application installation.
Packaging the application installation required creating installation CDs, CD labels, CD documentation, and packaging and mailing the CDs to each user in the user group. Although simple application updates could be distributed via email, major application revisions had to be sent to the user group on CDs, adding to the cost of application maintenance. With readily accessible high speed Internet connections and the release of ArcIMS, many of the features associated with the desktop MapObjects applications could be ported to an Internet mapping system application.
The MapObjects Applications
The objective of the applications is to permit site information, obtained from diverse sources over several years, to be uniformly distributed among various site personnel in a convenient, easy to use format. Using a Visual Basic code and MapObjects components, the application was developed to provide easy access to an assembly of information including a comprehensive database of maps, analytical chemistry data, technical reports, and aerial photos. Spatial databases (maps) and tabular databases (e.g., analytical sampling, water level, and geotechnical databases) were maintained in an ArcView format to allow maximum flexibility in performing customized analysis. The application and spatial database was distributed to each project team member on a CD. The application was developed as a stand-alone product to eliminate the need for the end user to purchase GIS software. Also, creating an easy to use application saved the end users the cost and time associated with the training generally required to perform analyses using more sophisticated GIS software packages. Additional cost savings were realized by including maps and reports in the application thereby eliminating the need to reproduce maps, documents, and other information that is commonly distributed to the numerous parties involved in the site clean up and remediation activities.
To ensure security, sensitive tabular (e.g., analytical) data was maintained on a centralized server computer accessible through the application, or an independent query interface with a password-protected Internet connection. Centralization of the tabular database allowed controlled maintenance in a consistent and uniform file format, unlimited user access, efficient sharing of all or part of the database, and avoided maintaining multiple copies of similar databases for the project duration. The location of the tabular data on the server computer allowed multiple remote users to query and access the database for customized analyses.
Consistent with the MapObjects applications, user requirements for the ArcIMS applications included capabilities to perform complex queries, change symbology, modify layer properties. In addition, integration of a tabular database query system was needed to query, overlay, and manipulate environmental sampling data on the desired set of map layers.
MapObjects Application Features and Functions
The MapObjects application contained a standard set of map tools: zoom, pan, find, information tool, and layer properties. Points or lines associated with pictures, subsurface cross sections panoramic movies, sampling descriptions, etc. were hyperlinked to the associated images. For querying the tabular analytical databases, an interface was developed and integrated into the application.
Tabular Database Query Module
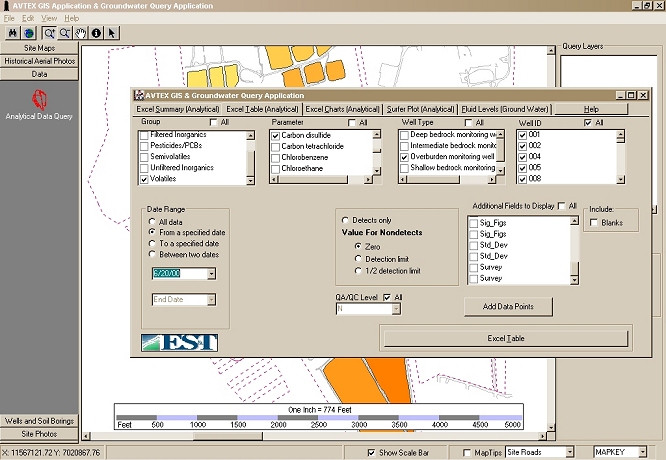
Tabular database queries are created and sent to the SQL Server database server computer by query interfaces embedded in the applications via an Internet connection. For each and every query, the query string sent to the server computer is preceded by the user�s security string. The query interface (Figure 1) included the option to query tabular analytical data, and automatically
Figure 1. Query Interface Integrated into MapObjects Applications.
convert the queried data to a shape file for overlay in the map window. Conversion of the tabular database queries to shape files allowed the user to take full advantage of the flexible map layer plotting options available in MapObjects. Measurements returned to the map window as shape files could be represented as scaled symbols or colors based on the measurement value (Figure 2), and/or labeled according to any field (e.g., concentration, well ID, etc.) within the DBF file returned in the shape file data set.
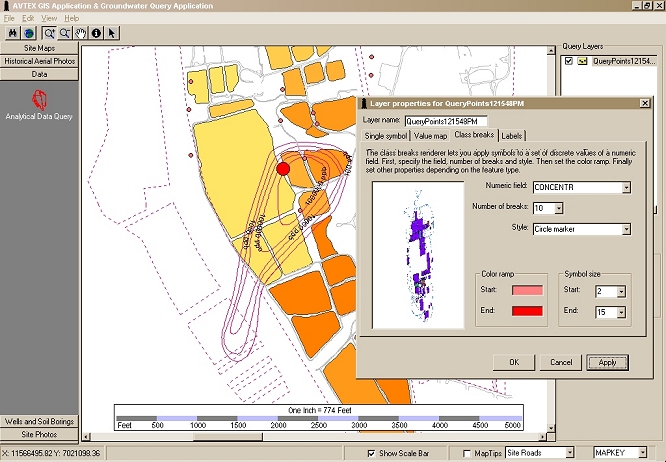
Figure 2. Tabular Database Query Converted to Shape File and Overlain on Selected Map Set.
In addition to the options available in MapObjects, third party charting software was integrated into the application to allow powerful charting control. Available functions include the ability to chart measured data by distance or time transects with display of sample point IDs, and/or sample measurements on the resulting graphic. Charts were created along a transect by pointing and clicking on a series of sample points of interest in the map window. All components of the resulting chart could be edited and/or annotated for printing. The data points could also be sent to an on screen table display (Figure 3) for inspection of data points, or an Excel table for further analysis of the data points and sample characteristics.
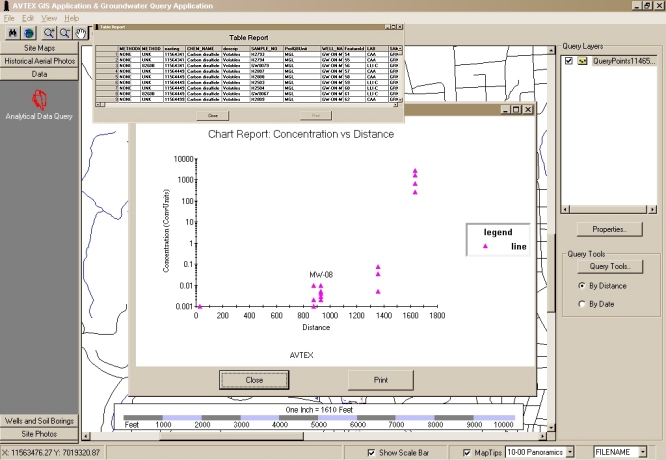
Figure 3. Chart Created by Clicking Along Transect of Queried Tabular Data Set.
MapObjects to ArcIMS Conversion
Migrating Mapping Tools
The standard set of MapObjects tools were readily available in the ArcIMS tool set. Because the tool sets were easily deployed through ArcIMS Designer, more map tools were able to be deployed with the ArcIMS application than with the MapObjects application. The ArcIMS Feature MapService allowed the maximum number of map tools to be made available for map interaction and analyses. In addition, a Java solution was needed for the server side application which required the use of the ArcIMS Feature MapService for the client computers.
Hyperlinks to the pictures, panoramic movies, and sampling documents were linked to the associated points or lines on the map layers. With the Feature MapService option, the user was required to select the data point or line associated with an image or document, view the attribute table, and then click on the hyperlink brought up in the point or line attribute table. This ArcIMS Feature MapService hyperlink method required a few extra mouse clicks than the MapObjects application with the same end result for viewing site photographs, cross sections, panoramic movies, and sampling data documents.
Migrating the Tabular Database Query Interface to the ArcIMS Web Site
Integrating the interactive query interface into the ArcIMS Feature MapService Web site presented considerable computer programming challenges. The query interface (bottom portion of Figure 4) was developed to run within a frame of the ArcIMS Web site as a separate user control.
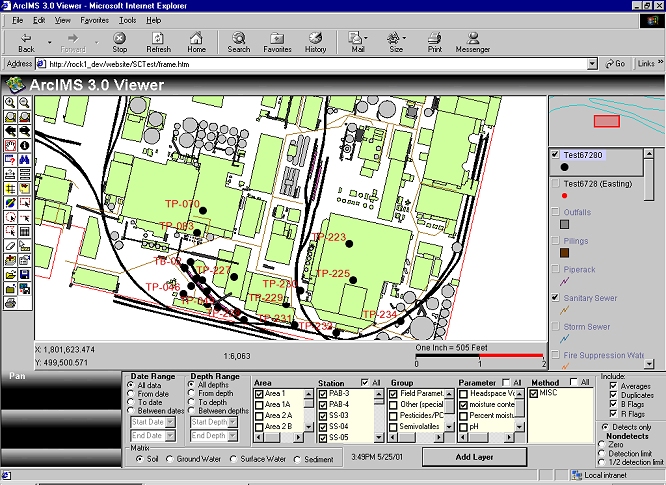
Figure 4. Integrated Query Interface within ArcIMS Web Page.
Upon the initial visit to the ArcIMS site, the application registers the files on the client computer necessary to execute the tabular database query interface. This method was particularly efficient for query application updates that would install automatically on the user�s computer eliminating the need to bundle and redistribute application revisions on disk, CD, or other media.
When a tabular database query was requested by the user within the ArcIMS application, the query request was sent to a SQL Server database server computer, executed, and then saved on the map server computer. MapObjects was then utilized on the map server computer to convert the tabular database query to a point shape file that was then saved on the map server. Once this was done, a Java script was used on the map server to add the shape files to the set of map layers in the ArcIMS map client window (Java viewer). Similar to the MapObjects application, the measurements returned as point shape files could be represented as scaled symbols or colors based on the measurement, and/or labeled according to any field (e.g., concentration, well ID, etc.) within the DBF file (Figure 5) of the shape file data set utilizing the ArcIMS Feature MapService capabilities.
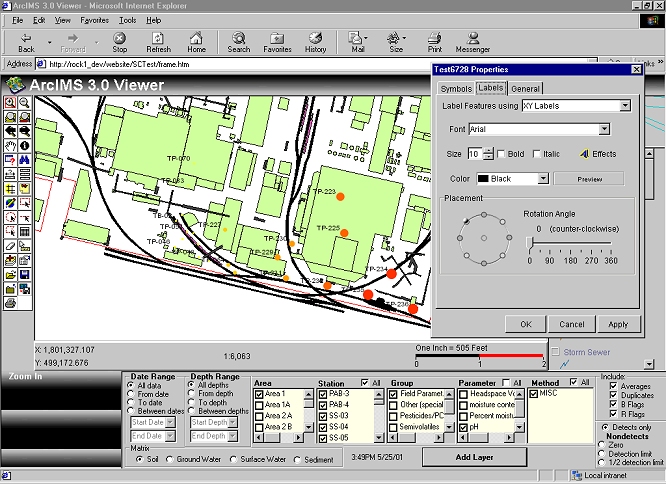
Figure 5. Layer Property Modification of Shape File Converted from Tabular Database Query.
For charting of the returned tabular database queries, a Internet query interface similar to the interface imbedded in the ArcIMS Web site was made accessible through a hyperlink on the ArcIMS Web page. After the user selects a set of data to be queried, the Internet query interface sends the SQL Server database server computer a request. The server processes the request, and then automatically returns the requested data to the client computer in the form of an Excel workbook report or chart, or a Surfer (Golden Software, 1999) contour (Figure 6) map.
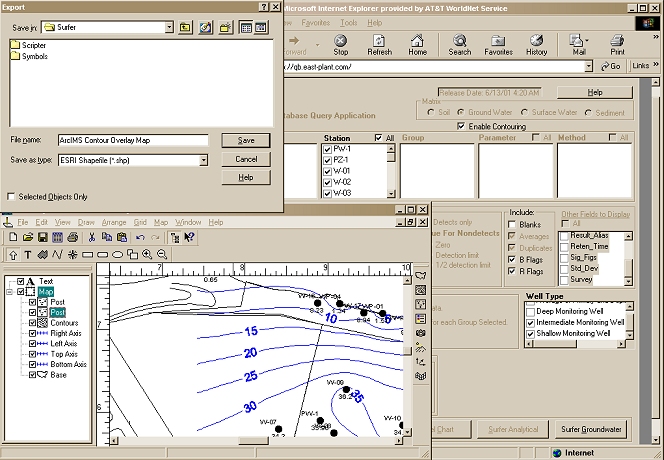
Figure 6. Contour Map Development with Internet Query Interface and Surfer Shape File Export.
The option to create and develop contour maps in Surfer permitted users to export these maps from Surfer as shape files for overlay as a local map source in the ArcIMS application suite of map layers.
Factors Considered in the MapObjects to ArcIMS Conversion Process
The conversion of the mapping tools from the MapObects to the ArcIMS application was relatively straight forward as all of the tools used in the MapObects application were readily deployed within ArcIMS Feature MapService. An added benefit of using the Feature MapService was the capability to save and manipulate map layers and integrate data from various local and remote sources, as well as save the project file during a mapping session. In addition, the MapTips tool within the MapObjects applications was available only in the ArcIMS Feature MapService.
Corrections to map layers based on the MapNotes tool could be made directly to shape files on the server and were immediately available to all users. With the MapObjects application, corrections were made to the shape files and the shape files were redistributed via email to the user group. The user group then had to copy the files to the corresponding application directory. The MapNotes tool and the centralization of the spatial database eliminated the extra time and effort needed in revising shape files and making them available to the user group.
Given that the Feature MapService was required for the MapObjects to ArcIMS conversion, key factors considered for the conversion process included:
For the conversion of the MapObjects applications described here, specific advantages of the ArcIMS application over the MapObjects application included the following:
With the advancement of the ArcIMS technology, the capability to effectively centralize and serve both the application maps and the tabular database was particularly useful and efficient. With the abundance of map tools available with ArcIMS, the conversion of the mapping application was relatively straight forward. The primary difficulties involved the integration of the tabular database query interface and the conversion of tabular database queries to map layers within the ArcIMS FeatureService Web page.
Summary
All of the map tools in the MapObects application were readily available in the ArcIMS Feature MapService. User requirements and integration of customized database query interfaces necessitated the use of the Feature MapService with customized Java script and MapObjects programming on the map server computer. Rather than use the third party charting packages integrated into the MapObjects application, Excel was utilized for charting. With Excel becoming a standard on many client computers, requiring the installation of Excel on the client computer was not a problem within the user group. An additional benefit of using the tabular database query interface was the ability to contour queried data sets of tabular x, y and z with Surfer program (Golden Software, 1999). While contour maps created with Surfer could not be directly overlain in the ArcIMS application map window, Surfer is capable of exporting the contour maps to shape files that could be used as a local data source for map overlays within the ArcIMS Feature MapService.
The ArcIMS application provided a basis for sharing information among a geographically diverse user group and provided the group with a uniform knowledge base for discussion of proposed and current site activities. Individuals could independently analyze the site data to formulate questions and conclusions prior to group meetings and site remediation discussions, and independently correlate diverse information through simple overlays using data and maps that previously only existed in paper copy documents. The MapNotes map tool was particularly useful in easily gathering requested edits and suggestions to map layers from the user group.
The client PC requires only an Internet browser and Java viewer files to interact with the application or tabular database query interfaces. The generalized nature of the application has permitted easy adaptability to other types of environmentally sensitive sites, specialized task specific mapping, data query applications, and data contouring. Coupled with the scalable nature of ArcIMS and SQL Server components, and the accessibility of an ArcIMS Web site with either an Internet Web Browser, ArcExplorer or ArcGIS, the application conversion ensures long term value over the expected life of the projects.
References
Golden Software, Inc., 1999. Surfer 7 User Guide Contouring and 3D Surface Mapping for Scientists and Engineers. www.goldensoftware.com
Author Information
Joseph F. Giacinto
ES&T, Inc.
3708 South Main Street,
Suite D
Blacksburg, VA 24060
Phone: (540) 552-0685
Fax: (540) 951-5307
Robert F. Nickols
ES&T, Inc.
3708 South Main Street,
Suite D
Blacksburg, VA 24060
Phone: (540) 552-0685
Fax: (540) 951-5307
James W. Bodamer
FMC Corporation
1735 Market Street
Philadelphia, PA 19103
Lonnie D. Norman
FMC Corporation
1735 Market Street
Philadelphia, PA 19103