Vegetation Mapping for San Juan Island National Historical Park, Washington

Robert A. Norheim, David L. Peterson

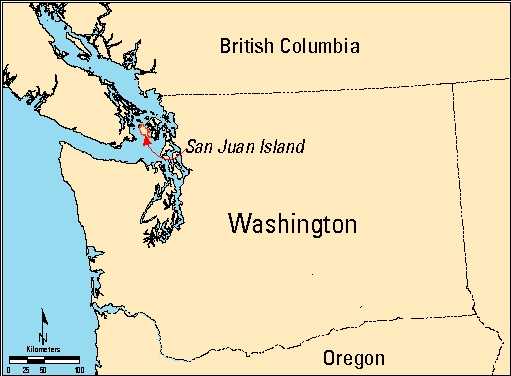
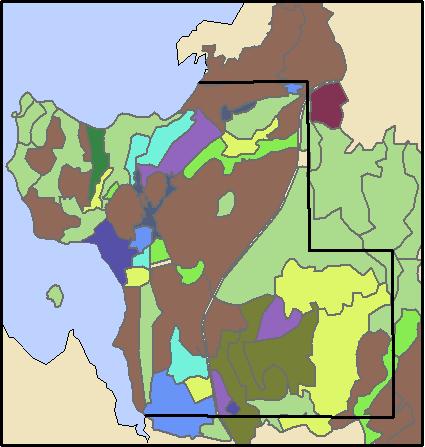
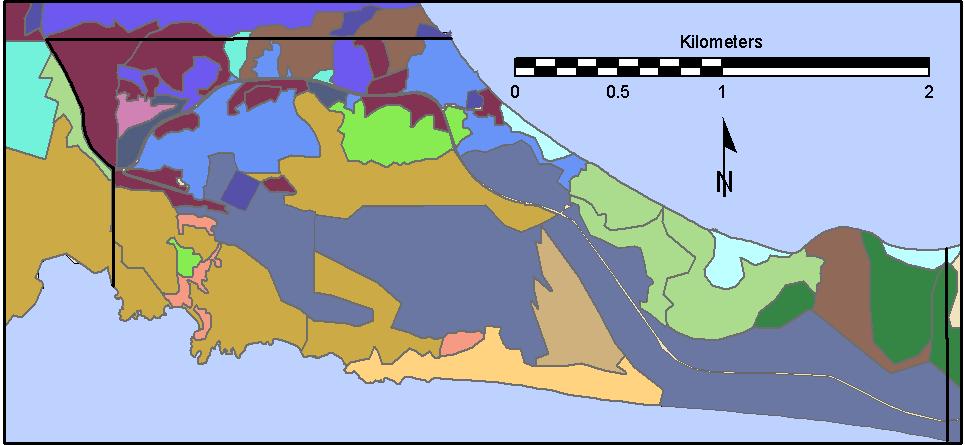
Abstract: We are developing geodatabases of vegetation and fuels for San Juan Island Historical Park using field-based classification and data collection.This will provide park managers with a valuable database relevant to scientific and managerial applications.We outlined patches on color DOQs, using color and texture clues in the imagery.We then conducted sampling in the field, touring all of each patch and revising boundaries as necessary.Because the park is only 715 hectares, we are able to achieve essentially 100% coverage.Allocation of heterogeneous patches to combinations of fuel models and community types led to some interesting cartographic results.


Introduction

San Juan Island National Historical Park (Figure 1) was founded in 1966 to commemorate the peaceful mid-1800s dispute between Britain and America over the alignment of the USA/Canada border between the Strait of Juan de Fuca and the mainland.The park is in two units, English Camp and American Camp, at opposite ends of San Juan Island, where each side stationed troops during the dispute.We developed geospatial datasets of the vegetation and fuels of the park to assist in park management. This is the first georeferenced description of the vegetation of the park and is intended to provide park managers and others with a valuable database relevant to scientific and managerial applications.The fuels component of the database will provide better understanding of fuels distribution and facilitate calculations of predicted fire behavior.

Figure 1.Location

Location Map

Background

Although the focus of park management is to interpret and preserve historical sites on the island, there are significant natural resource management objectives as well.Specifically, the park is to be managed such that the historic landscape (ca. 1850-1870) is maintained in perptuity.Variation in the visual and vegetative landscape of the park before, during, and after the historic period was described in some detail by Agee (1984).Ecosystem dynamics plus human activities have had a significant effect on park resources over the past 150 years.Managing for specific cultural landscape characteristics in the park is proving to be as challenging as ecosystem-based management for natural processes in other parks.

A key to management of vegetative resources at the park is knowing their current distribution and abundance and having a database available as a GIS coverage.An excellent description of the forested plant communities of the park was developed by Agee (1987), including some description of potential vegetation (through successional time), fuel characteristics, and limited geographic distribution.The scientific context for further analysis of vegetation and fuels at the park is provided by Agee (1984, 1987), National Park Service (1984), and Rolph and Agee (1993). The current project is to develop a geographically accurate and detailed map of vegetation and fuels for the park.

Because the park is located on a desirable island and has many vacation homes abutting the park boundaries, the park has a keen interest in understanding how wildland fires might behave in the park.The fuels component of this work will enable the park to run fire modeling software to understand potential fire behaviour.

Procedures

We used a visual examination of recent digital orthophotos as a basis for our work.We outlined vegetation patches based on color and texture changes and digitized the patches into a coverage.Printed map sheets with patch boundaries overlaid on the orthophotos, as well an ancillary information such as trails, were taken into the field.Because of the small size of the park (715 hectares) and the number of patches (138), we were able to do an exhaustive sampling of the park.We visited each patch and set up one to three plots in each forested patch to collect vegetation and fuels data.The boundaries determined from the orthophotos were verified in the field, and in some cases revised with the aid of GPS.The ability to visit many patches in a single day was a welcome change from our work in larger national parks where only a limited sampling is possible and many vegetation communities are far from the road.

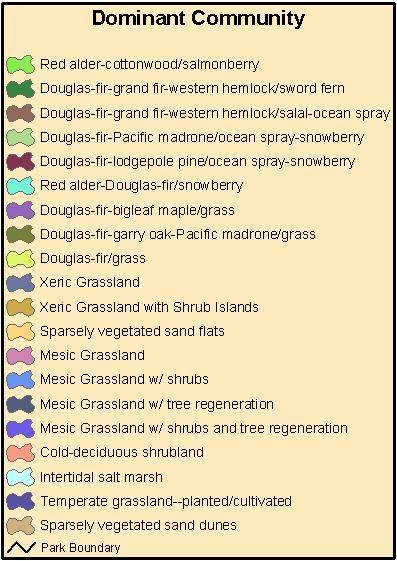
Vegetation was classified according to Agee (1987) and FGDC (1997).Agee's system consists of 11 plant communities relevant to the forested areas that dominate the park.These forest communities are based on empirical data and subsequent analysis that confirms the robustness of the individual communities as discrete entities.This classification provided an accurate representation of the forest composition of the park in terms of species dominance.

Data collected for each patch included an exhaustive species list for both overstory and understory plants, a tree survey, forest community, fuel model, ground fuels, and characteristics essential to calculating crown fuels.

Data from the field work was entered into a database.The field data was manipulated to produce statistics for each patch. For patches with more than one plot, data were averaged from the different plots. Stem count and basal area for each patch were derived from the tree survey. Number of communities per patch, number of fuel models, number of understory and overstory species, dominant fuel model and dominant community for each patch were determined from patch characteristics.Crown bulk density for each patch was determined from the modal tree and tree survey. Fuel loadings for each patch were determined from the ground fuels data.This provides the fuel variables necessary to run FARSITE (Finney 1998), which simulates the spatial and temporal spread and behavior of fire. We also developed a crosswalk from the Agee (1987) community system to the National Vegetation Classification System (NVCS) (FGDC 1997, USGS 1997) to meet the Department of Interior requirement that vegetation mapping use the NVCS.

Outcome

We transferred the major characteristics of each patch from the database to a geospatial coverage, enabling mapping of those attributes.Figure 2 contains maps showing the dominant community types per Agee (1987).Because each patch might have multiple plots, and each plot might reflect more than one community type, a patch could potentially have a number of community types.In the field, we recorded community types as a percentage of the area surrounding a plot.Thus, each patch may have several community types, expressed as a percentage.Several plots did not have a majority community type, so the dominant community type as mapped was the one with the greatest percentage.

Figure 2(a). English Camp

English Camp Vegetation Communities

Figure 2(b). American Camp

American Camp Vegetation Communties

Legend

Legend for Vegetation Communities

Acknowledgements

This work was funded by the National Park Service. We thank the Cascadia Field Crew (Sarah Schrock, Seth Kirby, Megan Wilson, Marnie Tyler, Don McKenzie, Steve Goodman, Amy Hessl, and Carolyn Menke) for their help with field work and Craig Dalby and Bill Gleason of the National Park Service for their assistance.Paige Eagle gave expert advice in MS-Access.

For more information

Please visit the San Juan Island National Historical Park web site at http://www.nps.gov/sajh/, and USGS FRESC Cascadia Field Station's web site at http://www.cfr.washington.edu/research.usgs/cascadia/.

References

Agee, J.K. 1984. Historic landscapes of San Juan Island National Historical Park. Report CPSU/UW 84-2. National Park Service, Seattle.

Agee, J.K. 1987. The forests of San Juan Island National Historical Park. Report CPSU/UW 88-1. National Park Service, Seattle.

FGDC. 1997. National vegetation classification standard, FGDC-STD-005. USGS Federal Geographic Data Committee, Reston, VA.

Finney, M.A. 1998. FARSITE: Fire Area Spread Simulator, model development and evaluation. USDA Forest Service Research Paper RMRS-RP-4.

National Park Service. 1984. Rabbits, redoubts, and royal marines. National Park Service, Seattle.

Rolph, D.N. and J.K. Agee. 1993. A vegetation management plan for the San Juan Island National Historical Park. Technical Report NPS/PNRUW/NRTR-93/02. National Park Service, Seattle.

USGS. 1997. The USGS-NPS Vegetation Mapping Program. Online document at http://biology.usgs.gov/npsveg.


Robert A. Norheim
David L. Peterson
USGS Forest and Rangeland Ecosystem Science Center Cascadia Field Station
University of Washington College of Forest Resources
Box 352100
Seattle, WA 98195-2100
norheim@u.washington.edu, wild@u.washington.edu
206 543-9138, 206 543-1587