DMJM+HARRIS is a national engineering firm that also provides planning and environmental services to a diverse array of public and private clients. Geographic Information Systems (GIS) is used as a planning tool to obtain existing conditions and impact analyses used in environmental assessments, impact statements, transportation studies, community development evaluations, and various other documents, as well as a helpful tool for resource surveys and inventories. Although environmental assessments are comprised of many components , this paper focuses on environment justice. In the following, environmental justice is defined, general uses of GIS in planning are illustrated, and the implementation of GIS in Environment Justice analysis is detailed.
Analyses of project impacts on minority and low-come communities are generally conducted to adhere to federal Executive Order (EO) 12898, Federal Action to Address Environmental Justice in Minority Population, the National Environmental Policy Act (NEPA), and the Department of Transportation Order to Address Environmental Justice Minority Population and Low-Income Populations (Final US DOT Order) . These federal orders amplify on Title VI of the Civil Rights Act of 1964, by providing protections on the basis of income as well as race.
The Clinton Administration's EO 12989, issued in 1994 requires "Each Federal agency [to] make achieving environmental justice part of its mission by identifying and addressing, as appropriate disproportionately high and adverse human health or environmental effects of its programs, policies, and activities on minority population and low-income population…" The Department of Transportation (DOT) published the Final US Order in 1997 , setting forth a process by which DOT and the its operating administration will integrate the goals of EO 12898 with its existing regulation and guidance. The Final US DOT Order defines key terms, and provides guidance for identifying and addressing disproportionately high adverse impacts to low-income and minority populations. Additional directive for implementing EO 12898 within the context of the NEPA process are provided by the Council on Environmental Quality (CEQ) in Environmental Justice Guidance under the National Environmental Policy Act .
These federals orders require considering social, economic, and environmental factors in the evaluation of proposed project actions. Therefore, direct and indirect impacts on minority and low-income populations are to be evaluated with the proposed action alternatives. These communities should have meaningful opportunities to engage in the development project's public process. In order to better understand the potential community impacts of a proposed action, impacts, appropriate socioeconomic data should be gathered. If the proposed action should have any adverse impacts, they should be minimized or mitigated. In addition, these protected communities should be addressed in terms of benefits received and impacts imposed in an equal basis to the boarder non-minority and non-low-income communities.
A minority person is defined as an individual of Black (not of Hispanic origin), Hispanic, Asian, Native American and Other origins. According to the Final US DOT Order, a minority population means any readily identifiable groups of minority persons that live in geographic proximity. CEQ guidelines state that minority population should be identified where either (a) the minority population of the affected area exceeds fifty percent, (b) the minority population percentage of the affected area is meaningfully greater than the minority population percentage in the general population or other appropriate unit of geographic analysis. Information on race and ethnicity could be analyzed down to the Census Block level utilizing the U.S. Census Population and Housing data. Census Block level data are the most detailed level of population data made available by the US Bureau of Census. In recent months, the US Census Bureau has released Census 2000 data on race and ethnicity to the down block level .
The Final US DOT Order defines low-income persons as those whose "median household" income is below the United States Department of Health and Humans Services poverty guidelines." CEQ Guidelines uses the Bureau of the Census definition that identifies low-income populations with the annual statistical poverty thresholds. This federal definition of poverty level varies by the number of related children under 18 years and family size. Average poverty thresholds in 1990 ranged from $6,652 for one person, to $26,280 for households with nine or more family members. Environmental justice analyses utilize U.S Census Population and Housing data. Although some Census 2000 data have been released, income data will not be available until 2002. Hence, 1990 Census income data or estimated derived from them are the data sets currently used for low-income population analysis.
Adverse impacts to minority and/or low-income persons are considered "high and disproportionate" if: (a) the adverse impact is predominantly borne by a minority population and/or a low-income population is more severe or greater in magnitude than the adverse impact that will be imposed by the non-minority population and/or non-low-income persons. The Final US DOT Order directs government agencies to determine disproportionate impact, taking into account mitigation, enhancement measures and all off-setting benefits to the affected populations, as well as the design, comparative impacts and the relevant number of similar existing system element in non-minority and non-low income areas.
GIS assists the analyses and visualization of a project development and its potential influences on its surrounding communities and their environments. The tool's mapping, data storage, querying, and quantitative analysis capabilities are based on linking a wide spectrum of data through a collection of layers that are geographically based. These data are a representation of things or events that exist and occur on or within the earth .
GIS provides a multi-facet approach to viewing data and solving complicated problems with comprehensive information from several sources. Insights produced from this information are helpful in all stages of a project: planning, alternative analyses, engineering, impacts assessment, mitigation, and facility management. These comprehensive insights facilitate collaboration among technical experts with diverse backgrounds (engineers, planners, architects and others) on a common complex problem, such as keeping a balance of aesthetics and functional requirements on design projects. Essentially, GIS takes data from different formats and sources to make comprehensive information about a location, so that informed decisions could be made or considered. It is a tool that enables project action professionals and laypersons including project area residents and decision makers to visualize existing conditions, analyze trends, and model alternatives and their impacts on the environment, economy, and surrounding population. With regards to the Environmental Justice, GIS provides an effective mechanism to map low-income and minority populations areas and assess project action impacts (beneficial and adverse), as well as compare these impacts to non-low-income and non-minority population areas.
US Census Bureau socioeconomic data is utilized to conduct environmental justice evaluations at Census Block level, the most detailed geographic level of census data. To define minority population, the census category P 12, Hispanic Origin By Race, differentiates Hispanics from Whites, Blacks, Asians, Native Americans, and Others (for the 1990 Census). Aggregating Black, Hispanic, Asian, Native American, and Other categories creates the minority attribute. To define low-income, the census category P 127, Poverty Status in 1989 by Age of Householder gives households below poverty by summing subcategories 16 to 30. (for the 1990 Census). To determine if an area is a predominately minority and/or low-income, 50 percent needs to be minority and/or low-income or a percentage that is meaningfully greater than the minority and/or low-income population percentage in the general population or other appropriate unit of geographic analysis, such as the city or county of the area being analyzed.
Census tabular information could be extracted from Census CDs or downloaded from the Census Bureau website. Census geographic boundaries, such as block and block group geographic files could be obtained from the GIS Data Depot, US Census Bureau or Esri websites. A unique records field that is common to both data sets join the attribute tabular data to the census geographic data. In the geographic file, this field is usually called link or identification field. In the tabular data set, it is created by concatenating state FIP codes, to county, track and block (or block groups) codes, respectively. This concatenated field should be created with a string data type to join the census tabular data to the census geographic file.
Although Census 2000 data are currently available, only minority population analyses could be conducted, since income data will not be released until 2002 . These data can be downloaded from the Census Bureau ftp site, which are readily available by state. Each data set contains data from the state level to the Census Block level. To define minority population use the PL2 category, Hispanic or Latino by Race from the PL 94-171 data set, which distinguishes Hispanics from Whites, Blacks, Asians, Native American, Other and Persons of Two or More Races. To create the minority population variable, the categories for Latino/Hispanic, Black,/African American , Native American, Asians, Native Hawaiians and Pacific Islanders, Other and Persons of Two or More Races are aggregated. The following section illustrates how Census 2000 data are used to conduct an analysis of the communities affected by aircraft noise from Logan International Airport, located in Boston, Massachusetts.
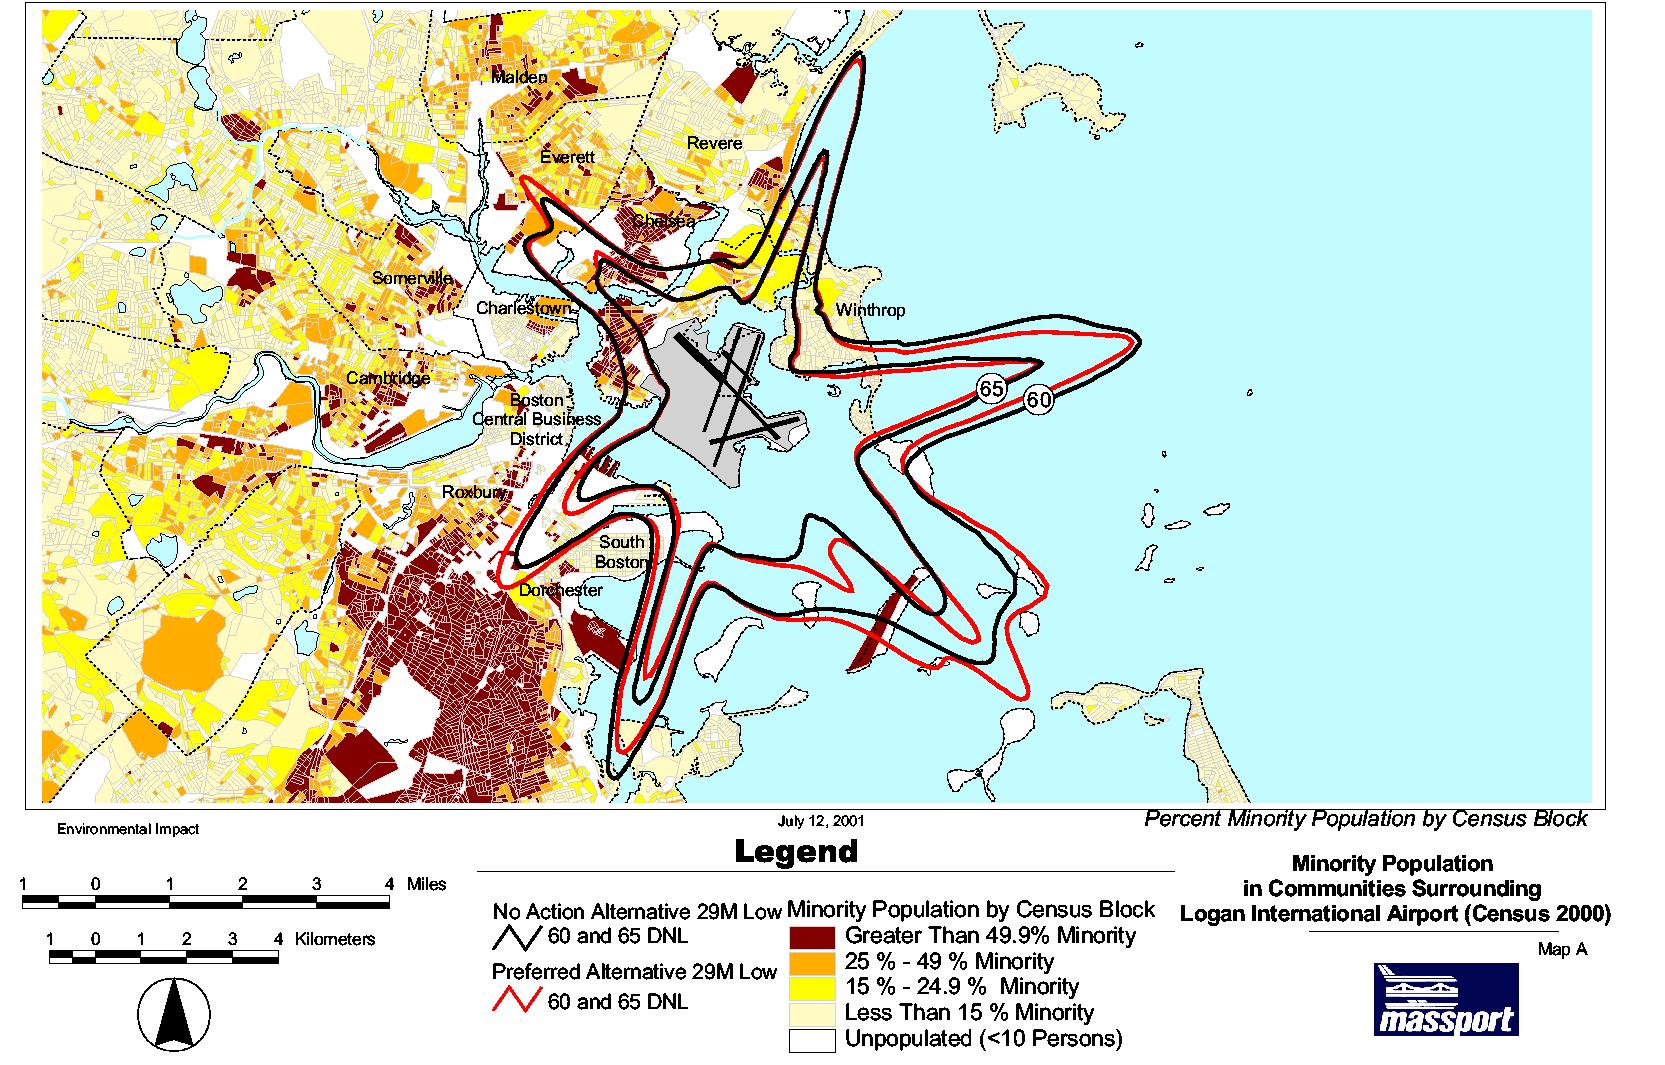
At the request of the Massachusetts Port Authority, US Census 2000 data were used for an Environmental Justice analysis of two airport alternatives, the 29 Million Low Fleet scenario for Alternative 1A (Preferred Alternative which includes a new uni-directional 5,000 foot runway) and Alternative 4 (No-Action Alternative) of the Logan Airside Improvements Planning Project. INM Noise Modeling analysis was conducted for the Preferred Alternative and No-Action Alternative to produce 65 and 60 dB DNL contours associated with each alternative . The noise contours were used with Census Block data to perform demographic analysis. GIS techniques were used to summarize and visualize demographic characteristics of the communities affected by aircraft noise, and estimate 2000 total and minority populations within the 65 and 60 dB DBL noise contours for the 29 Million Low Fleet the Preferred and No-Action Alternatives. The Environmental Justice analysis findings for the 29 Million Low Fleet scenarios for Alternative 1A (Preferred Alternative) and Alternative 4 (No-Action Alternative) utilize the 1990 and 2000 Census of Population demographics in the comparison of the scenarios.
With regards to Logan International airport's surrounding cities, Boston, Chelsea, Revere and Winthrop, the total 2000 population affected by the 65dB DNL noise contour was 689,807, which represents approximately a 4 % increase over the 1990 population of 663,906. The minority population has also increased for these cities. In 1990, the minority population accounted for 38% of the total population (in the four cities) and 309,622 persons in 2000, representing 48% of total population (see Table 1).
Between 1990 and 2000, overall population also has grown for the communities within 60 dB DNL (Boston, Chelsea, Revere, Winthrop, and Everett), from 699,607 in 1990 to 727,844 in 2000, a 4% increase. In the same period, these communities' minority populations increased from 254,479 persons, 36 % of population in 1990 to 339,722, and 48% in 2000 (see Table 2). East Boston is the community with the largest minority population, representing 50% of total persons in 2000. Hispanic/Latinos represent the largest minority group in East Boston, 39% of total persons. Map A illustrates the concentration of minority persons throughout the Boston-area. East Boston and Chelsea have the largest concentration of minority persons affected by aircraft noise.
The overall population within the 65 and 60 dB DNL noise contours for the No-Action Alternative (Alt 4) and Preferred Alternative increased from the 1990 census. These population increases were a reflection to the population increases in surrounding communities (see Table 1 and 2). The 2000 census minority population affected by the 65 dB DNL noise contours for the No-Action and Preferred Alternative also increased, but there percentages were less than the 2000 benchmark minority population of Boston, Chelsea, Revere and Winthrop. Minority population affected by the 60 dB DNL for the 2000 census population also increased in population but were less compared to the 2000 benchmark minority population percentage of Boston, Chelsea, Revere, Winthrop and Everett (percentage). Therefore, there are no disproportionate impacts to the minority population for either No-Action or Preferred Alternatives. With regard to comparing the Preferred and No-Action Alternatives, total 2000 minority population within the 65 dB DNL the analyses show no relative difference in Alternative impacts between 1990 and 2000.
Environmental Justice analyses are required by federal orders to minimize adverse project impacts on potentially more vulnerable populations, as well as to foster equal benefits. Federal guidelines provide minimum requirements for Environmental Justice analysis. Local and regional jurisdictions define Environmental Justice criteria to address regional nuances and meet local needs. For example, the Boston Metropolitan Planning Organization convened an Ad Hoc Environmental Committee to define Environmental Justice, as well as set criteria and measures to address mobility issues of Environmental Justice community. Mobility criteria examine transit and highway mobility. Quality of life issues are considered that included noise pollution, air quality, and aesthetics. GIS provides planners with a powerful tool to obtain comprehensive information to analyze and visualize impacts and benefits between populations. These insights produce a better understanding of complex problems so that informed decisions are made. In the Environmental Justice analysis of Logan International Airport noise contours, GIS are used to analyze Census data and produce maps and tables that show no relative differences between the No-Action and Preferred Action Alternative impacts between 1990 and 2000. These analyses also illustrate the demographic change and population increases in communities between 1990 and 2000, which could be a starting point to access a community's evolving needs.
Chou, Yue-Hong, Exploring Spatial Analysis in Geographic Information Systems, Onword Press, 1997.
Davis, Bruce, GIS A Visual Approach, Onword Press, 1996.
Mitchell, Andy, The Esri Guide to GIS Analysis: Volume 1, Geographic Patterns & Relationships, Environmental Systems Research Institute, Inc, 1999.
Council on Environmental Quality Environmental Justice. Guidance Under the National Environmental Policy Act 1997.
U.S. DOT April 15, 1997 Final Order 5610.2, Federal Register Volume 62, no. 72.