Stream Floodplain Delineation using
3-Dimensional GIS
Leonard Sekuler, P.E. and Betsy Yingling, P.E.
Abstract
A 3-dimensional GIS was created for Doan Brook to:
Doan Brook flows northwest into Lake Erie. It is approximately 9 miles long and drains 7,500 acres east of Cleveland, Ohio. This urban stream suffers from frequent flooding. The extent of overbank flooding was determined by displaying hydraulic modeling results in a 3-dimensional GIS. By delineating flood plains for different model scenarios, reduction of stream flooding was assessed for any given watershed-improvement alternative.
Key words: Floodplain delineation, 3D Analyst
Introduction
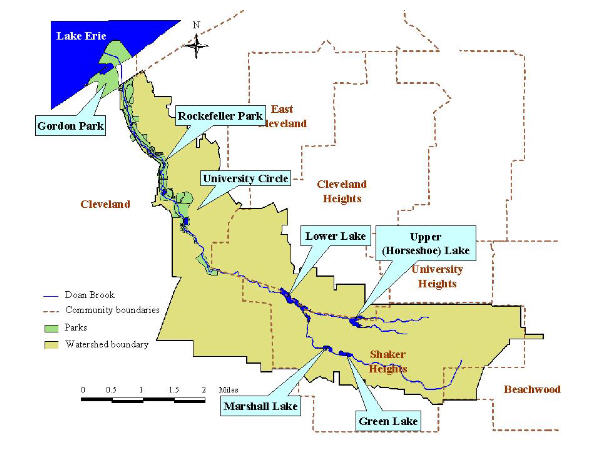
Doan Brook is a small headwater tributary to Lake Erie that flows through the northeast Ohio communities of Shaker Heights, Cleveland Heights, and Cleveland. Doan Brook�s total length is approximately 9.4 miles. Figure 1 is a watershed map of the area.
Doan Brook is a focal point of cultural and natural history for Cuyahoga County and nearby areas. The area was first settled in 1789 by Nathaniel Doan. Other settlers, attracted by the stream�s steep gradient as a source of inexpensive hydraulic power, soon followed. Several dams were built along Doan Brook to run grist and woolen mills. Today, the old mills are gone and the basin consists of residential neighborhoods interspersed with urban parks, museums and golf courses.
In the upper watershed, significant features include Upper (Horseshoe) Lake, Lower Shaker Lake, Green Lake, and Marshall Lake. These lakes are effective at attenuating peak stream flows. The stream is generally located in a natural, open-channel setting. However, at its upstream end, Doan Brook borders two golf courses where it is channelized.
The stream travels through a deep gorge ravine, and eventually enters University Culvert, a mile-long section of pipe beneath University Circle. University Circle is known for its rich cultural and educational facilities, including museums, hospitals and the campus of Case Western Reserve University. In the lower watershed, Doan Brook again becomes an open-channel, and meanders through Rockefeller Park. At its downstream end, Doan Brook enters another culvert near Gordon Park before entering Lake Erie.
Figure 1
Doan Brook Watershed Study Area
Urbanization has impacted natural conditions of Doan Brook. The 7,500- acre watershed has been mostly developed. Estimates of impervious surface in the watershed range as high as 40 percent. Streets, parking lots, homes, and other structures cause increased runoff during rain storms and spring thaws. Flooding can be severe in some areas.
A 3-dimensional GIS was created for Doan Brook to develop a graphical representation of the floodplain for a variety of design storms. This process illustrates the reduction of stream flooding for any given watershed-improvement alternative. This paper summarizes work conducted for the Northeast Ohio Regional Sewer District (District) as part of the Doan Brook Watershed Study.
Methods and Materials
A 3-dimensional GIS was created for Doan Brook to transform model results into a graphical representation of the floodplain for a variety of design storms. Two essential data sources were required: (i) topology, and (ii) flood elevations.
Topology
A Digital Terrain Model (DTM) is a 3-dimensional representation of the ground surface. A DTM was created using the ArcView version 3.1 extension, 3D Analyst. The origin of the digital-terrain model was the 2-foot topographic contour lines obtained from the Cuyahoga County Planimetric files. These contours extend from the upstream to the downstream end of Doan Brook. Using the 3D Analyst extension, a 3-dimensional surface was generated from the contour lines. The program uses the contour lines as known elevations, and interpolates the value of the ground surface between contour lines to produce a continuous area with defined surface elevations. This digital terrain model becomes the representation of the ground surface for future use.
Flood Elevations
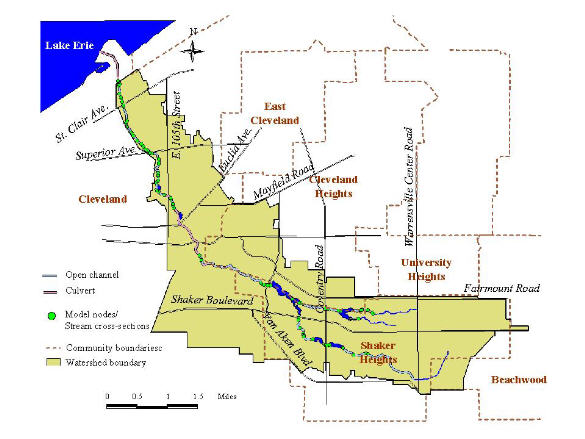
During the Doan Brook Watershed Study, a hydraulic model was developed to evaluate Doan Brook�s carrying capacity and flooding characteristics. U.S. EPA�s Storm Water Management Model (SWMM) was used for model simulations. The RUNOFF block was used to model storm water basins discharging into the stream through an outfall pipe. The EXTRAN block was used to route flows down the stream, and through a series of lakes, culverts and natural channels before discharging to Lake Erie. Additionally, combined sewer overflow loads were imported from a collection system model. During the model-development phase, field cross-section surveys were conducted at bridge crossings, lake-control structures, and several key open-channel locations. Figure 2 illustrates the stream hydraulic model network and locations of field surveys. These survey locations served as model nodes.
Hydraulic model simulations were performed to obtain peak flooding elevations at model nodes. This data had to be transformed into a 3-dimensional water surface profile for delineating floodplains. Using the 3-dimensional GIS, a water-surface profile was produced by interpolating between these points.
A floodplain is the area that would be inundated by a storm (i.e., extent of overbank flooding). A floodplain was visualized by overlaying the 3-dimensional representations of the ground and peak water surface profile. This was readily performed in the GIS, and the floodplain was clearly delineated. By creating 3-dimensional water profiles for different model scenarios, the reduction of stream flooding was assessed for any given watershed-improvement alternative.
Floodplain extent was evaluated under 3 scenarios: (i) existing conditions, (ii) baseline conditions, and (iii) the recommended plan.
Figure 2
Stream Model Network and Cross-Section Survey Locations
Existing conditions represent current flooding conditions in Doan Brook (i.e., during the data-collection phase of the project). Baseline conditions represent anticipated flooding characteristics of Doan Brook after known capital improvements to the sewer system are completed. Construction of the Heights 7 Tunnel and its tributary relief sewers are the most significant activities that have an impact on Doan Brook in the near future. This construction will allow separate sanitary sewer flows in the upper watershed to be intercepted and transported directly to the Easterly Wastewater Treatment Plant for treatment. These separate sanitary sewer flows would otherwise flow into the lower watershed via combined sewers and possibly overflow to the stream during wet weather events. Therefore, it is expected that tunnel construction may slightly reduce the severity of flooding in Rockefeller Park along Martin Luther King Jr. Boulevard, where flooding currently is the greatest problem.
The recommended plan scenario represents the flooding characteristics of Doan Brook after recommendations from the Doan Brook Watershed Study are enacted. This includes improvements to the sewer system that would drastically reduce combined sewer overflows to Doan Brook, as well as channel improvements to Doan Brook that are intended to reduce flooding in the lower watershed.
The following design storms were used to evaluate floodplain extent:
Results
The stream model produced flood elevations at each stream cross-section. A 3-dimensional, water-surface profile was produced for each design storm, using the ArcView 3D Analyst extension. The floodplain was determined by overlaying the water surface profile with the digital terrain model (DTM).
The floodplain can be illustrated in either 2D or 3D. A "cut-fill" analysis is performed to obtain the 2-dimensional floodplain extent. The cut-fill analysis is a function in ArcView 3D Analyst that compares two surface models. Using this function, a shapefile can be created that includes only those areas where the water surface is higher than the ground, (i.e., the extent of the floodplain).
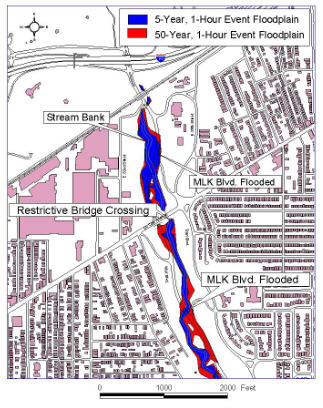
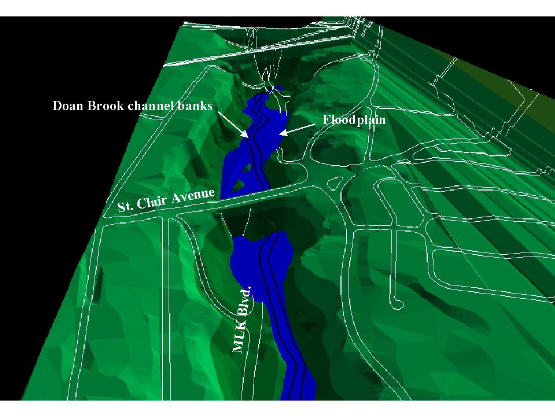
Figure 3 illustrates the floodplains delineated for the 5-year, 1-hour storm and 50-year, 1-hour storm in Rockefeller Park during existing conditions.
Figure 3
Floodplain Delineation in Rockefeller Park
Existing Conditions
Reduction of stream flooding for a given watershed alternative can be quickly visualized by performing the model simulation, and displaying the results in the 3-dimensional GIS. Figure 4 illustrates the floodplain of a 5-year, 1-hour storm under existing and baseline conditions in Rockefeller Park along Martin Luther King Jr. Boulevard where flooding is the most severe. Comparison of these two figures illustrates the limited effect the sanitary sewer tunnel construction has on reducing stream flooding in Doan Brook under the 5-year, 1-hour storm.
Figure 4
Rockefeller Park Flooding during 5-Year, 1-hour Storm
Existing and Baseline Conditions
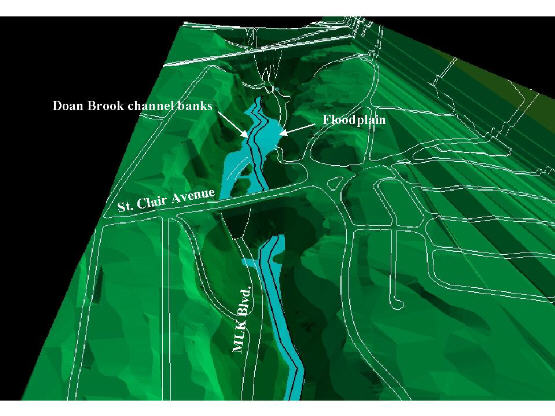
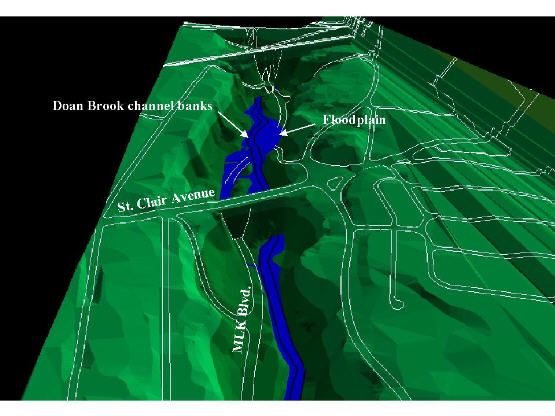
Figure 5 illustrates the floodplain for the 50-year, 1-hour storm at this same location under existing and baseline conditions. Comparison of these two figures illustrates that the tunnel construction also does not have an impact on stream flooding during this larger storm event.
Figure 5
Rockefeller Park Flooding during 50-Year, 1-hour Storm
Existing and Baseline Conditions
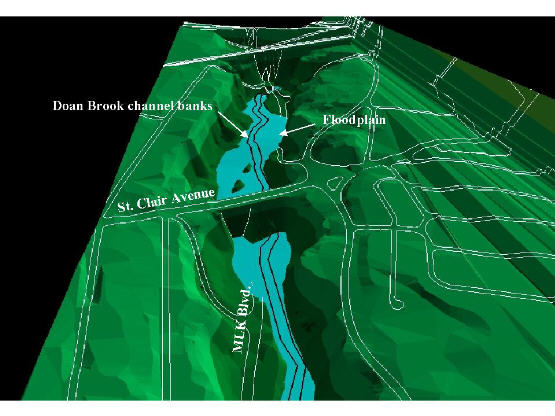
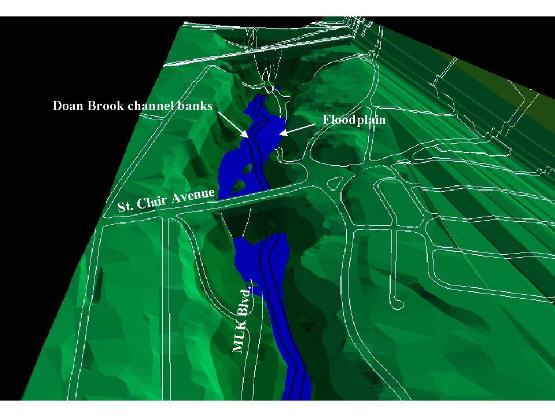
Figure 6 illustrates the floodplain extent of the 5-year, 6-hour event during baseline conditions and in the recommended plan. As shown in these two figures, flooding is significantly reduced when proposed sewer and channel improvement projects in the recommended plan are completed.
Figure 6
Rockefeller Park Flooding during 5-Year, 6-hour Storm
Baseline Conditions and Recommended Plan

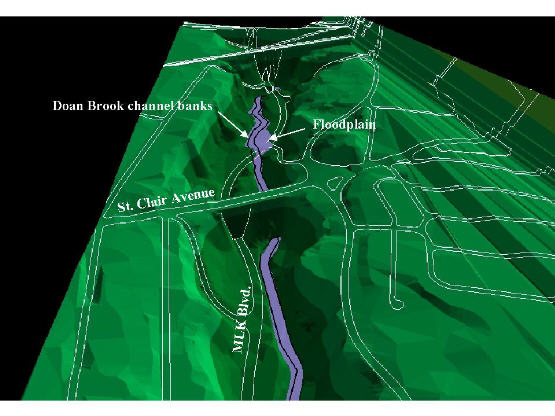
Figure 7 illustrates the floodplain extent of the 50-year, 1-hour event during baseline conditions and in the recommended plan. Similarly, flooding is significantly reduced during this larger storm event as well.
Figure 7
Rockefeller Park Flooding during 50-Year, 1-hour Storm
Baseline Conditions and Recommended Plan

Discussion
To facilitate community acceptance of recommended solutions addressing combined sewer overflows, water quality, and stream flooding, the Northeast Ohio Regional Sewer District utilized a committee of interested stakeholders as a mechanism to develop evaluation criteria and to score alternative strategies based on those criteria. A Doan Brook Study Committee was convened for this purpose. Membership of the committee included institutional and governmental representatives from the watershed�s three municipalities (Cleveland, Cleveland Heights, Shaker Heights), residents and neighborhood groups in the watershed, and environmental or other special interest groups. Additional information on the Doan Brook Study Committee is presented in the Doan Brook Watershed Study Report.1
The 3-dimensional GIS was effective in illustrating the extent of flooding to the Doan Brook Study Committee, whose members were generally non-technical. This was important because the Doan Brook Study Committee was involved in the decision-making process to determine what recommendations should be made to reduce flooding. Therefore, there was a need for this visual tool to help Committee members visualize flooding problems.
The 3-dimensional GIS was used successfully to illustrate flooding and to delineate floodplains. A floodplain for any simulated storm event can be visualized by utilizing flood elevations obtained from the stream model and topography.
Future users of a 3-dimensional GIS to delineate floodplains should be aware of several key points. Accuracy of the topographic information is critical to the success of delineating floodplains in 3D. In this study, the digital terrain model was extrapolated from 2-foot contours, which may not be refined enough for some other types of studies. Stream modeling is typically conducted to higher degree of precision. The extent of the floodplain can be very sensitive to small changes in the DTM.
In addition, accuracy of the hydraulic model is key to the success of delineating floodplains. The 3-dimensional GIS simply visualizes flood elevation results from the model. Therefore, if model accuracy is compromised, the floodplain delineation is questionable.
Adequate computer memory was also critical to successful performance of the ArcView 3D Analyst extension. During this study, computer memory had to be upgraded to 384 MB with an adequate hard drive buffer in order for the program to display the digital terrain model. Additional memory would be beneficial and reduce regeneration time.
Acknowledgements
We would like to thank the Northeast Ohio Regional Sewer District for assisting in the review of this paper, and allowing us to share information presented in this paper. Furthermore, we would like to thank the United States Environmental Protection Agency (U.S. EPA) who provided grant funding for the Doan Brook Watershed Study.
End Notes
References
Montgomery Watson and XCG. Doan Brook Watershed Study: Model Development and Calibration Report October 2000; Prepared for the Northeast Ohio Regional Sewer District.
Author Information
Leonard Sekuler, P.E.
Senior Engineer
Montgomery Watson
1300 East Ninth Street, Suite 1100
Cleveland, OH 44114
Betsy Yingling, P.E.
Planning Engineer II
Northeast Ohio Regional Sewer District
3826 Euclid Avenue
Cleveland, OH 44115