Using GIS to Model and Predict Likely Archaeological Sites
Authors
Christopher Ohm Clement, Sahadeb De, Robin Wilson Kloot.Abstract
The South Carolina Institute of Archaeology and Anthropology (SCIAA) and the Earth Sciences and Resources Institute of the University of South Carolina (Esri-USC) collaborated to develop a predictive model for likely archaeological sites using available data sources. The study area covered 111 7.5' Digital Orthophotographic Quadrangles or roughly one-third of the area of the State of South Carolina. The model made extensive use of floodplain, hypsographic, and Digital Elevation Model (DEM) data. This paper discusses the predictive model, its results, and some of the issues faced during the project related to data management and innovation.
Introduction
Throughout time, people have been closely tied to their natural and cultural environments; these environments were a significant determinant in their choice of settlement. An understanding of the natural and cultural environment related to past peoples and their settlements, therefore, allows the archaeologist to make predictions about similar, but as yet undiscovered sites. For instance, historic sites have traditionally been located along old roads. Gillam (2000) was able to predict historic sites with some accuracy by using historic map data, rectified to and overlaid on current USGS 7.5ĺ Digital Othrophotographic Quadrangles (DOQĺs). This method requires the creation of new data through the scanning and rectifying of historic maps, location of a number of ground control points for rectification and finally, the digitization of salient features. Prehistoric settlements, however, are usually associated with natural features, the strongest being proximity to water. Other environmental variables that may be considered in the location of prehistoric sites and combined with proximity to water may include topography (gentle slopes, small rises in flood plains) or soil type. This methodology is not new to the archaeologist who would makes use of a hard copy topographic map as the primary tool to predict where good sites may be located. In order to make these predictions over a large area, covering many topographic maps, the archaeologist would be greatly aided by a GIS-based model. This article documents the development and testing of a parsimonious GIS-based model that predicts the location of prehistoric settlements using existing, publicly available data only.
Background
Willamette Industries, Inc. is a diversified, integrated forest products company with a number of manufacturing facilities located in several states and overseas. In South Carolina, Willamette owns approximately 108,000 acres on 375 properties covering 111 7.5ĺ DOQĺs. The company, aware of its stewardship responsibilities towards natural and cultural resources on its property (Willamette website, 2001), contracted with the South Carolina Institute of Archaeology and Anthropology (SCIAA), University of South Carolina, to:
The objectives of the work were to provide Willamette with an initial data set on which to base immediate management decisions while planning for the future. This work was to be completed within 6 months on a limited modeling budget.
Site assessment and Identification of Known Sites
This project did not fall under the strict legal guidelines of Section 106 of the National Historic Preservation Act, which stipulates a very formal method of survey and evaluation. This allowed SCIAA to loosely define the archaeological significance of sites on Willamette holdings, and for the purposes of this study, "significance" was defined on three levels (Table 1).
Table 1: Definition of Site Significance in the Project
|
Significance |
Description |
Example |
|
Level I Sites |
Includes sites that are both legally significant (can provide information important to history or prehistory) and highly visible on the landscape (enhancing public interpretation of the site). Often located on floodplains. |
|
|
Level II Sites |
Legally significant sites containing primarily buried elements. With excavation, these will be clear enough for public interpretation in a printed medium (i.e., a popular report). Often located on floodplains. |
|
|
Level III Sites |
Potentially legally significant or not eligible to the National Register of Historic Places, but would require greater effort to generate useful public interpretation. Many such sites exist in all geographic contexts. |
|
Willamette's landholdings were examined in relation to known archaeological sites listed in the South Carolina Archaeological Site Files using GIS data layers provided by
Willamette and those maintained at SCIAA. Based on these data, 58 known sites were noted on, in whole or in part, Willamette holdings. Many of these sites were recorded years ago using standards that are difficult to assess within the parameters described above. SCIAA used a modified version of the formal evaluation procedure required by law to evaluate the sites based on National Register of Historic Places criteria. An example of a formal site form is available on the SCIAA web site (SCIAA, 2001). Known sites on Willamette holdings were identified as Level I, Level II, or Level III by examining site form data. Site form data fall under major headings that include general information, environment and location, site characteristics, archaeological components, methods employed during discovery, and data recovered.
The Need for a Predictive Model for Archaeological Sites
In addition to the known sites on Willamette property, many other sites have yet to be identified. Predictive modeling would give Willamette the option to avoid areas where significant resources are likely to exist until field investigation could confirm their presence.
The premise behind modeling is that historic and prehistoric peoples were closely tied to their natural and cultural environment, and that these environments were a significant determinant in their choice of site location. Predictive modeling examines soils, distance to water, and slope as potential natural variables, and subsistence systems, transportation systems and previous settlement as potential cultural variables. The intended outcome was a spatial depiction of probability zones outlining geographic areas with a high likelihood of Level I or Level II resources, correlated with individual company tracts of land.
GIS systems allow the overlaying of spatial data from different sources, using different structures and resolutions, thus providing a tool for modeling spatial data (Goodchild, 1993). Willametteĺs desire to be good stewards presented SCIAA with an ideal opportunity to develop and test a simple predictive model on a large scale (111 USGS 7.5" quadrangles) against the 58 known archaeological sites on Willamette property. SCIAA partnered with the Earth Sciences and Resources Institute of the University of South Carolina (Esri-USC) to build the GIS-based model through its competency in the area of GIS modeling of hydrologic and conservation systems (Rine and Covington, 1999; Covington et al, 2000). SCIAA model parameters (Table 2) were used as a starting point for the process.
Table 2: Initial modeling parameters for spatial predictive model to determine archaeological sites.
|
High Probability Zone for: |
Model Parameters |
|
Level I Sites |
Low Rises (+/-) 5ft within floodplains, OR low rises (+/-) 5ft immediately adjacent to floodplains, AND 100 meters or less from mapped permanent water source. |
|
Level II Sites |
Slope less than 5%, AND 200 meters or less from a mapped, permanent water source OR 200 meters from mapped floodplain soils. |
|
Level III Sites |
More than 200 meters from mapped water source AND more than 200 meters from mapped flood plain soils. |
Predictive Model
Data Acquisition
The data sets required for this model included:
The above data were acquired for the 111 Digital Orthophotographic Quadrangles (DOQĺs) from various sources. Linear hydrography data sets were downloaded by county from USCĺs Geographic Information Center (USC GIS, 2001). Hypsographic data were downloaded by DOQ from the South Carolina Department of Natural Resources (SCDNR) GIS Data Clearinghouse system (SCDNR, 2001).
Flood plain data were not readily available. The original intent was to use Soil Survey Geographic (SSURGO) data to approximate flood plains - this is done by selecting Ĺfrequently floodedĺ polygons only. Of the study area, however, soil data were available for 33 DOQĺs - these were primarily in the lower lying (i.e., Coastal Plain) regions of the state. Floodplain approximations were thus required for the remaining 78 DOQĺs, requiring some Ĺbootstrapĺ techniques. To obtain floodplain approximation, therefore, Esri-USC, after some consultation with SCIAA, decided to use the following method:
The areas selected by this process are reasonable approximations of the flood plains in this hilly (i.e., Piedmont) part of the study region. Spot checks of the vector data over topographic quadrangle sheets confirmed a good visual correlation between generated vector data and flood plain demarcation on the topographic sheet.
Processing power to do the above exercise once for all 78 DOQs was not available, while the process would have taken excessive manpower input on a individual DOQ basis. Esri-USC chose a compromise route by dividing the 78 DOQs into four contiguous areas (of 17-21 DOQs each) and then proceeding with the bootstrap approach.
Model Development
The initial parameters (Table 2) developed by SCIAA served as the basic guidelines for model development.
In order to identify the High Probability Areas for Level I sites, consisting of low rises within or immediately adjacent to flood plains, Esri-USC created a vector theme that included the floodplains and a 100 m buffer layer around the flood plains. From this theme, only the closed contours (i.e. those that fell entirely within the buffered flood plain theme) were selected. The areas within these closed contours were designated High Probability Areas for Level I sites.
In order to create a Level II site High Probability model, Esri-USC used the following procedure:
Layer 4 = Layer 1 * (Layer 2 + Layer 3)
The grid cells with positive nonzero values were then converted back to a vector layer and were designated as High Probability Areas for Level II sites.
Although Esri-USC created the model in conjunction with SCIAA, the actual locations of known sites on Willamette property were intentionally not shared with Esri-USC. This strategy allowed model testing by SCIAA independent of Esri-USC with "fresh" data (i.e., data that has not been used to calibrate the model in the first place).
Results
The assessment results of the 58 known archaeological sites (Table 3) formed the basis of the model testing. In addition to paper records, the South Carolina State Archaeological Site Files maintains a nascent GIS coverage of known sites within the state. Currently, this consists of simple site locations, digitized as polygons off of 7.5ĺ USGS Quadrangles.
Table 3: Results of SCIAA site level evaluation and subsequent test against Esri-USC level I and level II model.
|
Significance |
Number of known sites identified on Willamette property |
Analytical results |
|
Level I Sites |
5 (1 prehistoric, 4 historic) |
The one known prehistoric site fell within the Level I modeled area. |
|
Level II Sites |
5 |
All five sites (100%) fell in the modeled area. |
|
Level III Sites |
32 |
Five (16%) fell within the Level I or II areas. |
|
Undetermined Sites |
16 |
Eight (50%) fall within the Level II predictive model area. |
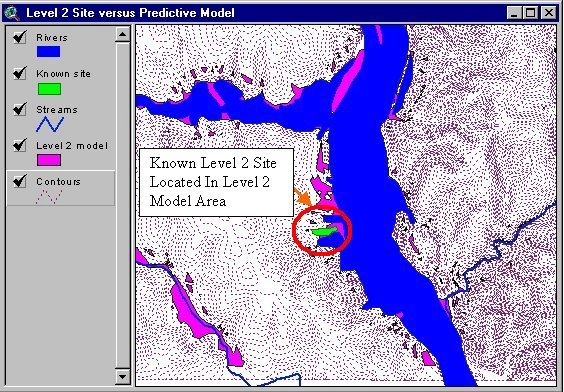
SCIAA initially intersected these data with coverage of Willamette holdings to determine how many sites occupy Willamette lands. For model assessment, the resultant site locations were layered over the Level I and Level II High Probability polygon vector layers generated by Esri-USC. Each known site location was checked to determine if it fell in the appropriate model area, for example, if a known level II site fell within or intersected the modeled polygon area, the known site was located as predicted by the model (Figure 1).
Figure 1: Level 2 site versus predictive model area.
Discussion
Of the 58 sites on Willamette property, five were evaluated as Level I, five as Level II, and 32 as Level III. The remaining sites could not be evaluated because there was insufficient data in the State Archaeological Site Files. Of the five Level I sites, one is a prehistoric site containing earthen mounds while four are historic sites. Only the mound site and one historic site fall into the High Probability Area for Level I sites. These results revealed the principal shortcoming of the model: without GIS coverage of historic road networks, it is virtually impossible to model locations of historic sites. This project explicitly relied on publicly and readily available data for model generation. As a result, historic road networks could not be modeled. In contrast to the situation for historic sites, prehistoric sites are closely tied to the river and stream network, which is readily available in GIS format.
The close relationship between area hydrology and archaeological sites is borne out by the success of the Level II High Probability Modeling effort. Of the five Level II sites on Willamette property, all are prehistoric and all are located within the Level II area.
The utility of the model is not only measured by how well it includes appropriate sites, but by how well it excludes other sites. Only 16% (n=5) of the Level III sites occur within the area defined as high probability for Level I or Level II sites. The remaining 27 Level III sites fell outside the areas defined by the model parameters.
Finally, the modeling effort allows some prediction about known sites for which insufficient data was available for assessment. Of these 16 sites, 8 (50%) fall within the area defined by the Level II predictive model. Based on the known results of the modeling effort, most of these are likely Level II sites. In contrast, the 8 known sites which fall outside of the modeled area are, according to the model, unlikely to produce significant archaeological data.
Conclusions
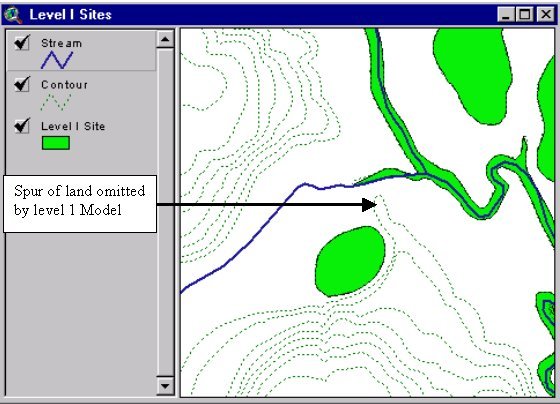
The model itself appeared to be robust and useful, however some areas will have been omitted by the model. The model is not able to account for low rises adjacent to the foothills (Figure 2). This is because the procedure used only selects the area with closed contours as Level I sites. The contours of these low rises may encompass the entire hill and thus would not fall entirely within the buffered flood plain, yet such an area may well be a significant site. Digital hypsographic data with smaller contour intervals (less than 10 ft/contour) would improve resolution and partially solve this problem. To date, no other automatic solution apart from digitization of each instance is known.
Figure 2: An instance where a high probability area is omitted by the level 1 model.
Archaeological probability models are an important consideration in land-use planning because they provide a cost-effective way to target areas in need of protection or additional work prior to the development of that land. From a strictly legal perspective, such as that driven by Section 106 of the National Historic Preservation Act, although intensive survey to locate sites is still necessary to ensure they are not unknowingly destroyed, fewer significant sites are likely to be present in low probability areas. The end result from a management standpoint is twofold. First, although extensive and detailed survey is still necessary, the associated costs are mitigated by the decreased site density and resultant decrease in survey time devoted to defining site boundaries and contents once they are located. Second, expenditures for testing or data recovery on significant sites that may be impacted by new or continued land-use practices can be reduced because proportionally fewer sites requiring these measures occur. In the case of this project, Willamette Industries can continue to operate as usual in areas outside the high probability areas for Level I and Level II sites, allowing a high level of confidence that significant archeological sites will remain undisturbed. Additionally, they can also avoid or modify their timbering methods within areas that are likely to contain significant sites, and thus effectively fulfill their stewardship role, with the understanding that once these areas have been examined archaeologically, timbering operations may resume in the absence of significant sites.
References
Covington, E., Kloot, R.W. and Atkins, J.B. Tool for Animal Feeding Operations Siting. In Proc. Esri Userĺs Conference, July 2000, San Diego, CA. ArcUser magazine October-December 2000 Issue.
Gillam, J.C. Improving Historic map Accuracy with GIS. In proceedings of annual conference of Society for American Archaeology, April 8, 2000.
Goodchild, M.F. 1993. The state of GIS environmental problem-solving. Chapter 2. Pp 8-15, in Goodchild, M.F., Parks, B.O., and Staert, L.T. (Eds.), Environmental Modeling with GIS; N.Y.: Oxford Univ. Press. 488pp.
Rine, J. M., E. Covington. "Watershed Approach to Source Water Assessment and Protection Utilizing GIS-Based Inventories: A Case Study in South Carolina", Conference Proceeding of U.S. EPAĺs Environmental Problem Solving with Geographic Information Systems. Cincinnati, OH September 1999.
South Carolina Department of Natural Resources GIS Data Clearinghouse Home Page, http://www.dnr.state.sc.us/water/nrima/gisdata Available: (May 18, 2001).
University of South Carolina GIS Site, (http://www.cla.sc.edu/gis) Available: (May 18, 2001)
University of South Carolina, South Carolina Institute of Anthropology and Archaeology. Site forms. http://www.cla.sc.edu/sciaa/staff/gillamh/forms/siteform.html Available: (May 18, 2001)
Willamette profile http://quicken.aol.com/investments/snapshot/?symbol=WLL Available: (May 17, 2001)
Willamette commitment to Nat resources http://www.wii.com/HISTENV.HTM Available: (May 17, 2001)
Author Information
Christopher Ohm Clement, Principal Investigator, South Carolina Institute of Anthropology and Archaeology, 1321 Pendleton Str. Columbia, SC 29208. Tel (803) 777-8170. E-mail: clement@sc.edu
Sahadeb De, Research Associate, Earth Sciences and Resources Institute, University of South Carolina, 402 Byrnes Bldg., Columbia, SC 29208. Tel. (803) 777-5911. E-mail: sde@Esri.Esri.sc.edu
Robin Wilson Kloot. Research Assistant Professor, Earth Sciences and Resources Institute, University of South Carolina, 402 Byrnes Bldg., Columbia, SC 29208. Tel. (803) 777-0217. E-mail: rwkloot@Esri.Esri.sc.edu