Geodata Visualization System for Defense/Intelligence Application
Dr. Gene Roe
Applied Analysis Inc., one of the leading remote sensing firms, is
implementing a web site for one of its military customers that will be
accessed through SIPRNET – a classified version of the Internet. The unique
capability of the site includes the ability to interact with very large
image files, covering an extensive geographic region of the world. The
insights and lessons learned in adapting ArcIMS to this environment and
mission will be presented.
1. INTRODUCTION
This paper describes a geodata visualization system based on Esri’s web
mapping solution. Geodata visualization refers to the means of visually
correlating georeferenced imagery and vector data in a map context. Satellite-image
exploitation software is used to derive ground cover classification products
from imagery and the results are served up in map form where they can be
visualized along with the base imagery and geographic features stored in
a GIS. ArcIMS software enables this visualization using standard web browser
technology, thereby imposing minimal hardware requirements and minimal
learning curve on the user’s part. This paper presents the design features
of the system and relates our experience using the technology.
At Applied Analysis Inc., we have a long history of developing
software tools to exploit remotely sensed geographic imagery. The current
version of our Subpixel Classifier spectral image processing tool allows
users to develop spectral signatures from multispectral and hyperspectral
imagery and apply them to locate materials of interest within a scene,
as well as scene-to-scene. The unique subpixel detection capability of
this software allows the user to detect materials that occupy as little
as 20% of a pixel and correctly distinguish spectrally similar targets,
such as a particular vegetative species, interspersed with other vegetation.
The software1 has been used in a wide number of applications, including
urban land cover studies2, wetland tree species identification3, crop identification4,
environmental monitoring5, wetlands identification6, and pest infestation
location7.
A U.S. Government customer contracted with Applied Analysis Inc. to
use our subpixel classification technology to create land use analysis
products from commercial satellite imagery. The customer’s area of interest
covers millions of square miles, and dozens of Landsat Thematic Mapper
image scenes were required to be processed. Additionally, the customer
was interested in how land usage changed over time which dictated that
archival satellite imagery be processed to develop a historical record.
The Subpixel Classifier image exploitation tool produces a classification
image from an input multispectral image. Each pixel within the classification
image is assigned a class value which is representative of the target material
pixel fraction. Signatures were developed for very specific land cover
features and employed operationally. The resulting classification images
are typically somewhat sparse since pixels within the image are set only
when the target material is present at that location on the ground. The
image analyst overlays these classification images on the original image
so that they can correlate material locations with geographic features
and locations. Both the original image and the classification image can
then be georectified and georeferenced to form a land use map of the area.
This information can be combined with other geographic information
and stored in a GIS. A given location would then have imagery and image-based
products from multiple dates coupled with other geographic features such
as political boundaries and characteristics, rivers, roads, etc. The resulting
GIS is a powerful tool for exploring the area of interest, visualizing
spatial and temporal patterns, and planning operations. Recognizing this
power, the customer wanted to be able to disseminate this information to
interested parties scattered throughout the world. Many of the end users
are not image analysts or GIS specialists. They have neither the tools
nor the expertise to analyze an image-based GIS, yet they have a need for
customized maps based on specific products of interest.
The solution to this need was to use Esri’s ArcIMS software to
serve up custom maps based on image exploitation products and a GIS data
base. The end user need only a standard web browser and network connectivity
to be able to download imagery and processed data products. The web interface
allows straightforward access without requiring special hardware and software,
or specialized technical knowledge. The end result is a Geodata Visualization
System (GVS).
From the user’s standpoint, GVS is a set of dynamic web pages
that allows them to focus in on an area of interest, select the products
(overlays) they are interested in, and create a printed output. They typically
begin with the GVS Products web page. This page lists available products
by country. Hyperlinks within this page take you to the GVS web page containing
products for that area. They can also jump to the GVS Global Entry page
and browse for product areas graphically. Links to pages containing more
information about GVS and the sponsoring project are also provided on the
Products web page.
The remainder of this paper describes the objective and requirements
for GVS and the resulting design features of the system. Some comments
on system performance are also provided.
2. GVS OBJECTIVES AND REQUIREMENTS
The primary goal of GVS is to provide ready access to image-based analysis
products for end users spread throughout the world. Due to the sensitive
nature of the work, the GVS is accessible only via the Department of Defense’s
secure internet called SIPRNET. Access is limited to authorized DOD personnel,
but otherwise the technology is identical to the regular internet. The
end-user is not typically an image analyst or GIS specialist and may only
have minimal computer skills. The end-user only needs a standard web browser
and secure network connectivity to be able to download imagery and processed
data products.
The GVS interface must allow straightforward access without requiring
special hardware and software or specialized technical knowledge. End users
are primarily interested in information in map form. This form aids their
visualization of geography and assists in operations which require the
user to visit locations of interest.
The basic requirements to use GVS are:
-
SIPRNET connection
-
Web browser, either
-
Netscape 4.0 or higher
-
Internet Explorer 4.01 or higher
GVS will not work with earlier versions of Netscape and Internet Explorer.
GVS is not guaranteed to work with other web browsers. A 24-bit (true color)
color graphic card and monitor is recommended. An 8-bit (256-color) graphic
card and monitor may be used. Free disk space is required to store temporary
copies of map images on your computer. Additional disk space will be required
if you wish to download and save imagery. The required disk space will
depend on the size and content of the downloaded imagery.
Many, if not all, organizations connected to SIPRNET do not allow
mobile code such as Java applets to move through their firewalls. GVS does
not use Java or the ArcIMS Java client viewer. Only dynamic HTML and JavaScript
are allowed in GVS.
3. GVS DESIGN FEATURES
3.1 General Features
GVS content is grouped into a number of area-of-interest sites geographically
scattered throughout the customer’s area of responsibility. Prepared image
exploitation products exist where satellite imagery has been acquired and
processed. This data forms the basis for an area of interest site. Users
can access these area sites from an introductory Products page or via a
global navigation map (see section 3.2).
Each area site uses its own ArcIMS map service and web site directory.
Consequently there are a number of site directories that would normally
contain duplicate HTML code, JavaScript code, and graphical images. To
aid in the maintenance of the overall web site, the code supplied with
ArcIMS was modified so that most of the HTML and all of the JavaScript
and graphical images could be placed in a common code directory. Each area
site contains an area-specific JavaScript file containing area specific
parameters, its own default.htm file, viewer.htm file and MapFrame.htm
file. Otherwise the code is stored in a common directory accessible by
each site. This makes it easy to update the code when changes are needed.
All area sites contain at least one base image and many sites
contain several images. The original image data set contained layers acquired
at multiple wavelengths. This spectral information is the key to deriving
additional information from the data using spectral signatures. Prior to
including these images on the GVS site, the images are converted to a true
color representation and stored as PNG files. Each image also has an associated
world file. The PNG image format was used since it support transparency.
Many imaging systems, such as ERDAS IMAGINE, use a multi-resolution
pyramid layer scheme to speed up image zooming. When the user requests
a low resolution, wide area version of the image, the system accesses the
pre-calculated low resolution version within the input file. As the user
zooms in, the system accesses successively higher resolution layers, thereby
optimizing access speed. It was hoped that we could take advantage of the
multi-resolution pyramid layer file that comes with ERDAS IMAGINE; however,
ArcIMS does not seem to utilize that feature. Future work will attempt
to improve image access speed by using LizardTech’s MrSID encoding software
which also employs a multi-resolution image encoding scheme.
New data are added to the system infrequently so it is acceptable to
store content in static flat files such as image files and shape files.
Classification results are stored in image format to save disk space. The
down side of this is that the user cannot query the material pixel fraction
for a given location. This was considered an advanced feature that may
be added in the future. As the number of area sites increases in the future,
it may be necessary to implement a data base access solution using ArcSDE.
This would reduce the number of map services and site directories required,
making the system more maintainable.
3.2. GVS Web Site Layout
The basic layout of the GVS web site is shown in Figure 1. Users typically
enter the site through the Products page. This is a regular HTML page containing
introduction text and tables where products are listed by categories and
location. Users can switch to a particular product map by selecting a product
link. In the future this might be a good place to use the Site Starters
feature introduced with ArcIMS version 3.1. Users can also select products
via a global navigation page which is a dynamic map showing locations where
products exist. Users can also access background information or view the
online help and user’s guide from the Products page.
Figure 1. Layout of the GVS Web Site
The GVS global navigation site is a wide-area map with highlighted areas
to indicate where products are located geographically. If the user selects
one of these highlighted areas, and they will be taken to the GVS
web page
for that area. From there they can navigate around, query features, and
produce a customized printed output.
The GVS global navigation page is divided into functional areas as shown
in Figure 2.
Figure 2. GVS Global Navigation Page
The center area is a dynamic map with highlighted areas representing
raw image data and processed data products. Selecting one of these features
will take you to an area specific page associated with the products. Raw
data areas are those areas where Landsat imagery coverage exists. The area
site will display true color representations of this imagery. Product areas
are areas where image data has been processed and converted into a series
of overlays which show material detections and object locations. Overlays
are also used to display data from a geographic information system (GIS)
database, such as road locations, waterways, and political boundaries.
Navigation tools, which are located along the left side, allow
the user to adjust the extent and appearance of the map. The regular ArcIMS
insert map can be toggled on and off. A unique feature of GVS maps is that
the user can toggle a latitude/longitude grid on and off. The typical pan
and zoom tools are also provided. In addition, the user can zoom by fixed
increments using the buttons along the left side of the map area.
Figure 3. Navigation Tools
Data tools are arranged along the top of the map area and allow the
user to create a printable map and get usage help. The user cannot print
the displayed map directly. They must create a printable map using Print
Map feature. This tool creates a new web page with the current view and
overlays. When the user selects Print Map, a secondary dialog appears as
shown:
Figure 4. Print Dialog
The user has the option of producing a Regular Print Page or selecting
Advanced Options. The Advanced Options feature allows the user to render
the printable page at higher resolutions and to save the rendered map image
to a file, as shown in Figure 5.
The user can change the current Map Mode from navigation to selection
by selecting one of the Product Selection Tabs located at the top of the
map area.


Two categories of products are available:
-
Raw Data areas are areas where unprocessed imagery and other data products
exist for viewing. Selecting one of these areas will take the user to a
new web page displaying the image data where they can navigate around and
focus in on specific locations.
-
Product areas are areas where processed data products have been produced
from raw imagery. Selecting one of these areas will take the user to a
new web page which displays the raw imagery along with overlays containing
processed results. For example, a detection image might be overlaid on
the unprocessed imagery along with feature overlays which show road, waterways,
and other features.
Depending on which product selection tab is selected, the map area changes
to show the user only products of that type.
Area of Interest sites are where the user goes to find imagery and
processed data products. Within one of these sites you can focus in on
specific geographic locations or areas, select the products (overlays)
you are interested in, and create a printed output. Figure 6 shows a sample
GVS area of interest page and its functional areas. Many of these are intentionally
the same as that of the global navigation page so that the user is presented
with a consistent interface.
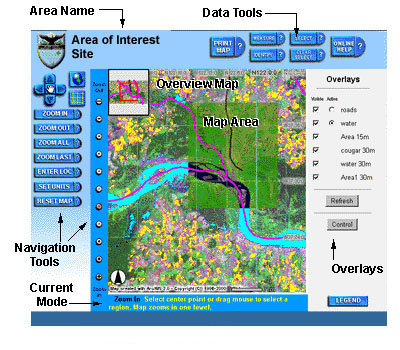
Figure 6. Sample Area of Interest Site Layout
Navigation tools are expanded slightly, as shown in Figure 7, to give
the user more control over the map settings. The Slider button is an optional
tool and does not appear on all Area of Interest sites. If it is present
in the Navigation toolbar area, the uppermost overlays can be slid back
to reveal the bottom overlay by pressing and dragging the left mouse button
within the Map Area. By rapidly dragging the mouse, the user can visually
correlate features in the upper overlays to those in the bottom overlay.
This is useful for visual change detection within two overlaid images or
for associating features in an image with features in an underlying map.
Note that the slider visibility window does not appear on the printable
map page. This feature is only available for interactive use.
Figure 7. Area of Interest Navigation Tools
The Data Tools section is expanded to allow the user to inquire about
features. Every tool button has a help portion indicated by a question
mark. If the user selects that portion of the button, a small help window
appears with specific instructions for that button.

Figure 8. Area of Interest Data Tools
The Measure tool allows the user to measure distances on the map and
display segments. The Select tool allows the user to select features by
dragging the mouse within the map area to define a rectangle. Any feature
within the Active Overlay will be selected and information about those
features will be displayed in a separate pop-up window. The Identify tool
is similar in that it allows the user to select a single feature within
the Active Overlay.
Overlays are layers of image data stacked on top of each other.
Overlays are generally semi-transparent. In those areas where there is
no content you can see down to the underlying overlays. Areas with content
block the underlying overlays from showing through. The user can control
overlay visibility and the order of the overlays in the stack.
A unique feature of GVS is the ability to include and exclude
overlays from the overlay list located along the right side of the map
area. The Overlay Control button brings up a separate window containing
information about the overlays. The user can change the order of the overlays
and include or exclude overlays from the current set. They can also view
additional detailed information about each overlay.
Figure 9. Overlay Control Dialog
3.3. System Hardware/Software
The basic elements of GVS are the server hardware, SIPRNET connectivity,
server software, ArcIMS application software, and individual GVS web directories
with associated image data products. GVS is designed to operate independently
of other servers at the customer site, although its web content will appear
to be seamlessly integrated with other web content on other servers. This
design provides maximum flexibility and scalability.
The design philosophy was to place minimal requirements on the GVS client
(user hardware) by performing most of the image manipulations on the server
side. This approach requires a dedicated and capable server to meet the
demand. The GVS system is also designed to be inherently scalable. The
GVS system hardware consists of a Compaq Proliant DL380 Server with dual
866-MHz Pentium III processors, 1 GB RAM, an onboard RAID controller, and
dual (redundant) power supplies. RAID level 5 is used in the disk array
to ensure speed and data integrity, as well as flexibility to provide future
expansion. The hardware is rack-mounted.
The GVS server runs the Microsoft Windows NT Server, Version 4.0, operating
system with Service Pack 5 installed. The HTTP server software is Netscape
iPlanet Web Server, Enterprise Edition, Version 4.0. The iPlanet web server
software is a multi-process, multi-threaded secure web server providing
high performance, reliability, scalability, and manageability. The server
supports remote administration, access control, Secure Sockets Layer (SSL)
[not currently used], server-side Java servlets and JavaScript, and flexible
logging and performance monitoring. Java servlet support is native to iPlanet
and a separate servlet engine installation was not required.
GVS’s special map-based image content is assembled and supplied to the
iPlanet web server using Esri’s ArcIMS software. ArcIMS is a suite of software
modules that involve the client, the server, and data management. On the
client side, Dynamic HTML and JavaScript are used. Client-side Java applets
are not required. On the server side, ArcIMS provides an Application Server
module and special Java servlets. A specific configuration of these servlets
forms a Map Service. In the GVS system, the communication between the Web
Server and ArcIMS Application Server takes the form of Servlet Connectors
which are ArcIMS XML exchanges. This architecture was laid out in Figure
10. ArcIMS uses the native servlet engine in iPlanet and adds spatial servers
and the application server.
Figure 10. Schematic of ArcIMS Distributed Processing System
4. IMPLEMENTATION RESULTS
The GVS has been up and running continuously since September 2000. Due
to the specialized nature of the site and the limited access afforded by
SIPRNET, hit rates and loads have been relatively low to date. The single
server has been adequate to handle the load.
A typical Landsat image contains approximately 6000x5000 pixels. When
converted to true color representation and compressed in a PNG file such
an image only occupies about 20-30 MB of disk space. Such images normally
display within about 8 seconds, not counting download time. The typical
downloaded image is about 100-150 KB, depending on the client’s screen
resolution and the image content. This download occurs each time the user
adjusts the map extents or modifies a layer. For users connecting via a
modem, this time represents the major delay experienced. For users connecting
via a high-speed connection, the major delay is the time required for the
ArcIMS image server to load the image and create an output map.
The largest area site fielded to date consisted of 5 overlapping Landsat
scenes mosaiced together to form a single image approximately 14000x9000
pixels. The pixel size was interpolated to twice the normal size to reduce
the number of pixels. The resulting compressed file size was approximately
50 MB. This site can take up to 30 seconds to display, not counting download
time. This time delay is considered unacceptable for most users.
Long display time is currently the major system issue with GVS.
The time required for the ArcIMS imageserver to load image data from file
and produce an output map image is marginally acceptable in most cases
and unacceptable for very large images. It is anticipated that version
3.1 of ArcIMS will have improvements in imageserver speed.
We have also done some work with LizardTech’s MrSID software which
employs a multiresolution image storage format in the hopes that it would
speed map display. So far, given limited testing and tuning, results are
mixed. Initial map display is somewhat slower, but map refreshes are somewhat
faster.
Following initial deployment of the system it became clear that
one maintenance issue would be version control of the customized ArcIMS
client software (HTML and JavaScript) for multiple site directories. This
issue was alleviated somewhat by modifying the code to use a common code
directory. Each area site refers to a single code directory for basic HTML
and JavaScript along with the GIF files that are used in the interface
look and feel. This has greatly simplified version control and system updates.
5. CONCLUSIONS
Despite some issues with display speed, the deployment of GVS on SIPRNET
has been well received and is a useful tool for the customer and their
clients. The ability to associate image data with derived products and
other geographic information is a wonderful advance. A wider audience of
users is now able to access data that previously only highly trained image
analysts and GIS specialists could access. This is opening up new operational
uses for the technology and allowing users to do things they could not
have envisioned just a few years ago. While ArcIMS has been grounded in
vector data base applications, this effort has shown that it can be an
effective image server as well. The ability to synthesize raster and vector
information products into a map format is proving to be a useful tool for
both analysts, operations personnel, and decision makers.
References
1) "Nonparametric Classification of Subpixel Materials in Multispectral
Imagery," E. Boudreau, R. Huguenin, M. Karaska; SPIE Vol. 2758, 1996.
2) "Regional Ecosystem Analysis: Puget Sound Metropolitan Area," American
Forests, 7/25/98.
Available at http://www.discover-aai.com/whitepapers.htm.
"Regional Ecosystem Analysis: Chesapeake Bay Region and Baltimore-Washington
Corridor,"
American Forests, 3/10/99. Available at http://www.discover-aai.com/whitepapers.htm
3) R. Huguenin, M. Karaska, D. Van Blaricom, and J. Jensen; Photogrammetric
Engineering & Remote Sensing Vol. 63, pp. 717-725, June 1997.
4) http://www.discover-aai.com/cropdetect.htm
5) http://www.discover-aai.com/fuel.htm
6) http://www.discover-aai.com/waterway.htm
and http://www.discover-aai.com/wetland.htm
7) http://www.discover-aai.com/pest.htm
and "An Evaluation of the Utility of Subpixel Analysis of Thematic Mapper
Imagery for the Spruce Beetle Outbreak on the Manti-LaSal National Forest,"
J. Johnson, P. Greenfield, and A. Steve Munson, published June 23, 1998.
Dr. Gene Roe Director Of Business Development
Applied Analysis Inc.
630 Boston Road Billerica, MA 01821
Phone: (978)663-6828
Fax: (978)663-6389
groe@discover-aai.com