Power Outages & Critical Facilities – Chicago’s GIS Solution
Scot R Hamilton
ABSTRACT
Power outages are at best an inconvenience and at worst a serious public safety concern. Critical facilities such as hospitals, schools, high-rise buildings, and senior centers pose various risks if deprived of electricity for extended periods. The City of Chicago is using GIS to identify critical facilities potentially affected by power outages and track where those outages occur. This paper will discuss the Avenue extensions developed by the GIS Division of the City’s Business & Information Services Department to help novice GIS users maintain and query the City’s critical facility database.
INTRODUCTION
When the power goes out, for most people the main aggravation is having to reset their clocks. However, for a large municipality like the City of Chicago, power outages can mean people trapped in elevators, intersection lights that don't work, no air conditioning for elderly residents on a hot day, and numerous other problems that require emergency response personnel. Now with the possibility of rolling blackouts affecting a significant portion of the City's population, coordinating emergency responses can be a daunting task. The City of Chicago is using its Geographic Information System (GIS) to help Police and Fire Department personnel identify critical facilities that may require assistance during a localized power outage or a structured rolling blackout. This paper will discuss how ArcView GIS is being used by the City to 1) identify critical facilities that may be affected by an outage or rolling blackout, 2) track outages as they occur, and 3) maintain the critical facility database.
BACKGROUND
Prompted by the heat wave of 1995, which caused numerous deaths and the Loop (Chicago downtown) blackout in 1999, which shutdown the City and cost millions of dollars, Chicago felt it needed to develop emergency response procedures that dealt with power outages caused by an overtaxed electrical system. One of the key necessities was the ability for emergency response personnel to be able to quickly identify locations where an outage could have a potentially high risk to public safety. These locations were called critical facilities and examples include hospitals, schools, high-rise buildings, senior centers, people on home life support systems, and traffic light controlled intersections. The obvious answer was to use GIS as a means to identify the facilities. The problem was making it simple enough for novice users.
The GIS Division of City’s Business and Information Systems Department (BIS/GIS) was tasked with developing an application designed for non-GIS users that would locate critical facilities potentially affected by either a random outage or a planned rolling blackout. It was decided that an ArcView extension would be developed and distributed throughout the City. A Web based application was considered, but because network and Internet connections could be affected by an outage, the idea was dismissed. Each emergency facility (i.e. Police Station) has it's own backup power supply, so having a local ArcView installation was consider the best approach. The application is called the Critical Facility Locator (CFL).
DATA
The map layers included in the application are the City Boundary, Critical Facilities, Commonwealth Edison (ComEd) Electrical Feeders, Streets, Police Districts and Beats, and Fire Chief and Battalion Districts. BIS/GIS maintains the Boundary, Streets, and Police and Fire geographies. The Feeders and Critical Facilities are the responsibility of the Department of Environment (DOE).
The Critical Facility database was developed using several data sources including the Chicago Fire Department, Police Department, Department of the Environment, Department of Buildings, and the State of Illinois. The addresses of the critical facilities were used to geocode the data and create a point shapefile. The Critical Facility data is continually being verified by all the departments involved and updated by the DOE. There are over 13,000 critical facilities identified in the City of Chicago.
The ComEd feeders are overlapping polygons that represent areas that receive electricity from particular power sub-stations. Some of the feeders belong to ComEd’s rolling blackout plan. In the event that ComEd cannot provide enough electricity to all of it’s customers they will turn off a number of feeders for a two hour period to conserve energy. The feeders that will be turned off are determined by 21 rolling blackout plans. ComEd may implement one or more plans at the same time. Each feeder has a unique id and the plan number with which it belongs. This data was created through a joint effort by ComEd, DOE, and BIS/GIS.
CRITICAL FACILITY LOCATOR
The CFL application was developed using Avenue and the Dialog Designer. The primary requirement was that it be simple for the novice user to navigate. The specific functionality requested included:
-
Locate a random outage by the intersection of four bounding streets. ComEd may report the outage to the City by a north, south, east, and west bounding street. Report the critical facilities inside the outage area along with Police and Fire geographies overlapped.
-
Allow the user to draw an outage area on the map instead of entering street names. Report the critical facilities inside the outage area along with Police and Fire geographies overlapped.
-
Locate a feeder by id and report the critical facilities inside the feeder along with Police and Fire geographies overlapped. ComEd may report that a specific feeder is down by its id.
-
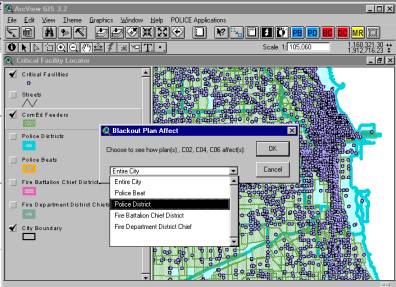
Identify the feeders that are part of a particular rolling blackout plan and report the critical facilities inside the feeder boundaries along with Police and Fire geographies overlapped. Be able to ask how a blackout plan will affect a particular Police or Fire geography. For instance, how does plan 6 affect Police District 11 or Beat 1711.
-
Locate the critical facilities within a particular Police or Fire geography.
-
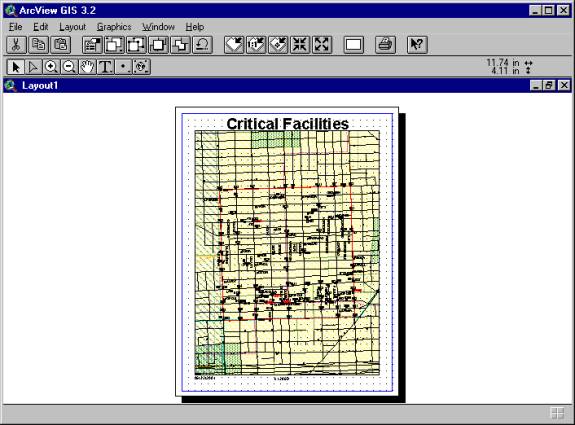
Create a simple map and report of the critical facilities currently selected. The map and report should be able to be used together as a handout for emergency personnel.
These functions were built into an ArcView Extension that also loads the required shapefiles automatically and strips off unnecessary out of the box ArcView functionality. This was done to simplify the graphical user interface (GUI) and reduce the likelihood that a novice user would edit or delete data in a shapefile. The initial GUI interface is shown below.
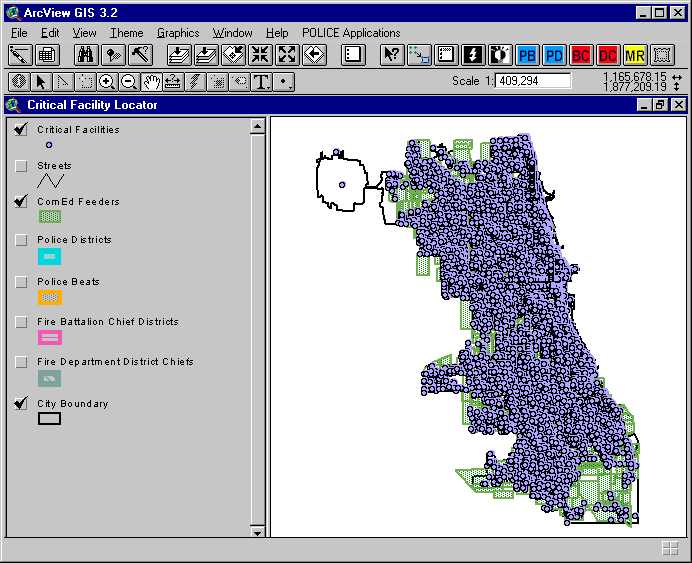
Ten CFL buttons were added to the right side of the button bar. The buttons going from left to right are Locate Outage, Show Selected Features, Locate Feeder by Id, Locate Rolling Blackout Plan, Locate Police Beat, Locate Police District, Locate Fire Battalion Chief District, Locate Fire Department District Chiefs, Map & Report Critical Facilities, and the Data Disclaimer.
![]()
The first button Locate Outage is used for locating a random outage. Clicking the button, opens the following form.
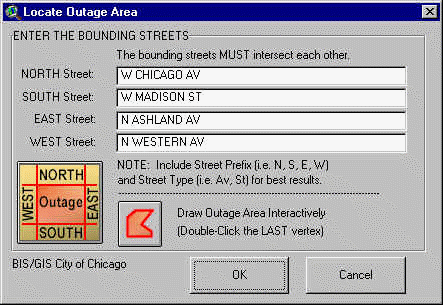
The user can either enter four bounding streets or draw the outage area on the map. The figure below shows the results of entering four bounding streets. The application will attempt to handle incorrect or incomplete street names by allowing the user choose the best candidate from a drop-down list.
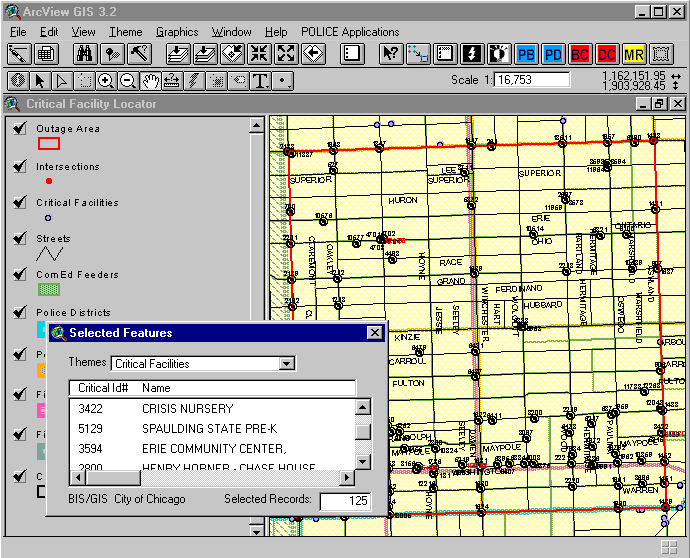
The outage area is located by the intersections of the four streets and shown in red. Critical facilities inside the outage area are highlighted by a black dot and auto-labeled with their unique id. The streets inside the area are also auto-labeled. The Selected Features pop-up box reports that there are 125 facilities that maybe affected by the outage. The Theme drop-down box on the Select Features pop-up can also be used to see which Police and Fire geographies are overlapped by the outage area.
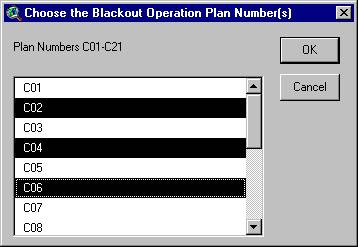
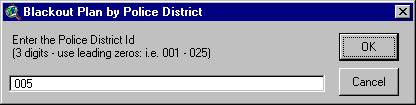
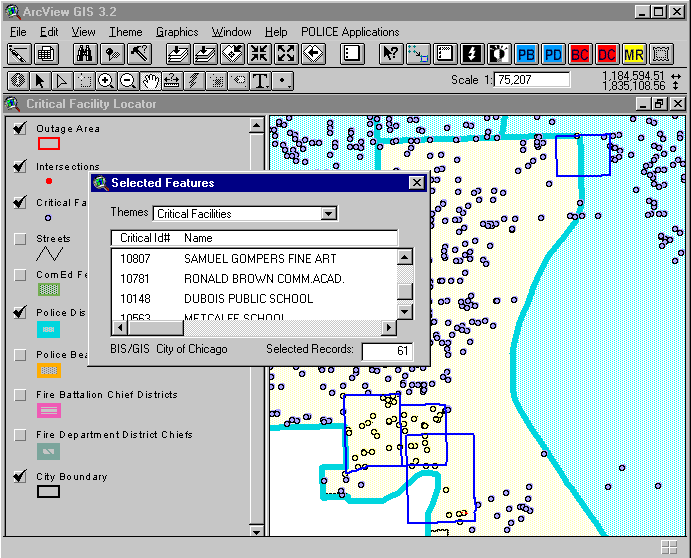
For rolling blackouts a list box allows the user to select one or more plans and choose to see how they affect the entire City or a specific Police or Fire geography. For this example, the user select plans 2, 4, and 6. Then they choose to see how the plans affect Police District 005.
The results show 61 critical facilities may be affected by the rolling blackout in Police District 005. The feeders that are part of rolling blackout plans 2, 4, and 6 are outlined in blue and critical facilities inside are highlighted in yellow.
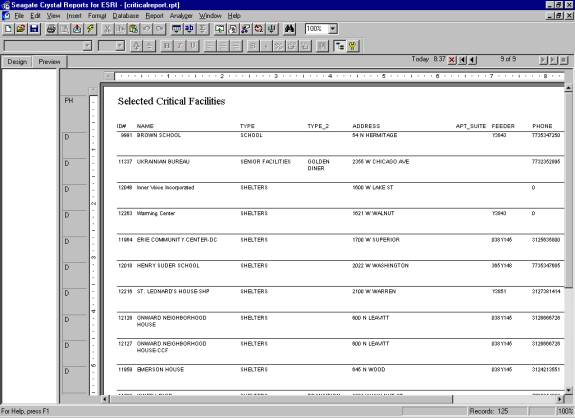
The Map & Report tool creates a simple map layout for the user at the click of a button and it sends the data associated with critical facilities inside the outage area to the application, Crystal Reports. Crystal Reports uses a template to present the information in an 8.5 x 11 format that can be printed. The ids on the map and the report correspond, so that field personnel can quickly orient themselves and review the critical facilities within an outage area.
CRITICAL FACILITY LOCATOR – with OUTAGE TRACKER
The Department of Environment tracks outages as the occur around the City and requested an additional functionality that would allow them to preserve the outage area polygons and store information about the outages in a shapefile. An additional button was added to the GUI called Record Outage. The pop-up form for recording outages is shown below.
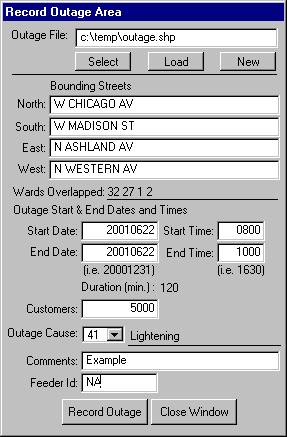
This form allows the user to add outages (polygons) to an existing shapefile or create a new shapefile that contains the standard field names and types. This was needed because DOE creates a new outage shapefile for each month. The information stored in the outage shapefile includes, the bounding streets, the aldermanic wards overlapped (determined automatically), the outage start and stop times (duration is calculated automatically), the number of customers affected, the outage cause, any comments, and the ComEd feeder involved if known.
DOE uses this information to track ComEd's performance and note areas that continually have outages problems.
CRITICAL FACILITY MAINTENANCE
The Department of Environment also requested the ability to maintain and update the critical facility database through a GUI form. A separate extension was developed and the form is shown below.
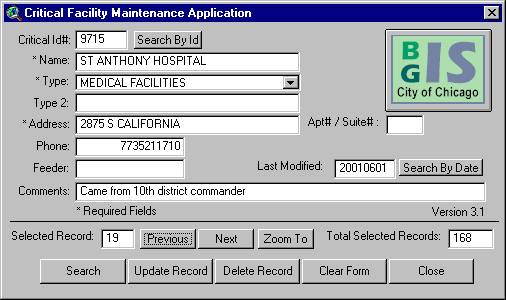
This form allows a user to search for a record based on any of the fields shown. In the case above, all the MEDICAL FACILITIES were found. The form shows that there are 168 facilities and the Previous, Next, and Zoom To buttons allow the user to cycle through the selected records and locate them in the map view. If changes are required, the user can overtype the information and click the Update Record button. Ids and edit dates are maintained by the application so the user cannot edit these fields. There is also the ability to delete an existing record or add a new critical facility.
TRAINING & DISTRIBUTION
The Critical Facility Locator extension has been distributed to the City’s 25 Police Districts, the Fire Department, and 911 Center. BIS/GIS has trained over a hundred police officers and emergency personnel to use the application. The goal is to have at least one person in every police district on every watch, trained to use the CFL. The training sessions are an hour and a half. The students are given a basic introduction to ArcView and specific training on the CFL functionality. The training also provides a good opportunity for feedback and modifications are incorporated into the CFL.
CONCLUSION
The Critical Facility Locater is a key component to Chicago’s emergency response preparedness. Non-GIS personnel can quickly locate critical facilities that maybe affected by a random power outage or a rolling blackout. A map and report can be generated and given to field staff responsible for public safety. Chicago is taking advantage of GIS, by making it easy for novice users to comprehend and giving them needed information quickly and efficiently.
ACKNOWLEDGMENTS
I'd like to thank Joe Kezon (City of Chicago) for his ideas and contributions to the application designs and his review of this paper.
AUTHOR
Scot R Hamilton
GIS Programmer Analyst
City of Chicago
50 W Washington St
Daley Center, Room 2700
Chicago, IL 60602
312.744.6390
312.744.9004 FAX
shamilton@cityofchicago.org