Janace Pierce, MS, Barbara Stepanski, MPH, Leslie Upledger Ray, MA, MPPA, Dale Cooper, Patricia Murrin, RN, MPH, Clint Garrison, Stephen J Bender, HSD, MPH, Debra A Loomis, MA
An ArcView-based GIS of injury and fatal traffic crashes is being used to help identify traffic safety problems in different regions of the County of San Diego. Four years of traffic crash data are now available to permit a more in-depth analysis of targeted problems in the Safe Communities Coalition areas. Results of data analysis for one of the Coalition areas will be presented.
Safe Communities is a program funded by the Office of Traffic Safety (OTS) through the Business, Transportation and Housing Agency of California, and the National Highway Traffic Safety Administration (NHTSA). The Safe Communities Program utilizes a community-based, coalition-led model driven by data analysis for prevention of injuries and deaths from motor vehicle crashes.
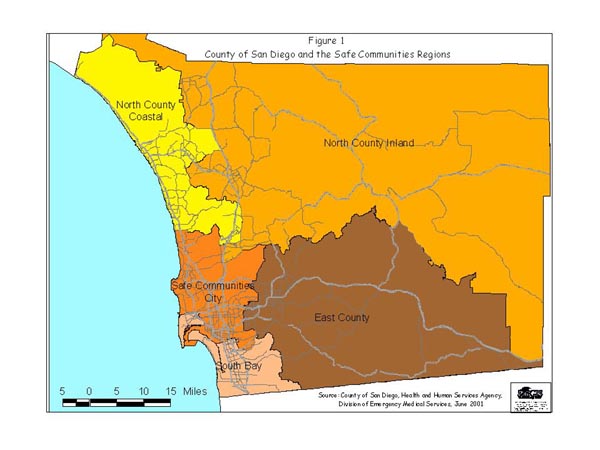
For the Safe Communities programs, the County of San Diego has been divided into 5 geographic regions based on subregional areas defined by the San Diego Association of Governments (SANDAG). Four of these regions, North County Coastal, North County Inland, South Bay, and East County Regions, are administered through the San Diego State University Foundation. The project is entitled "Safe Communities - San Diego County." The fifth region, City of San Diego Region, is administered through the San Diego Police Department-Traffic Division. This project is called "San Diego Safe Communities-2000." The boundaries of this region do not follow the boundaries of the City. Figure 1 shows the boundaries of the regions along with some roads to show the locations of population centers.
The "Safe Communities - San Diego County" project maintains four regional coalitions and one County-wide Executive Committee. Coalition membership is voluntary, and participants include representatives from the medical community, law enforcement agents, education leaders, employers, members from the healthcare field, first responders, injury prevention specialists, community members, and others. The Safe Communities coalitions assist in the identification of regional traffic injury issues, participate in community outreach efforts, provide support to other coalition members and implement traffic safety measures in their regions.
Injury and fatality statistics are used to help determine the traffic safety challenges in each of the Safe Communities Regions. The main source for these data is the Statewide Integrated Traffic Records System, usually referred to as SWITRS. SWITRS data for San Diego County are maintained by the County of San Diego, Health and Human Services Agency, Division of Emergency Medical Services (EMS). EMS provides data support for both of the Safe Communities projects.
SWITRS data are collected by the CA Highway Patrol, City Police, and Sheriffs, depending on the type of roadway jurisdiction. Included in this extensive data set are variables describing the crash, the various parties in the crash (drivers, pedestrians, etc), and each of the victims injured or killed in the crash. The crash location is defined by a municipality designation and the intersection of two streets/roads with a directional offset. For crashes that occur on state highways, a postmile location and direction of travel are also reported.
A program, written in Avenue, is used to automatically locate each of the crashes in the data set. The program also provides a special interface to manually locate crashes that the automated system could not locate. When all of the crashes in a given data set have been located, zipcode and SRA (codes for subregional areas) are assigned, based on shape-files provided by SanGIS. These data fields are exported and later merged with the data analysis files that are maintained in SPSS (Statistical Package for the Social Sciences) format. This allows us to produce statistics about drivers and victims as well as about crashes according to any geographic region as long as the geographic region can be represented as an aggregate of either zipcode areas or subregional areas. The mapping version of the crash file, augmented by variables calculated in the analysis databases, is used to create dot maps of crashes that, for example, show crashes in which children were injured or killed.
For this paper, one region from the Safe Communities-San Diego County project was selected for a more detailed analysis.
Four years of data were assembled from the SWITRS databases for fiscal years 1995/96, 1996/97, 1997/98, and 1998/99. Based on previous finding of investigators, a decision was made to focus on child pedalcyclists, aged 5 to 14, who were injured or killed in pedalcycle crashes. Data for the four years were merged, creating a single data set of all pedalcycle victims ages 5 to 14 who were injured or killed in pedalcycle crashes.
For each region, incidence of injury and annualized incidence rates of injury per 10,000 population were calculated. Data were analyzed by location, injury severity, party at fault, violation category, time of week, month of year, and age group.
A map was created to show the location of the pedalcycle crashes in the region under study, distinguishing between the two age groups, 5 to 9 and 10 to 14. To create this map data fields were created within SPSS that incorporated information about the age of victims in the collisions. These data fields were exported to a .dbf file which was subsequently joined to the appropriate crash data using ArcView 3.2a.
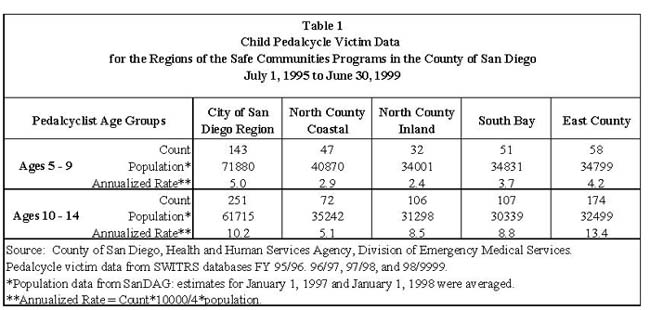
During the four years under study, there were a total of 1043 pedalcycle victims age 5 to 14 in the County of San Diego. The City of San Diego Region had the highest incidence (N = 143) and highest rate (5.0 per 10,000) of pedalcycle victims age 5 to 9. City of San Diego region also had the highest incidence of pedalcycle victims age 10 to 14 (N = 251), but only the second highest injury rate (10.2 per 10,000). The highest rate of injury (13.4 per 10,000) for victims 10 to 14 was in the East County Region.
Among the regions of the Safe Communities-County of San Diego project, the highest incidence and rate for each of the age groups were reported for the East County Region: For ages 5 to 9: N = 58, Rate = 4.2 per 10,000. For ages 10 to 14: N = 174, Rate = 13.4 per 10,000. (See Table 1)
The region selected for a more in-depth analysis was the East County Region. This analysis determined the baseline information for a recently funded injury prevention project focused on child pedalcyclists. Continuous analyses will be used for the evaluation of this project's intervention.
Following are the East County Region results:
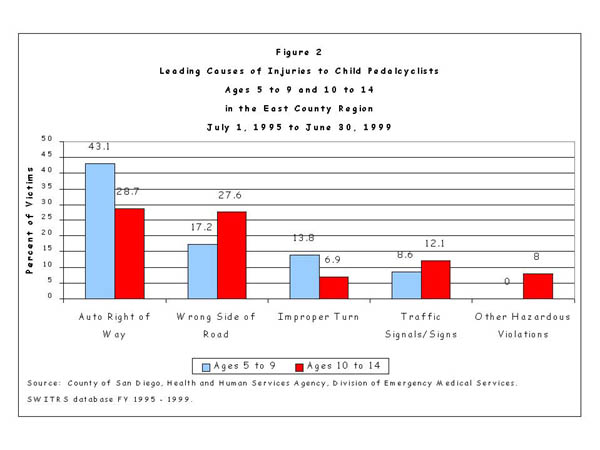
Leading Causes of Pedalcycle Injuries: The leading causes of injuries to child pedalcyclists in the East County Region are displayed in Figure 2, comparing the two age groups under study. Auto Right of Way is the leading cause for both age groups. Wrong Side of Road ranks second for both groups, and, for victims age 10 to 14, is nearly as important a cause as Auto Right of Way. Other important causes are Improper Turns, Traffic Signals and Signs, and Other Hazardous Violations.
Party at Fault: In most crashes the child pedalcyclist was deemed to be the party at fault. Among child pedalcyclists aged 5 to 9, 81% were at fault and among those aged 10 to 14, 77% were at fault.
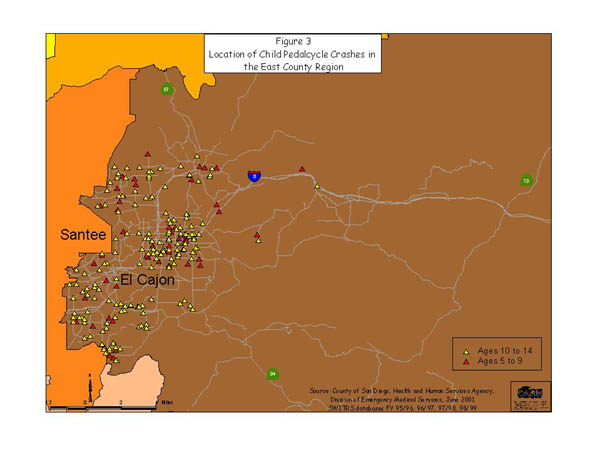
Location of Crashes: Figure 3 shows the location of the crashes in which a child pedalcyclist was injured. Nearly all of these crashes occurred in the populated areas of the region, as indicated by the number of roads in the vicinity. However, 35% occurred outside of incorporated areas. Thirty percent of the crashes occurred at intersections. Only one crash occurred in the region outside the area included in Figure 3.
Injury Severity: One child was killed (age 10 to 14) and 18 children were severely injured (7, age 5 to 9; 11, age 10 to 14). The remaining victims had Other Visible Injury (41, age 5 to 9; 121, age 10 to 14) or Complaint of Pain (10, age 5 to 9; 41, age 10 to 14).
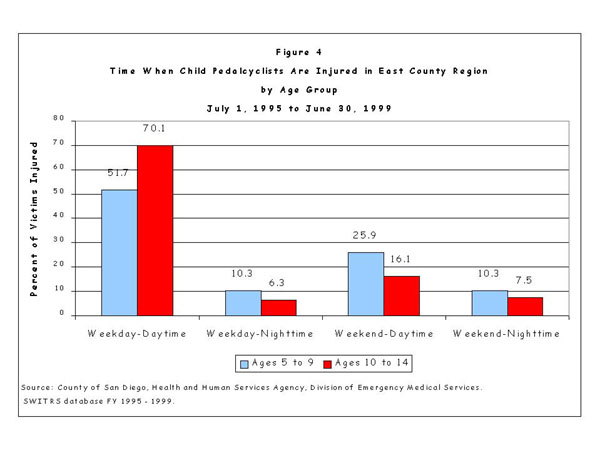
Time of Day: For children age 5 to 9, 52% of the crashes occurred on weekdays between 6 a.m. and 6 p.m.; for children age 10 to 14, 70% occurred on weekdays during the daytime hours. The younger children are more likely to be injured in crashes in the evening. (See Figure 4)
Time of Year: Peak months for pedalcycle crashes involving 5 to 9 year olds are July (14.0%), March (12.3%), May (10.5%), August (10.5%), and September (10.5%). All of the September crashes, 10.5% of the total, were during the weekday-daytime time period. Peak months for 10 to 14 year old pedalcyclist crashes are October, May, and June, over all daytime periods.
Of great concern is the high percent of child pedalcyclists found to be at fault - 81% of crashes involving children ages 5 to 9 and 77% of crashes involving children ages 10 to 14. These children most often violate the auto-right-of-way and wrong-side-of-road rules. Majority of the crashes occurred in populated areas, where there are a higher number of roads. While 75% of the victims were 10-14 years old, 12% of the 5-9 year olds were killed/severely injured verses 7% of the 10-14 year olds. Most incidents took place during the weekday daytime hours and during the summer months.
These results assisted the Safe Communities Coalition in the East County Region to develop a public health intervention tailored to the needs of their region. For example, teaching child pedalcyclist the "rules of the road" (i.e. riding on the right side of paths and trials, and riding in the same direction of the cars) and correctly wearing bicycle safety gear. Over the next few years, continuous data collection and analyses will evaluate the success of this intervention in reducing the number of pedalcycle crashes in this region.
The authors would like to thank Patti Akers for converting the Word and Excel files to html format. We would also like to thank the Safe Communities projects for supporting the development and maintenance of the SWITRS GIS system. The data collection efforts of the police and sheriffs throughout the County are gratefully acknowledged, as is the cooperation of State staff for providing the SWITRS data for our county.
Janace Pierce, Biostatistician, email jpierxhe@co.san-diego.ca.us
County of San Diego, Health and Human Services Agency, Division of Emergency Medical Services, 6255 Mission Gorge Rd, San Diego, CA 92120, phone: 619.285.6429, fax: 619.285.6531