This research identifies indicators that signal ecological change in intensely and lightly used lands at Fort Benning, GA. Changes in fragmentation through time affect the biological integrity of terrestrial systems. Landscape patterns, therefore, are important indicators of the intensity of military use being enough to jeopardize ecological resources or areas at risk on military installations. The steps involved in landscape characterization include creation of a land-cover database, computation of landscape metrics, and evaluation of changes in those metrics over time. Identification of ecological indicators is an important component of building an effective environmental monitoring system.
A major component of the Department of Defense�s mission is to provide adequate lands for military training and operations. Military lands are subject to the same environmental responsibilities and regulations as other federal lands, and they contain a high density of federally and state listed species (Leslie et al. 1996). Given the nature of military land use, management or military testing and training may degrade or fragment critical habitats and put species at risk. Furthermore, vegetation plays a crucial role in military training by providing concealment and an element of realism in training exercises. Land degradation and habitat fragmentation resulting from military land use may ultimately compromise the ability of a base to fulfill its mission. For these reasons, the Department of Defense has taken a proactive land management approach.
The examination and quantification of landscape pattern through time may indicate long- term impacts of military land use. Environmental monitoring and management plans are being developed to assist bases such as Fort Benning in balancing their training requirements and environmental responsibilities in both the short and long term. Identification of ecological indicators is an important component of building an effective environmental monitoring system. Indicators must represent the entire ecological system, serve as signals of environmental change, and be simple enough to be cost-effectively monitored and modeled (Dale and Beyeler, 2000).
The goal of this research is to identify and map land cover trends that have occurred over recent human history at Fort Benning and to develop techniques to measure these changes on the landscape. This is a multi-step process beginning with the creation of land cover maps for different time periods and culminating with the computation, summarization, and evaluation of landscape metrics. Landscape metrics are quantifiable measures of landscape fragmentation and were developed to �capture important aspects of landscape pattern in a few numbers� (O�Neill et al. 1988). These numbers can then be correlated with land use and ecological processes. Specifically, we examine trends in landscape metrics that relate to changes in ecological conditions over time such as vegetation type and pattern. This analysis identifies which metrics are useful indicators of change at Fort Benning. An indicator should not only adequately characterize the system, but must also be a cost-effective implementation for management. Fort Benning is the focus of this project, but the goal is to develop an approach for identifying indicators that would be useful to a diversity of military installations. This project is a �work in progress�, and the results published here include a description of the methods and tools used to create the land cover time series and to compute landscape metrics. Only a preliminary discussion of the metrics is provided.
Fort Benning is located southwest of Columbus in west central Georgia with an extension in Russell County, Alabama (Fig. 1). The base is approximately 6870 hectares in size. Prior to construction of the base, both Native Americans and European settlers farmed the area (Kane and Keeton 1998). Native Americans occupied the region for thousands of years before European settlement and had significant impacts upon the landscape. European immigrants settled the area beginning in the early 1800s, and farming was the predominant land use. The US government began acquiring land in 1918 for the infantry school of arms, and the permanent military post was established by Congress in 1920 (Kane and Keeton 1998). Fort Benning is currently used extensively for US military infantry and tank training exercises.
Historical land survey maps and field notes from the early 1800s were used to create a digital GIS model of the forests covering the Fort Benning area. Although Native Americans had been living in the area for thousands of years, the 1827 model is a reasonable representation of the forests in a pre-western agricultural environment. As such, the map provides baseline conditions for the area currently occupied by the base.
During the 1800s, the US government surveyed the country for the purpose of subdividing and selling land. The surveys divided federal land into square townships that measured six miles on a side. Townships were further subdivided into square sections of one square mile. Surveyors marked the corners of each section and defined section boundaries by recording witness or bearing trees that were in close proximity to the boundary markers. The federal government conducted land surveys in the Alabama portion of Ft. Benning in the 1830s (Foster 2001 and Foster and Abrams in review). The states that formed from the original thirteen colonies, however, elected to distribute land at a state level. The state�s process of distribution was similar to the federal system. Fort Benning is mostly bounded by land that was surveyed in the early 1800s by the state of Georgia. When the land that eventually became Fort Benning was surveyed in 1827, it was divided into roughly equal lots within districts. Districts were roughly nine miles square, and lots were to be 202.5 acres square. Lots varied in size but were, on average, one half mile on one side. The lots were then issued at a lottery. As a part of the land distribution, the Surveyor General surveyed the land, noting the location of trees at each corner that marked the boundary of each lot. The surveyor indicated the species of the corner tree and four witness trees. Unlike other surveys, the surveyor did not routinely include information regarding bearing or distance from corner, diameter at breast height (dbh), other indications of tree age or size, or notes describing landscape or understory vegetation. When the General Land Office surveyed the small section of Ft. Benning that lies in Alabama, corner and witness trees were recorded. Great variability occurs within these surveys. This variability is largely a result of the personal biases and methods employed by different surveyors. For example, some surveyors recorded only common names (which varied greatly), and some only reported to the genus level. Others held biases in the species and diameters/sizes of trees selected as witness trees. It is often assumed that surveyors may have been biased towards �longer living or larger trees when choosing a witness tree for a marker� (Foster and Abrams � In Review). Valuable timber species may also be over-represented in some surveys for the purpose of elevating land values. In spite of these problems, it is largely agreed that �witness tree data is the largest, most systematic, and most accurate form of data available for the pre-European settlement forests� (Bourdo 1956, Whitney 1994).
Historic land survey data are available in two forms, surveyor�s notes and maps. Surveyor�s notes are commonly available on microfilm, and maps are in photocopy form. The documents for Georgia were obtained from the Department of Archives and History in Atlanta, Georgia. Documents for Alabama were obtained from the Department of Archives and History in Montgomery, Alabama and from the Bureau of Land Management in Springfield, Virginia.
The data extraction process involved georeferencing the historical land survey maps, digitizing the location of the trees from the maps, and extracting the attribute species from the maps and survey notes. The historic maps for Georgia were georeferenced to modern USGS maps using the Fort Benning Final Project and Acquisition map Em 405- 1-2-00 (US Army Corps of Engineers, 1948) because it contained the land survey boundaries from the historic maps. Modern aerial photos were occasionally used. The maps were digitized with a GTCO Accutab 24�x 36�(+/- 0.005� certified absolute accuracy). Data feature points were digitized as points in vector format. Trees are represented as points on the land survey maps and in the digital GIS layer. All digitizing and GIS analysis was performed in Arcview� 3.2a and Arc/Info� 7.21 (Esri).
Tree species are listed by common name on the historic land survey maps. These common names were translated from Godfrey (1988). When ambiguous species were encountered, physiographic and habitat associations were used in order to clarify which species was named. Pine (Pinus) was only recorded at the genus level. Many of the corners are labeled only as �stake� or �post� on the plat maps indicating how the lot corners were marked by the surveyor. In many instances, the species of the post is noted. After consultation with Mark Cowell (personal communication 1999) who analyzed similar witness tree documents in the Oconee River valley in central Georgia, these posts were interpreted as being selected from trees in the immediate vicinity of the corner and are, therefore, indicative of what species were present.
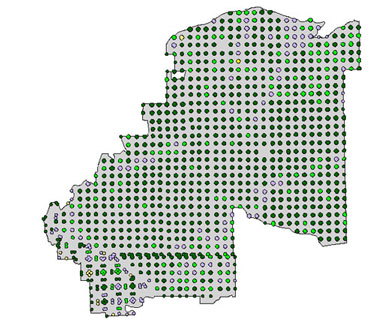
From witness tree locations (point data) to forest cover (continuous data) Data points representing witness tree locations are often directly plotted to describe presettlement vegetation (Fig 2) (Hong et al. 2000). A point coverage, however, does not adequately describe forest cover. To create a continuous vegetative surface, grids or polygon maps must be interpolated from the survey points (Hong et al. 2000, He & Ventura 1995, Brown 1998a & b, White & Mladenoff 1994). The following section describes the methodology used to create the forest cover map using ARC INFO 7.2.1, GRID, and ArcView 3.2.
Using Arcview�, the survey points were buffered with a radius of 160 m (Fig 3). This buffer size adequately captured the five point clusters located at most of the section corners (corner marker and four witness trees). The resulting buffer polygons were then spatially joined to the survey points. Next, the point attribute table was edited to include the poly-ID of the polygon it was located within. The descriptive information carried in the polygon attribute table (PAT) was then reformatted. The end result was a new table containing one record for every polygon (survey point cluster) created by buffering the points. Each record was coded with every tree type occurrence within the polygon (or survey point cluster). While most of the polygons contained five points, as few as one and as many as twelve trees may have been associated with each cluster. (This variability occurs because of differences in surveying techniques employed by the different states. Georgia surveys were conducted by county, and each county may have used different reference grids in the southern portion of Fort Benning resulting in unequally spaced survey points.) The new table representing survey point clusters was linked to the PAT of the polygon coverage (buffered points). Tree names were evaluated and assigned a value of either pine, deciduous, or other. The �other� category was assigned to vegetation that is commonly associated with understory or sucessional environments (smaller trees, shrubs and ground cover). Each polygon was categorized based upon the ratio of tree types present within the cluster as either pine forest, deciduous forest, mixed forest (pine and deciduous), or other (Figs 4 & 5).
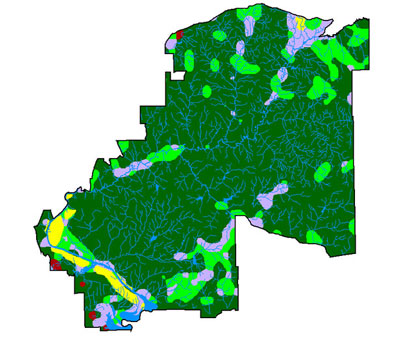
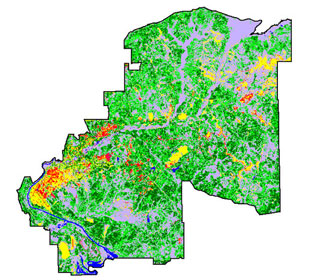
A grid was derived from the polygon coverage using the polygrid command in ARC INFO GRID�. A gridcell size of 60 m was chosen to match the resolution of other data used in the study. The focalmajority command was used iteratively in GRID� to create a continuous surface of vegetation types for Fort Benning. Non-forest/cleared areas were added using CON functions in GRID� (Fig. 6). These areas represent large Native American settlements. The amount of non-forested land is probably underestimated on the map since the exact locations of smaller settlements are not known. The map shows that pine species dominated the landscape at Fort Benning. While this data is extremely generalized, this conclusion is supported by a separate analysis (Dale et al. in review), which indicates that over 95% of the soils at Fort Benning could support longleaf pine populations.
Data and resource availability largely determined the time periods and methods chosen for this mapping effort. No aerial or supplemental remote sensing data were readily available to us for the 1827 to 1974 time period. Several data sources used were available for free via the internet or at minimal cost (cost of reproduction) from the United States Geological Survey (USGS).
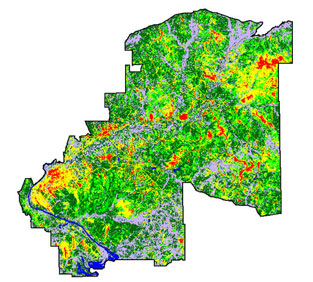
Several sources of remotely sensed data were used to create land cover maps dating back to the 1970s. A combination of ARC INFO� 7.2.1, GRID�, ArcView� 3.2, and ERDAS IMAGINE� 8.2 software was used to derive land cover from satellite imagery.
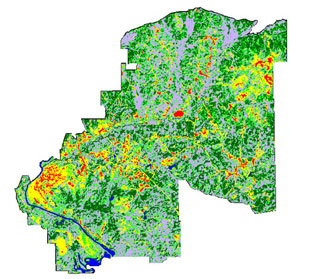
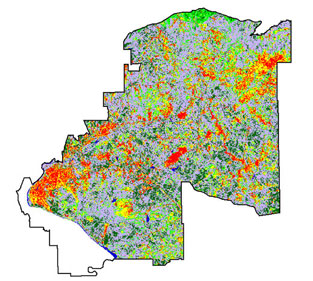
Two Landsat 7 Enhanced Thematic Mapper (ETM) images dated July 24, 1999 were used to create a current land cover map of Fort Benning. The data were acquired from a commercial source and had already been projected and mosaicked using nearest neighbor resampling. Unsupervised classification, which creates a user-defined number of classes based upon spectral response, was utilized to create 45 spectral classes from the imagery. These 45 classes were then combined into six land cover classes using a 0.5 meter resolution digital color orthophoto (1999) and Land Cover Trend Analysis (LCTA) point data (1991) as reference data. The six classes include: water, pine forest, mixed forest (deciduous and pine, areas of sparse forest cover, or areas of transition between forest and non-forest), deciduous forest, non-forest (cleared of forest vegetation but does have some ground cover, may include grassy and transitional areas), and barren/developed. Some confusion between vegetation and water classes required the creation and application of a water mask in GRID� using coincident pixels from the classified imagery and a coverage of lakes and double-lined streams.
To eliminate the presence of clouds and shadows, which were classified as barren/developed, the cloud and shadow areas were digitized in IMAGINE� and then overlaid with the orthophoto in ArcView�. New shapes that more accurately reflected the nature of the vegetation in these cloud-affected areas were digitized on-screen. These polygons were coded with a vegetation type according to interpretations drawn from the orthophoto. The resulting shapefile was plotted with the classified image and adjusted to maintain continuity and blend with neighboring pixels. In ARC INFO�, a grid was created from the cloud affected area shapefile and Imagegrid was used to convert the classified image into a grid. Values from the cloud/shadow grid were used to mask the cloud- affected areas of the classified grid. LCTA data was used to evaluate the classes. Results varied due to inconsistencies in scale, definitions of cover types, and the sampling dates of the field data. The ability of this classification to differentiate between forest classes is questionable. Errors of omission in the pine and deciduous classes and of comission in the mixed classes are expected. Specifically, the �mixed forest� class may contain pixels of deciduous forest and pine forest resulting in an underestimation of these classes. Appropriate data were not available to perform a rigorous accuracy assessment. A high level of uncertainty is associated with the classification. The goal of this project, however, is to develop a cost and time effective tool for land managers at military installations, and not to create a map product. The quality of the classification is open to improvement if more resources become available.
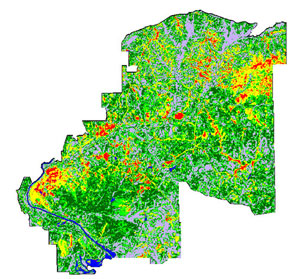
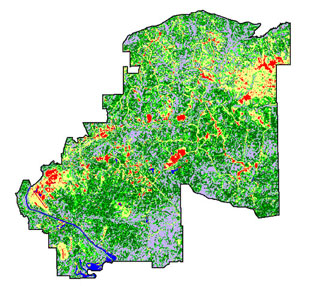
The North American Landscape Characterization (NALC) data were also used in this analysis. The NALC project is a component of the National Aeronautics and Space Administration (NASA) Landsat Pathfinder Program. The data are largely derived from Landsat Multispectral Scanner (MSS) imagery and were ordered from the Earth Resources Observation Systems (EROS) Data Center. The NALC data set covering the Fort Benning area is composed of two scenes of triplicates dated 1974, 1983/86, and 1991. The two scenes had to be mosaicked in IMAGINE before the classification process could begin. The nearest neighbor algorithm was used for all resampling. The resolution of these data are 60m, and the spectral characteristics of the series vary considerably from year to year. The ability of the classification to differentiate between forest classes varies within the time series. Changes in the size of the �mixed forest� class may be more indicative of improvements in the collection (sensors) and processing of the satellite data than of actual changes in forest composition. The same classification techniques described in the previous section were used. The 1991 image was classified first, and was then used as a �reference base� for the earlier images. Appropriate reference data were not readily available for dates earlier than 1990.
The National Land Cover Data (NLCD), sponsored by the Multi-Resolution Land Characteristics Consortium (MRLC), were also utilized in this project. The NLCD are comprised of land cover data for the conterminous United States. The maps were created using MRLC�s Landsat 5 Thematic Mapper� satellite data archive and many other ancillary sources. Land cover data for Georgia and Alabama were downloaded from the EROS Data Center. The maps were derived from a series of Landsat 5 TM imagery dating from between 1990 and 1993. The resolution is 30 m. Prior to generalization, these images were merged and subsetted to the Fort Benning area using GRID. The classes were generalized from twenty-one to six classes to match the 1999 classification. The MRLC image shows less non-forest area than other maps in the series. The metadata, however, states that accurate definition of the transitional barren class was �extremely difficult�. The majority of pixels in this class correspond to clear-cut forests in various stages of regrowth. Thus, there are likely forested regions classed as transitional barren and vice versa producing confusion between clear-cuts, regrowth in clear-cuts, forested areas, and shrublands. Some confusion between non-forest and deciduous forest classes in the MRLC map is apparent when compared to the 1991 and 1999 classifications.
An additional source for comparison is a 1988-1990 land cover classification of Georgia developed by Georgia�s Department of Natural Resources (DNR). This classification used Landsat TM imagery dating between 1988 and 1990. Fifteen land cover classes were aggregated into the six classes described above. It is interesting to note the rather large discrepancies between this image and the MRLC image. To be sure that we are handling this disagreement, appropriate Benning personnel familiar with the vegetation and history of the base are currently reviewing all of the land cover maps.
Indicators of fragmentation will be examined to understand land cover changes at the landscape level. Candidate landscape metrics that describe a diversity of land use types and how they may affect land management activities have been selected for analysis. Examples of landscape characteristics that are typically important include: edge density, contagion, mean nearest neighbor distance, mean proximity index, and perimeter area fractal dimension (O�Neill et al. 1988, Hargis et al. 1998). These metrics largely describe the size, shape, and distribution of relatively homogenous �patches� of vegetation or land cover. Together, these metrics cover a diversity of features describing landscape patterns that can relate to how changes in fragmentation affect the biological integrity of terrestrial systems (e.g., Fahrig and Jonsen 1998). The estimates of landscape metrics uses the 1827 land cover map to provide baseline conditions. Classifications derived from remotely sensed data were assessed to identify changes through time.
Two programs were used to evaluate the land cover maps and calculate landscape metrics. The first is a relatively new suite of tools available in an ArcView extension. The Analytical Tools Interface for Landscape Assessments (ATtILA) was created through a cooperative effort between the Environmental Protection Agency (EPA) and the Tennessee Valley Authority (TVA) (Ebert et al. 2001). The extension requires Spatial Analyst and the following data for computing landscape metrics: a land use/land cover grid, elevation and slope grids, a streams line theme, a roads line theme, a population polygon theme (county, track or block), and a precipitation grid. One of the real benefits of using this tool is that it allows the calculation and summation of metrics by reporting unit. It was useful to have one set of calculations for the entire installation. We are also interested in metrics derived from watersheds and training compartments. The training compartment calculations are particularly useful as certain military activities are designated to only occur in specific training compartments. Currently, these training compartments are the closest thing we have to a military land use coverage. The following ATtILA metrics are of particular interest to this project: land cover proportions by reporting unit, the amount non-forested land encountered on steep slopes, diversity metrics, and forest patch metrics. Metrics related to road density, impervious surfaces, spatial relationships between streams and roads, and land cover encountered along riparian corridors are also valuable.
Landscape metrics were calculated for each land cover map, and results were compared. Since the input data are of different resolutions, caution must be used in interpreting the results of the analysis. Several iterations of the calculations were run for each land cover map using different input parameters such as minimum patch size, maximum separation between patches and analysis window size. For comparison, the land cover maps were resampled and standardized to a common resolution of 60 m.
Additional metrics were calculated for each land cover map using the raster version of FRAGSTATS. This software may be accessed through the use of Arc Macro Language (AML) and was designed to quantify landscape structure (McGarigal and Marks 1995). While there is some replication of metrics, FRAGSTATS calculates some metrics that are not standard output of ATtILA and can output information for specific cover types in addition to summary information for the entire landscape. To determine which landscape metrics may be the most useful and cost effective indicators of environmental change at Fort Benning, a suite of metrics must be calculated, summarized, and evaluated with ancillary data such as land use, fire history, and climate data.
We are just beginning to analyze landscape metrics from the landcover maps described in this paper. Presented below are some initial observations taken from a comparison of landscape characteristic output from ATtILA and FRAGSTATS. Results described below were calculated using the default parameters of ATtILA (1 pixel minimum patch size, 0 pixel separation of patches, 10 pixel search radius, 7 pixel patch edge definition and 9 pixel moving window). Experimentation with other parameter values is ongoing. It is important to note that we cannot conclusively determine which metrics are most valuable as indicators of change and military land use at Fort Benning without a better understanding of the level of uncertainty associated with the land cover classifications. Errors in the classification may falsely indicate change that is not occurring and may also mask real changes to the landscape.
Wide discrepancies between the land cover maps created by the GA DNR and the MRLC resulted in rather large deviations from trend in the landscape metrics for the early 1990s. For this reason, those maps will not be discussed in this section. Metrics were calculated for the historical (1827) data, the 60 m NALC data (1974, 1983/86, and 1991), and the 30 m (1999) land cover classification. The 30 m classification was resampled to a 60 m resolution for comparison with the NALC and historical data.
Fort Benning has experienced a gradual decrease in forest populations coupled with an increase in non-forest vegetation (Table 1). The percentage of non-forest vegetation found on steep slopes (greater than 3%) is also on the rise. Areas of pine forest appear to be increasing, although the magnitude of this increase may be underestimated due to the misclassification of pine pixels into the mixed forest class. Areas of deciduous forest appear to be decreasing; however, caution must be exercised in interpreting these results due to uncertainty associated with the �mixed forest� class. The statistical significance of these numbers is related to uncertainty associated with the classification process.
Table 1. Percentage Land Cover Composition, Fort Benning, GA|
Date |
Forest ��� % |
Pine �� % |
Mixed ��� % |
Deciduous ������ % |
Barren ���� % |
Non-Forest ������� % |
Non-forest on steep slopes % |
|
1999 |
76.231 |
34.065 |
21.5371 |
20.629 |
4.6059 |
19.1631 |
13.9975 |
|
1991 |
77.9872 |
29.0650 |
22.9136 |
25.9187 |
3.8312 |
18.2716 |
13.344 |
|
1983/86 |
80.4795 |
27.4658 |
29.8621 |
23.1516 |
4.1953 |
15.3252 |
11.1388 |
|
1974 |
82.9005 |
23.9859 |
23.3856 |
35.529 |
3.2056 |
13.8939 |
9.3257 |
|
1827 |
97.4475 |
78.1853 |
11.7355 |
11.7355 |
NA |
2.5525 |
0.5983 |
The trends in riparian areas are similar (Table 2). ATtILA calculated land cover composition within a 1 pixel buffer zone of streams. Notably, the percentage of forest in riparian zones appears to have decreased between 1974 and 1999, with the rate of change possibly slowing in the 1990s. The percentage of non-forest and barren cover types in this buffer has increased with a slight decrease of barren areas in the 1990s. These numbers can possibly be related to changes in management practices at Fort Benning in the last decade.
Table 2. Land Cover Distribution in Riparian Areas (60 m buffer of streams)|
Date |
Forest |
Pine |
Mixed |
Deciduous |
Barren |
Non-Forest |
|
1999 |
85.8149 |
38.4712 |
16.8006 |
30.5431 |
1.7338 |
12.4513 |
|
1991 |
86.1888 |
32.0574 |
22.4120 |
31.7195 |
1.9144 |
11.8967 |
|
1983/86 |
89.3779 |
27.4933 |
30.4007 |
31.4839 |
1.7922 |
8.8298 |
|
1974 |
90.6792 |
27.0853 |
23.4212 |
40.1728 |
1.3079 |
8.0128 |
When computing patch metrics, the ATtILA software treats all forest classes as a single patch type. Diversity indices such as the Shannon-Weiner index and the Simpson diversity index did not change significantly during between image dates. The number of forest patches present, using one 60 m pixel as the minimum patch size recognized, has been increasing, and the rate of change has increased in the 1990s (Table 3). Average patch size has been decreasing throughout the period of measure. The proportion of largest forest patch to total forest area decreased between 1827 and 1974 and has been slowly increasing in the ensuing decades with a greater increase occurring in the 1990s. Metrics associated with forest fragmentation including pixels identified as patch, transitional, edge, perforated and interior, have changed by orders of magnitude in the 1990s. More exploration of the data and the influence of scale on these metrics needs to be conducted before further conclusions can be drawn. The affect of uncertainty associated with the land cover classifications on these metrics is unknown.
Table 3. Selected Forest Patch Metrics from ATtILA|
Metric |
1827 |
1974 |
1983/1986 |
1991 |
1999 |
|
# Patches |
3 |
202 |
238 |
248 |
395 |
|
Largest patch size |
719348400 |
563396400 |
541213200 |
525078000 |
546213600 |
|
Mean Patch Size (ha) |
239833200 |
3000403 |
2467845.4 |
2291530.6 |
1408557 |
|
Shannon-Weiner Diversity Index |
0.7439 |
1.4747 |
1.5203 |
1.5274 |
1.6566 |
|
Simpson�s Diversity Index |
0.6312 |
0.254 |
0.2381 |
0.2338 |
0.22 |
While ATtILA calculated forest metrics without differentiating between forest types, FRAGSTATS used each of the six land cover types as a valid patch class. Inconsistency within the mixed forest class may have skewed the output statistics in the 1980s. Thus, we only include the results for the pine forest and non-forest patch types (Tables 4 & 5). Several landscape level measures showed no statistical difference between maps during the period of analysis. Further research regarding the accuracy of the classifications and the sensitivity of the metric calculations needs to be completed before these measures can be fully evaluated.
Table 4. Selected Class Metrics, Non-Forest Class (from FRAGSTATS)|
Metric (NON-FOREST) |
1974 |
1983/86 |
1991 |
1999 |
|
Percent of landscape |
13.761 |
15.152 |
18.065 |
18.948 |
|
# Patches |
1638 |
1713 |
2175 |
3751 |
|
Mean Patch Size |
6.201 |
6.529 |
6.129 |
3.729 |
|
Largest Patch Index % |
1.937 |
2.566 |
3.431 |
2.580 |
|
Patch Density (#/100ha) |
2.219 |
2.321 |
2.948 |
5.082 |
|
Total Edge (m) |
2520660 |
2830740 |
3179940 |
4080960 |
|
Mean Patch Fractal |
1.049 |
1.051 |
1.044 |
1.042 |
|
Double Log Fractal |
1.558 |
1.561 |
1.537 |
1.592 |
|
Area-Weighted Mean Fractal |
1.210 |
1.219 |
1.228 |
1.214 |
|
Interspersion/Juxtaposition % |
76.690 |
70.712 |
76.062 |
80.117 |
|
Metric (PINE FOREST) |
1974 |
1983/86 |
1991 |
1999 |
|
Percent of landscape |
23.757 |
27.155 |
28.737 |
33.682 |
|
# Patches |
3080 |
5048 |
3904 |
3494 |
|
Mean Patch Size |
5.693 |
3.971 |
5.431 |
7.116 |
|
Largest Patch Index % |
1.169 |
3.337 |
4.261 |
5.212 |
|
Patch Density (#/100ha) |
4.173 |
6.839 |
5.291 |
4.733 |
|
Total Edge (m) |
4290840 |
5753400 |
6083280 |
6464760 |
|
Mean Patch Fractal |
1.047 |
1.047 |
1.051 |
1.045 |
|
Double Log Fractal |
1.516 |
1.581 |
1.465 |
1.600 |
|
Area-Weighted Mean Fractal |
1.186 |
1.206 |
1.216 |
1.266 |
|
Interspersion/Juxtaposition % |
55.479 |
51.170 |
59.625 |
68.972 |
The metrics suggest that altered management practices in the 1990s may have resulted in changes to the landscape at Fort Benning, GA. Several trends, such as an increase in non-forested and barren lands in riparian buffers were slowed or reversed in the last decade. Pine forest, on the other hand, appears to have been increasing in the last ten years. Improved monitoring techniques coupled with an aggressive management strategy for perpetuating pine forest at Fort Benning may have resulted in an increase in pine populations and a decrease in hardwood invasion. This management strategy includes harvesting timber and burning to establish and maintain viable pine communities. While it appears that the percentage of non-forest land has been slowly increasing, the number of non-forest patches has increased tremendously in the last decade. Consequently, the size of these patches has decreased significantly. Altered management has constrained certain land uses to smaller geographic areas. The next step in this process will be to correlate land use and management with the metrics described in this paper.
Once a complete set of metrics have been calculated and evaluated at different scales and with different input parameters, results can be compared and reviewed for change. After examples of significant ecological change have been identified, the investigation of possible causes begins. If connections between landscape change and land use or management can be easily determined, that metric can be used as an ecological indicator to aid land mangers in decision making. Due to the level of uncertainty associated with the land cover classifications, however, these metrics should be interpreted with caution.
Reviews of an earlier draft of the paper by Tom Ashwood and Tammy Beaty were quite helpful. The project was funded by a contract from the Strategic Environmental Research and Development Program (SERDP) Ecosystem Management Program (SEMP) to Oak Ridge National Laboratory (ORNL). Oak Ridge National Laboratory is managed by the University of Tennessee-Battelle LLC. for the U.S. Department of Energy under contract DE-AC05-00OR22725.
The submitted manuscript has been authored by a contractor of the U.S. Government under contract DE-AC05-00OR22725. Accordingly, the U.S. Government retains a nonexclusive, royalty-free license to publish or reproduce the published for of this contribution, or allow others to do so, for U.S. Government purposes.
Creators of Analytical Tools Interface for Landscape Assessments (ATtILA) Version 2.9
Lead programmer: Donald W. Ebert (1)
Programmer: Timothy G. Wade (1)
In Cooperation With: James E. Harrison (2) and Dennis H. Yankee (3)
1- US Environmental Protection Agency
Office of Research and Development
National Exposure Research Laboratory
Environmental Sciences Division
Landscape Ecology Branch
Box 93478
Las Vegas, NV 89193
2- US Environmental Protection Agency
Region 4
Sam Nunn Federal Center
61 Forsyth St., SW
Atlanta, GA 30303
3-Tennessee Valley Authority
Environmental Research Center
17 Ridgeway Road
Norris, TN 37828
Bourdo, E.A., Jr. 1956. A review of the General Land Office Survey and its use in quantitative studies of former forest. Ecology 37: 754-768.
Brown, D.G. (1998a) Mapping historical forest types in Baraga County Michigan, USA as fuzzy sets. Plant Ecology, 134, 97-111.
Brown, D.G. (1998b) Classification and boundary vagueness in mapping presettlement forest types. International Journal of Geographical Information Systems, 105-129.
Dale and Beyeler. In press. Challenges in the development and use of ecological indicators. Ecological Indicators. Vol. 1.
Ebert, Donald, Timothy Wade, James Harrison and Dennis Yankee. 2001. Analytical Tools Interface for Landscape Assessments (ATtILA) User Guide- Version 2.9. DRAFT
Foster, H. Thomas. 2001. Behavioral Ecology of Creek Indian Residential Mobility. Ph. D. Dissertation, Department of Anthropology, Pennsylvania State University.
Foster, HT, II, and Abrams, MD. In review. Physiographic analysis of the pre-European settlement forest in east-central Alabama. Canadian Journal of Forest Research.
Godfrey, Robert K. 1988. Trees, shrubs, and woody vines of northern Florida and adjacent Georgia and Alabama. University of Georgia Press, Athens.
Hong, S. He, David J. Mladenoff, Theodore A. Sickley and Glenn G. Guntenspergen. 2000. GIS interpolations of witness tree records (1839 � 1866) for northern Wisconsin at multiple scales. Journal of Biogeography 27: 1031-1042.
He, H.S. & Ventura, S.J. 1995. Apostle Islands vegetation coverage-a GIS framework. Symposium of International Society for Photogrammetry and Remote Sensing, pp. 59-68. Commission IV, Mapping and Geographical Information Systems, Madison, WI.
Kane, S. and Keeton, R. 1998. Fort Benning: the land and the people. Southeast Archeological Center, National Park Service. Tallahassee, Florida.
Leslie, M., G.K. Meffe, J.L. Hardesty, and D.L. Adams. 1996. Conserving Biodiversity on Military Lands: A Handbook for Natural Resources Managers. The Nature Conservancy, Arlington, Virginia.
McGarigal, Kevin,, & Barbara J. Marks. 1995. FRAGSTATS: spatial pattern analysis program for quantifying landscape structure. Gen. Tech. Rep. PNW-GTR-351. Portland, OR: U.S. Department of Agriculture, Forest Service, Pacific Northwest Research Station. 122 p.
O�Neill, RV, Krummel, JR, Gardner, RH, Sugihara, G., Jackson, B., Dangelis, DL., Milne, BT, Turner, MG, Zygmunt, B., Christensen, SW, Dale, VH. And Graham, RL. 1988. Indices of landscape pattern. Landscape Ecology 1: 153-162.
White, M.A. & Mladenoff, D.J. 1994. Old-growth forest landscape transitions from pre- European settlement to present. Landscape Ecology 9, 191-205.
Whitney, Gordon G. 1994. From coastal wilderness to fruited plain: a history of environmental change in temperate North America 1500 to the present. Cambridge University Press, Cambridge.