Keith Rice
Lynne Heasley
Hawthorne Beyer
Raymond Guries
Abstract: The Kickapoo
Valley in Wisconsin exemplifies the dramatic change in the Midwestern landscape
from agrarian to amalgamated land use. This change was documented
and simulated through the use of an extensive temporal GIS that covered
a fifty-seven year time period (1939 - 1995). This study demonstrates
that social factors have a strong influence on landscape composition and
structure, and that these influences can be highly variable over small
distances. The difficulties of quantifying social and cultural factors,
and of merging spatial explicit technology (GIS) in the examination of
landscape ecology and environmental history are discussed.
Introduction
Standing on a hillside,
whether desolate or evergreen, it is often difficult to imagine all of
the past forces that created the present landscape. A biologist might
examine the flora and announce that that the maples are supplanting an
oak-hickory forest. A geomorphologist might envision the terrain
and surmise that the hillside was part of a glacial moraine. An economist
might speculate on how the remaining dairy farms dotting the countryside
were still making a living. While the tax assessor sees dollar values
attached to each partitioned property.
The landscape is tied to both environmental and social forces. It is closely connected to the issues of ecology and land ownership. But the connections are difficult to comprehend without examining the human and environmental histories - in both a spatial and temporal format. The landscape is a multi-faceted puzzle that is difficult to piece together and picture its history and the true reality of the present. Just as we pick up individual pieces of a puzzle, or let the pieces sift through our fingers, we are searching for the correct components that will allow us to envision the whole. If we need to make the best decisions on managing the land than we need to understand its previous history and ecology. Planning the future of a complex landscape depends on making sense of the previous path already taken. Fortunately, one of the greatest strengths of a Geographic Information System (GIS) is its ability to piece together the complex landscape puzzle.
Beginning in 1996, over a five-year period, a team of University of Wisconsin (UW) researchers used GIS to develop a landscape history of three townships within Vernon County in southwestern Wisconsin. Located within the Kickapoo Valley, this area mirrors the typical Midwestern landscape that fifty years ago was agrarian and now is an amalgamation of diverse land use. Hidden in the landscape and history of this obscure place are questions about property and nature. What are the connections between land ownership and the resultant landscape? In what ways have larger historical processes shaped or been shaped by a township's land tenure and landscape patterns? How are property rights and the natural environment balanced? In the Kickapoo Valley such questions reveal places of incredible diversity where rural life is being continually constructed and reconstructed, defined and redefined.
In this study GIS served as the foundation for constructing the history and spatial dynamics of three townships in the Kickapoo Valley. Data was acquired and constructed from a wide variety of resources, but GIS was the melting pot for integrating a large multi-disciplinary project into a cohesive framework. This paper delineates the GIS components that were required in developing the history and evolution of the Kickapoo landscape, as well as a snapshot of the results that illustrate the importance of including social and cultural factors in solving the landscape puzzle.
Targeting the Study Area
The Kickapoo Valley spans
766 square miles distributed among four counties in the "driftless area"
of southwestern Wisconsin. It has an elaborate network of streams
and creeks, steep slope-valley topography, as well as the being the habitat
of ecologically and economically important biotic communities. The
Valley is also home to 30,000 people who are diverse in their cultural
background, land tenure and history. It has long-time grain and dairy
farmers, the Amish, Ho Chunk Indians, ranchers, loggers, developers, recreational
urbanities and the U.S. Government as its occupants (Heasley and Guries,
1998).
Three contiguous townships, Clinton, Stark, and Liberty, were chosen since they captured much of the aforementioned cultural and environmental diversity. The townships were small enough to identify spatial or historic tenure (parcels) and landscape patterns (patches), but large enough to examine regionally. Townships were also used since in the U.S. they are the basis for most land policy, zoning, and taxation.
Capturing the Essence
of the Landscape - Elements of the Database
Many environment-based GIS
layers were acquired for the study, including 1:24,000 scale U.S.G.S. Digital
Line Graph (DLG) and Digital Elevation Model (DEM) information for hydrology
and elevation themes, section lines, highways, wetlands, and watershed
data. But, the two most important geographic layers of the Kickapoo
database were the parcel and land cover themes. Although, these are
common layers for a present-day county GIS, it is uncommon to have these
themes for time periods that date before 1990.
In this study, parcels were given the title land tenure, since they contained more than simple land ownership but attributes that mirrored the cultural dynamics of the township. Land tenure was divided into (a) ownership parcels (size, shape, number, rate of turnover), (b) parcel type (public, private), (c) landowner identity (livelihood, cultural group), and (d) landowner residence (local, region, city, state, or out of state). Land cover was defined as landscape, since it was seen as a mosaic of environmental patches or habitats of varying scales. It was divided into (a) land cover/land use (e.g. contoured agriculture, wet meadow, pasture), (b) forest ecosystem (e.g. oak-hickory, maple-bassword, riparian), (c) ecological patch: size, shape, type, location, (d) landscape position: ridge, hillside, valley, and (e) topography: slope, aspect.
Land Tenure and Landscape would be completed for a series of five temporal themes - snapshots of a fifty-seven year time period. Originally, it was planned that the time periods would be separated by ten to fifteen years and that periods noted for cultural and environmental changes would be included. Extensive land records and aerial photographs would also have to be available to complete both temporal themes. In the end the critical factor for choosing the dates was the availability of aerial photographs. Fortunately since the 1930's most counties in the Midwestern United States acquired aerial photographs due to state and federal policies. In Vernon County, where Clinton, Stark, and Liberty were located aerial photography was available for 1939, 1954, 1967, 1978, and 1995. Except for the seventeen-year time frame between 1978-1995 the remaining dates fit the original criteria. For example, 1939 provided a time frame after the economic depression of the 1930's, but before WWII, and 1954 was during the height of national economic prosperity and the beginning of the so-called baby boom generation. Limiting the study to twenty-year slices of history was discussed, but it was believed that important cultural or ecological shifts would be loss. In fact this was a 'trade-off' in the research design since six townships were originally targeted, but limited to three in order to maintain the five temporal periods. In retrospect this ended up to be a wise decision.
The Landscape Theme
The framework of the landscape
layer was the available 1995 orthophotos that Vernon county provided.
The availability of digital orthophotography is now common for individual
counties, and for some color orthophotos (e.g. Portage County, WI) are
superceding the B&W images. Orthophotography was especially important
for the Kickapoo Valley since simple rectified images would not have been
sufficient given its variable topography. Standard 9 x 9 inch B&W
aerial photographic prints (1:15,000 scale) were available for the remaining
four time periods. Each was scanned at a resolution of 500dpi to
allow for detailed photographic interpretation and heads-up digitizing.
An attempt was made to digitize features from the imagery after each photo
was rectified, however, many photographs still had to be ortho-rectified
in order to properly register locational features. ERDAS' Imagine
was used in the ortho-rectification process, while heads-up digitizing
and editing was accomplished using both ArcView and Arc/Info on a Solaris
UNIX workstation. The 1995 landscape land cover/land use linework
was used as the base linework for resolving any minor discrepancies in
polygon boundaries in interpreting photographs from the other time periods.
Interpretation of the aerial photographs started with 1995 and regressed
backward in time. If boundaries and land cover remained the same
between dates we retained the linework of the later time period (e.g. 1995,
1978), but if boundaries and/or land cover changed we made the changes
and double-checked the interpretation (i.e. more than one interpreter confirmed
the change).
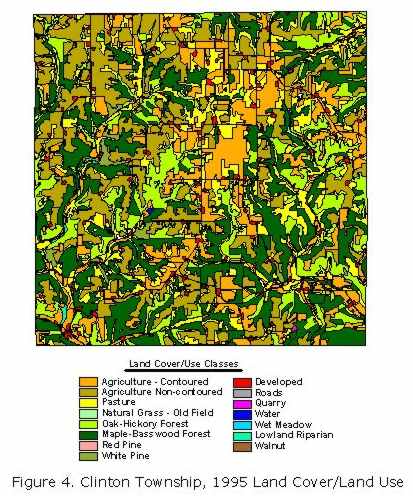
The main land cover/land
use categories were: Agriculture (non-contoured), Agriculture (contoured),
Pasture, Old Field, Oak-Hickory, Maple-Basswood, Red Pine, White Pine,
Developed, Roads, Quarry, Water, Wet Meadow, Lowland Riparian and Walnut.
Some of the categories were slightly ambiguous, such as Old Field and Pasture
and had to be specifically defined. For example, in order to distinguish
between a pasture and an old field, the pasture had to have evidence of
grazing (e.g. clear cattle trails), while old fields were identified by
those plant species that usually invade an abandoned agricultural field.
Some of the classes also are considered to be land use since they have
both an ecological and social perspective.
The identification of forest species was critical to analyzing the change in the landscape mosaic so that the forest category was subdivided into distinct communities of woody and herbaceous species. Interpretation of the aerial photographs, however, was insufficient to achieve the detailed classification. To resolve this problem, a forward and backward iterative approach was taken. The 1995 forest classification was verified through field visits and forest composition interpretation. Many forest patches were easy to identify due to the Kickapoo Valley's logging and grazing history that left distinct boundaries. Nonetheless, some transitions were more gradual, involving mixed hardwoods that necessitated the use of accepted plant community standards (Kotar and Burger,1996) to make a final interpretation.
The Wisconsin Land Economic Inventory (Bordner et.al., 1947) was used for the 1939 classification. The state of Wisconsin conducted the Inventory from 1929 - 1947 to promote land utilization and to mitigate problems from abandoned agricultural and forest cut-over lands. Forestry field researchers compiled resource inventories and mapped land cover across the state, section-by-section and township-by-township. These detailed maps and notes provided the necessary information on the composition of individual forest stands as well as their condition and average tree diameters (giving a rough measure of stand age). The inventories were carried out in our three townships during the years 1937-39 that corresponded with the 1939 photos.
A process of iterative elimination was then used to classify the forests for 1954, 1967 and 1978. For example, if a forest was oak-hickory in 1939 and 1995 it was inferred that it had remained an oak-hickory forest through all the dates. Similarly if stands were dominated by large-diameter (60 years and older) trees in 1995 it was safe to assume that the stand existed in 1939. For those forests that had changed between 1939 and 1995, either from a different land cover type or different forest type the task was to identify the period in which it changed. Some transitions were obvious from the aerial photos. Intensive timber harvests were readily apparent, as were periods of intensive grazing or the abandonment of agricultural fields. For patches without such clear evidence 1950's historical Vernon county forestry records had to be accessed. These provided invaluable information, especially on many privately-owned forests, forest inventories, stand histories, site conditions, tree planting, timber harvesting, the presence or absence of livestock, and enrollment in public forestry incentive programs. Finally, a small subset of forest polygons remained for which no forestry records existed. An on-site inventory was thus necessary in order to determine the age and history of the trees and to determine when the forest cover changed from 1939.
The Land Tenure Theme
Records for ownership parcels
maps were available from county records but did not coincide exactly with
the aerial photos. Parcel maps were from 1940, 1955, 1965, 1978,
and 1995, so that the maximum variation was two years (1965 ? 1967).
A land tenure layer was also created from the 1930 county parcel maps even
though a corresponding land cover layer was unavailable. Digitized
parcel maps were constructed from a number of different sources, including
legal property descriptions from Vernon County tax rolls, state of Wisconsin
geo-referenced digital township and section lines, the original Vernon
County monument survey, and township plat maps from Rockford Map Publishers
(Rockford, Illinois; 1955, 1967, 1978, 1995). Referencing and digitizing
the county parcel maps provided the best-detailed data for delineating
ownership boundaries. Nevertheless, parcel type, land owner identity
and landowner residence was gleaned mostly from archival sources - first
looking at the tax rolls, then seeking out old voting records, telephone
books, memoirs, and official county histories (Vernon County Historical
Museum). If all these sources failed, then local officials and life-long
residents had to be consulted to fill in the information gaps. The
County Land Conservation office, the county forester, county treasurer,
and curator of the local historical museum become key contacts in completing
the information mosaic. The land tenure theme therefore took more
time to develop and research than the landscape layer.
Sifting through the Puzzle
Analysis of the Clinton-Stark-Liberty
GIS database exposed an extraordinary treasure of information. It
revealed distinctly different stories of spatial patterns over time within
neighboring townships that would have been hidden within the scale of county
level data. The morphology of each of the three landscapes identified
three distinct tales ranging from the influence of the Soil Bank in Liberty
to the effect of the failed dam project in Stark. Many of these cultural-ecological
dynamics would have been a blur, or even invisible, without the large-scale
level of spatial and historical discrimination afforded by the GIS analysis.
It also underscored the fact that landscapes and ecosystems can only be
truly understood if intertwined with human history.
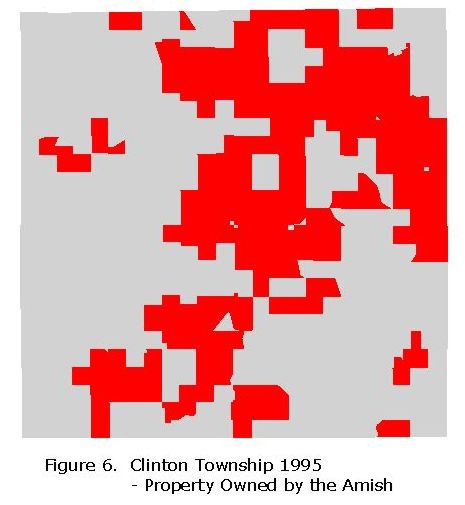
Each township history reveals a multitude of underlying spatial patterns that are separate stories. For instance, the foremost feature in Clinton is the thriving Amish population, who began buying farms in 1965, and by 1995 owned nearly half of the township. In one sense they have maintained the farming community with small to medium parcels and practicing agrarian self-sufficiency and subsistence. But, their influx also changed the landscape. Agriculture land remains but with less contour stripping and the loss of riparian acreage due to degradation from cattle and other livestock. Additionally, they harvest timber from the forests, further changing the oak-hickory forests to maple-basswood communities. As experienced craftspeople the Amish turn oak trees into highly sought after furniture, and then tap the maple trees for syrup. All of these trends would have been difficult to discern without reviewing the temporal land tenure and landscape themes of the Clinton GIS.
In contrast, the Township of Stark was less influenced by a single cultural group, but by government intrusion. The Kickapoo River runs through Stark, passing by the city of LaFarge and a half dozen villages north and south. When the river swelled its banks, it swept away crops and animals and in the worst years rushed through LaFarge. Catastrophic floods in 1951 and 1956 further convinced residents that a dam was needed. The Army Corps of Engineers purchased 8,500 acres of land (50% the size of Stark) and started building a dam in 1971, but federal and state environmental impact statements stopped the project in 1975. It was discovered that even under the strictest of land use and sewage treatment controls the lake would become polluted in a short time. In the end the land that would have been underwater become the Kickapoo Valley Reserve.
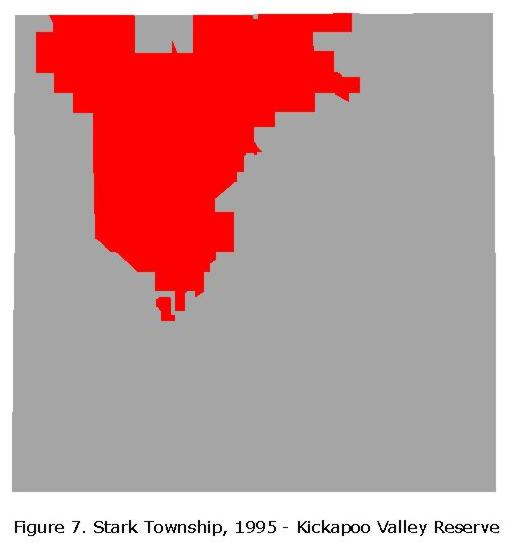
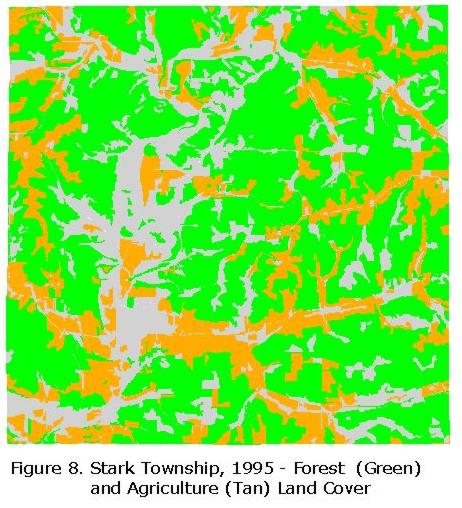
From 1955 to 1995 the LaFarge dam project had the greatest influence on ownership and the landscape. The government bought 140 farms, while land speculators, anticipating lake front properties, bought private land surrounding the proposed lake site. The tenure database revealed that three-fourths of the private land changed hands from 1978 to 1995, and absentee ownership skyrocketed. Yet, the death of the dam restored the natural landscape. Agriculture has been replaced by forest cover, which increased from 40 to 60 percent from 1939 to 1995. The Kickapoo Valley Reserve has a stable riparian forest and wet meadows and is now one of the largest contiguous areas in Wisconsin of hardwood forests. It is one place in the Valley where the oak-hickory forests are being maintained and are not in a state of decline.
Of course in both Clinton and Stark there are many more landscape and land tenure stories, but in each circumstance it is evident how GIS temporal and spatial analysis highlighted their histories. Of all three townships, however, Liberty had the greatest shift in its land ownership and ecological structure and an intriguing tale.
Liberty - A Tale of Conservation
and Fragmentation
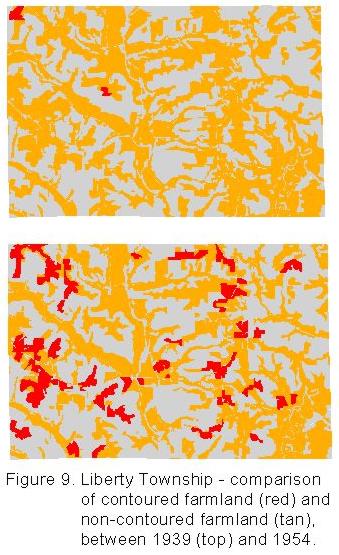
In the 1930's soil erosion
was in the national consciousness and obvious to every farmer in the 1930's.
Yet, Figure 9 shows that Liberty, a small township (6 x 4 miles) in 1939
had relatively little contoured agriculture. Comparing 1939 to 1954 we
see a period during which contour strips had expanded onto nearly one third
of Liberty's cropped land. More precisely, contour strips took up
21 hectares in 1939, a total of two parcels, whereas in 1954 they covered
558 hectares. Contour stripping increased slightly in 1967 to 600
hectares. In reading these three maps together patterns and trends
become more sharply defined. The maps illustrate 'agricultural succession'
driven by federal government research, conservation agents and financial
incentives (e.g. in the 1940's payments establishing contour strips went
from fifty cents an acre to five dollars an acre). It depicts an
idea germinated in the 1930's final bearing fruit by the 1950's.
Essentially, federal soil conservation efforts eventually increased the
public's influence over private cropland, but these policies had unintended
consequences for future land tenure.
From 1954 to 1967 the advancement of contour strips stalled. Agriculture was also in decline - what had been a drop of 170 farm hectares in 1967 dropped 750 hectares by 1995. Pastures were regenerating into forests during the same time and from 1954 to 1995 Liberty agricultural land declined by 60 percent. A reconfiguration of the landscape was occurring. Along with the plunge in cropland, other trends become visible, shifts in land ownership, land in Liberty had a stunning turnover - from 1965 to 1978 the total area of ownership change jumped to 72 percent of the township's area. Even during the Depression era and post WWII, (1930-55) 21 percent of Liberty's land remained with the same owner, but from 1955-78 it was only 11 percent.
After 1955 the absentee landowners started to come, by 1965 they had purchased over half of Liberty's lands, and by 1995 they controlled the majority of the township. The size of ownership also changed, instead of medium-sized farm parcels, Liberty developed several large parcels and clusters of smaller parcels. The GIS database provided the evidence of change, but what had happened to cause the transformation?
The Soil Bank Act of 1956 strengthened the notion of conservation. It was the Soil Bank that paid farmers to take whole farms out of production, and paid them more to convert them to forest. Unintentionally, the Soil Bank helped empty the countryside of farmers. Yet, when the Soil Bank ended in 1965 the wayward farmers had grown older and their children could not realistically start up the family farm again (i.e. too high of an investment). It made sense for the former farmers to sell - to families, investors, and corporations. On many parcels, huge tracts of land were sold at a fraction of their true value to corporations who started large beef ranches thereby replacing the dairy farms. The ranchers transformed the vernacular landscape (e.g. houses, barns) to a grazing pasture.
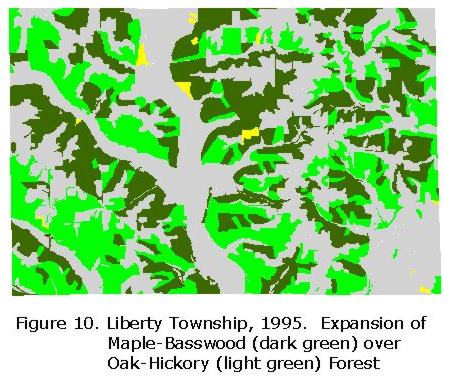
Both real estate developers and vacation homeowners also moved into Liberty. The result was fragmentation of the land parcels and shady development schemes (e.g. Woodland Farms). The township ended up with a large absentee population buying and selling that accelerated property turnover. Additionally, most farmland also included a small woodlot that real estate dealers often cut for timber and logging suddenly boomed in the region. The outcome was that although forests had spread overall since the 1950's, oak-hickory forests declined (1,900 to 1,500 hectares) and maple-basswood increased from 800 hectares (1939) to 1,750 hectares in 1995. Essentially the overall effect was that land ownership flowed out of the township, so that by 1995 the local community's power to enact change had been crippled.
The Final Piece
Individually, landscape
and tenure themes do not reveal landscape morphology, but a temporal GIS
provides the tool to observe the evolution of a landscape. The price
for such a database is the time it takes to build it - the Clinton-Stark-Liberty
GIS took a team of interdisciplinary researchers several years to complete.
On the other hand, the reward is a dynamic history that reveals a thousand
stories. In this case, GIS is the structure that gives the reader a visual
sense of space and time through the Kickapoo Valley. In the juxtaposition
of three townships one can see their separate, distinctive patterns as
well as their common threads. Look closer and you'll see a succession
of oak-hickory to maple-basswood; look even closer and you'll see that
maples are mostly invading the southern aspect in Clinton. These
are the kinds of fine-grained changes that bring us back to the connection
of property and nature. What these three townships also represent
are potential trends and phenomena that are occurring in one form or another
throughout rural America. The ways in which we manage our landscapes
and change them are conditioned first and foremost by property tenure,
and GIS is the key to exploring and understanding those relationships.
References
Bordner et. al. 1929 - 1947.
The Wisconsin Land Economic Inventory (1929-1947) is located in the
State Historical Society
of Wisconsin in Madison, WI.
Heasley, Lynne and Raymond
P. Guries. 1998 "Forest Tenure and Cultural Landscapes:
Environmental Histories
in the Kickapoo Valley." In Who Owns America? Social Conflict Over
Property Rights (Harvey M.Jacobs,ed.), pp. 182 -207. Madison, WI: University
of Wisconsin Press.
Kotar, John and Timothy L.
Burger. 1996 A Guide to Forest Communities and Habitat Types of Central
and Southern Wisconsin,
Madison, WI: Department of Forestry, University of Wisconsin- Madison.
Author Information
Professor Keith Rice
Department of Geography
University of Wisconsin-Stevens
Point
Stevens Point, Wisconsin
54481
(715)346-2629
FAX (715) 346-3372
krice@uwsp.edu
Dr. Lynne Heasley
Environmental Institute
Western Michigan University
Kalamazoo, Michigan 49008-5419
(616) 387-5870
FAX (616) 387-2272
Raymond Guries
Department of Forest Ecology
& Management
University of Wisconsin-Madison
120 Russell Laboratories
1630 Linden Drive
Madison, WI 53706-1598
(608) 262-9975
FAX (608) 262-9922
rpguries@facstaff.wisc.edu
Hawthorne Beyer
Department of Biological
Sciences
University of Alberta
Edmonton, Alberta AB T6G
2E9 CANADA.
hawthornebeyer@hotmail.com