The Traffic Alert System is an intelligent GIS-based traffic management system developed with the objective of providing Internet access to all construction projects and special events that may negatively impact the flow of traffic within the South Bay area of Los Angeles County. The system was developed for the 16 cities of the South Bay with funding from the Southern California Association of Governments.
URL:
http://198.179.206.4/traffic/tas.asp
PURPOSE AND FUNCTIONALITY:
The South Bay Traffic Alert System provides on-line, graphic-based information on current and planned capital improvement projects, construction activity, and special events that may impede traffic flow in the 16 cities of LA CountyÆs South Bay. Users, who may be the general public or fleet operators, use the system to avoid traffic delays, reducing congestion and air pollution.
Staff representatives from each city enter information on road closures and traffic delays using an easy point-and-click on-line management system. Affected street segments are highlighted on a GIS map using a mouse. For each segment or series of segments, the city provides the related work schedule (days and times of closure or delay), level of impact, responsible agency, contact information and, if available, alternate routes. Each city controls access to its data with password and login restrictions. A system administrator at the city of Carson, one of the participating cities, maintains a project database that can be used in generating reports or documenting efforts to comply with congestion management regulations. Carson also hosts the map and web server.
Residents and businesses can access the information anywhere there is a computer and Internet connection. The Traffic Alert System Home Page, linked to participating citiesÆ and the COGÆs web pages, features a map of the greater South Bay. The user is directed to select a city, address, intersection or route with the help of a scroll-down menu and sample fields. The user is also directed to select a time period for which traffic information is desired (today, this week, this month, etc.). After submitting the request, TAS refreshes the map and zooms in on the target area. It highlights in orange all of the street delays entered into the system by the cities for the time period in question. The user is directed to click on any highlighted segment to view the project report sidebar, including contact information.
TOUR
First, the web site visitor enters the Traffic Alert System and is shown the following web page:
From the home page, the user has a variety of ways to seek out traffic-impacting projects for different locations. Four of these options are listed in a list in the top left-hand corner of the web site. The user can search for projects by city, route, address or intersection.
In all of these examples, the application can also refine the search for projects by varying dates. This can include projects that are occurring today, tomorrow, this week, next week, this month or next month. This allows the user to plan future trips accordingly. Fleet operators in particular may find this feature useful in routing deliveries.
Search by City
The first option is to search for a project by city. The user simply has to click on the menu box and then select a date. If there is a project in that city, the application zooms to the site. The image below shows this way of searching for a project.
In the example above, after selecting ôManhattan Beachö the application found a project and zoomed to the project locations on the map. The user can then click on the project he or she is interested in and the application will generate a text report explaining the project and highlight the project in blue.
Search by Route
Another way to search for projects is by ôroute.ö This is especially useful to a web site visitor so he or she can identify any traffic-impacts along a trip driving by car.
To select this feature, the user simply clicks on the ôrouteö tab and a new web page is created allowing the user to enter the start address and end address. The start and end cities are selected through pull down menus, as is the project date.
After submitting the request the application zooms to a map of the route location between the start and end points.
Search by Address
If the web site user wants to search for a project near an address, he or she clicks on the ôaddressö tab, enters the address, selects the city from the pull-down menu and selects the radius distance in miles the application should show. The application will zoom to a view of the map with that distance from the address and display projects if they exist. If there are no projects the application just zooms to the address and shows a map of the location.
Search by Intersection
If the web site user wants to search for a project near the intersection of two streets, he or she clicks on the ôintersectionö tab, enters the two streets, selects the city in which they are located from the pull-down menu and selects the radius distance in miles the application should show. The application will zoom to a view of the map with that distance from the intersection and display projects if they exist. If there are no projects, the application just zooms to the address and shows a map of the location.
Getting information about the project or event
The web site visitor can see current traffic-impact projects as highlighted streets, highways or freeways located on the main map. By clicking on a highlighted project the application will generate a project report. This report can look like the following web page.
Locator Map
A locator map allows the web site user to see the region of southern Los Angeles County that is displayed on the main map. This gives the user the ability to place the map within a larger context.
By clicking on the locator map, the user can move the main map to the location selected.
Interactive Mapping
The main map and locator map are completely interactive. The user can move north, south, east, west and any combinations in between. The user can also zoom in and out of the map using a scaled range located below the main map.
Entering Staff Projects to the Database
City staff from the participating South Bay Cities are able to enter projects on line and in real time through a login and password system found by clicking on the ôadd projectsö link found at the top right-hand corner of the web page.
After entering a login and password, the staff member gets a list of all traffic-impact projects.
The staff member can review/edit the project or delete it by clicking on the appropriate button. Projects can be sorted by project, start date, end date or hours. Staff can also add new projects or contact management.
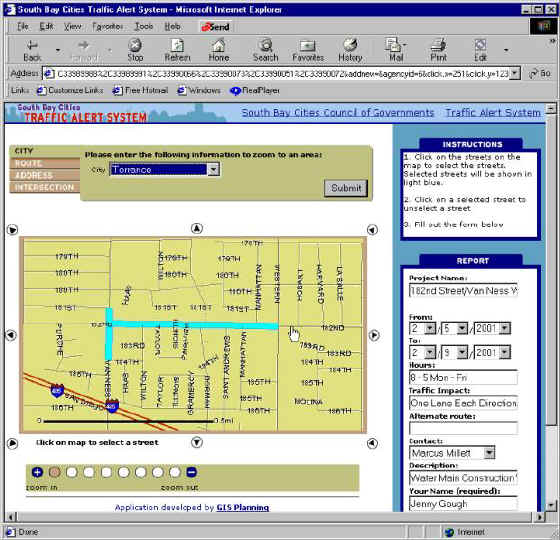
Clicking on ôadd new projectö takes the staff member to a new web site that allows for the input of the project name, dates of the project, hours, traffic impact, alternate route, who to contact, a description and the name of the person who entered the information. The streets that will be affected by the project must be selected by clicking on the main map. Selected streets are then automatically highlighted. To deselect a highlighted street the user simply has to select it again by clicking on the map.
The staff member can zoom to a location by city, route, address or intersection to select streets.
After all of the streets have been selected and the project report has been completed, the staff member clicks on the ôsave changesö button and the information is updated to the application in real time.
Directions for this procedure are located on the same web page as the information is entered.
ARCHITECTURE:
Client Side:
À Browser type and version supported: Netscape 4.x and IE 4.x or higher (Cookies must be enabled). Any browser that accepts cookies.
À Client application: Active Server Pages and html
À Because the target audience is the general public, the web site was created without using frames.
Web Server:
À Windows NT Server 4.0, DELL
À Single Processor, 750Mhz dual, 1 GB RAM
À Firewall
Map Server (same computer):
À Windows NT Server 4.0, DELL
À Single Processor, 750Mhz dual, 1 GB RAM
DATA:
À Street centerline (GDT)
À Three access tables. One table stores the projects that exist at any give time (staff update this database online). The second table stores the street segments associated with the different projects. The third one stores the name, login and password of the participating agencies.
À Size of data: 50 MB
Pablo Monzon, President, GIS Planning, monzon@gisplanning.com, www.gisplanning.com
Tom OÆBrien, South Bay Cities Council of Governments, TObrien848@aol.com, www.southbaycities.org
Barry Waite, GIS Project Manager, City of Carson, California, bwaite@carson.ca.us, http://ci.carson.ca.us