Using GIS to Promote the Sharing of Environmental
Information
Darryl L. Petker P.E.
The California Integrated Waste Management Board is using
GIS to manage and share information about California solid waste issues by
displaying critical environmental information on the World Wide Web. GIS has
become a critical component of this Web-based portal, supporting e-government
and sharing solid waste information for decision-making efforts.
This paper discusses the goals, implementation strategies, and lessons
learned using GIS to share information on solid waste issues including local
recycling/diversion rates, permitting and inspections of solid waste landfills,
and K-12 educational efforts. Discussion includes addressing workplace culture
changes in promoting GIS-based images in reports, papers, presentations, and
meetings.
Esri products used include the ARC IMS, Esri ARC View GIS, Map Objects and
Map Objects IMS, and Arc Explorer.
It is clear that the World Wide Web is quickly becoming the preferred method
for sharing and displaying information. In some cases, current methods used to
share and display environmental information on the Web are inadequate
considering the interdependent nature and amount of data available. There is an
increasing demand by decision-makers, employees, customers, and stakeholders to
have access to environmental information that is accurate, easy to use, and easy
to understand. One proven method of displaying interdependent data is with the
use of Geographic Information Systems (GIS). The use of maps is not new;
however, recent improvements in software have made the display of information in
a GIS format much easier.
The use of technology to display information in a GIS setting to assist in
environmental education, decision-making, program management, and problem
solving is critical for business, government, and personal decisions. The
demands of decision-makers, employees, customers, and stakeholders are requiring
the use and convenience of the World Wide Web to share information. This
opportunity to provide a service by sharing information is manifesting itself in
the form of e-Government, e-Business, and e-Education.
Environmental data throughout the world is being collected and stored in
different formats by many different entities. These formats include both paper
and electronic files that include the use of text, tables, charts, graphs,
reports, photos, maps, and databases for downloading. Groups that store and use
this information include, but are not limited to the United Nations, individual
nations, regions, states or provinces, local governments, environmental
organizations, private companies, and private individuals. Each one of those
groups or organization has a different need for data and different reasons for
collecting and maintaining the data they keep. What they all have in common is a
need for that information to be accurate, easy to obtain, and easy to use and
understand. The use of GIS to develop maps for display of information is
universally understandable with the use of symbols that transcend both the
verbal and written word.
Public and private awareness of environmental concerns is increasing the
requirements for accurate and easily accessible environmental data that may be
used with regards to environmental decisions. As our science and engineering
needs become more advanced and sophisticated, so do our requirements of and for
our data. Demands for information that is interrelated creates a need for
information sharing. These information-sharing requirements in turn create a
demand for staggering amounts of data that can be made available for viewing and
analysis.
One important issue for decision-making is to be able to view correlated
information. For example, a governmental agency’s data relating to ground
water may directly relate to another agency’s control over operational
activities at the site. Information from both agencies could quickly be shared
and displayed using GIS technologies for those making decisions.
Well-trained environmental professionals are having difficulties keeping up
with the sheer volume of information currently available. In many cases,
environmental information is interrelated and must be viewed as part of the
whole. While information is available, it is not available from one source or in
the same format, either electronically or paper files. Considerable time is
being lost looking for and then compiling environmental information from
multiple, disparate sources.
The philosophy of sharing data must be incorporated as an organization
precept so that the design, development, implementation, and maintenance of
information becomes a part of everyone’s recognized responsibilities. This
will help make sure that those involved with data believe that sharing is vital
in the overall process of collection, storage, and display. Thought must be
given to developing environmental databases and information with GIS in mind as
a tool for to assist in analysis and decision-making.
Top
The California Integrated Waste Management Board (Board) is a relatively new
agency as it was mandated by the California Legislature 1989. It is one of six
statewide government organizations that make up the California Environmental
Protection Agency (Cal/EPA). The five other Cal/EPA organizations are the Air
Resources Board, Office of Environmental Health Hazard Assessment, Department of
Pesticide Regulation, Department of Toxic Substances Control, and State Water
Resources Control Board. All of these organizations require and develop
information that relates to their specific programs and their business needs
that may or may not relate to other organizations.
The Board is composed of six appointed members serving four-year terms, and
approximately 475 staff. The Governor appoints four members, one is appointed by
the President Pro Tem of the State Senate, and the Speaker of the State Assembly
appoints one. The Board members meet in public to develop policy, provide
guidance, and make decisions regarding statewide and local solid waste issues.
Issues include statewide and local recycling rates, waste reduction programs,
environmental education, certified used oil centers and limited household
hazardous waste issues, grants and loans programs, enforcement and remediation
actions, and permits for landfills, waste transfer stations, and tire storage
facilities. Additionally, the Board has taken on new initiatives of
Environmental Education for K-12 and encouraging the purchase of green products
to promote sustainability. The Board must plan for and react to the changing
needs of the California waste stream while attempting to meet regulatory
mandates such as protecting the public’s health and safety and reducing the
amount of waste disposed. In order for the Board members to make informed
decisions, information must be readily accessible to them.
The State of California comprises 163,707 square miles and is divided into 58
counties with more than 450 cities/towns. It has the sixth largest economy in
the world with over 33 million residents. California is geographically diverse
with mountain ranges, vast agricultural areas, numerous industrial and high tech
centers, and large metropolitan areas such as San Francisco, Los Angeles, San
Diego, Sacramento, and Orange County. Climate variations range from 4
inches/year of rainfall in the desert areas to 50 inches/year on the north
coast. Population densities vary between 2 and 17,000 people per square mile.
California creates a waste stream that is a challenge to manage due to its
diverse and constantly changing makeup. The Board currently regulates in one
form or another approximately 7,000 facilities that include but are not limited
to:
- Solid Waste Disposal Facilities
- Composting Facilities
- Solid Waste Transfer Facilities
- Waste Tire Facilities
- Certified Used Oil Centers
- Recycled Markets Development Zones
The Board has been and continues to be a pioneer for the State of California
by using the World Wide Web to promote and share information regarding solid
waste issues. The site, located at www.ciwmb.ca.gov, is designed and operated in
an effort to not only educate the public on its mission of managing California
solid waste but also as a platform to share information. One of the Web site
programs in the forefront of sharing information is the California Waste Stream
Profiles (Profiles) site, located at www.ciwmb.ca.gov/Profiles/. Profiles was
envisioned, designed, developed, and is now maintained to serve as a high-level
summary information source. The site maintains links to the source databases if
the viewer requires additional details on the information shown. The site is
designed for use by the Governor’s Office, the California Legislature, federal
agencies, other state agencies, regional and local governments, nongovernmental
organizations, environmental and citizens groups, and individual citizens.
Top
The world is becoming very aware that the World Wide Web readily offers an
incredible amount of information. The amount of pertinent information available
on the Internet and within organizations is beyond one person’s ability to
find, organize, evaluate, and use as a base for decisions or work products.
Information and Knowledge are two very powerful tools in helping to
understand the need and nature of environmental protection. In the past,
personal knowledge, local networking, and research of limited sources helped
provide reasonable solutions to challenges, questions, and problems. However, in
today’s environment more information is being collected and stored. For all
parties to remain knowledgeable, competitive, and accurate, access to as much
organized information as possible is a necessity as a baseline for quality work.
Discussions with groups within the Board and other organizations, which
included management, program staff, and GIS professionals, revealed several
beliefs as to why GIS is slow in being accepted at the staff level. A partial
list of those reasons are:
- Difficult to use. Staff do not know how to use the programs and
training is not available for most of the staff.
- No mandate. There is no mandate to use or display information in this
manner.
- Have not seen the benefit. There are few examples at the staff level of
how GIS can work and the benefits associated with its use.
- Limited software access. Due to cost and licensing requirements staff
has limited access to the software for use and training.
The challenge to bring GIS into the workforce as a tool to share information
can be broken down into three broad areas; government to government, people
within the organization, and government to public.
Government to Government (agency to agency)
The amount of information that government agencies collect and maintain is
increasing. This is due to many factors, but predominant among those is the fact
that we have now been collecting information longer and there are increasing
numbers of new mandates requiring data collection.
While government agencies may collect information only in support of the
mandates, their information may be just a portion of what is needed for decision
makers and citizens to participate. One agency’s information will only be part
of a bigger picture needed to analysis a location or situation. One example of
proposed legislative mandate would require that California school districts
report annually to state agencies on their current waste reduction, reuse, and
recycling efforts. There are approximately 1,000 public school districts and
10,000 schools in California. That would mean that a tremendous amount of
information would be collected, shared, and analyzed on a yearly basis. If each
one of the districts and schools were to report on its efforts with details,
that information would have to be transferred to several agencies including the
Board and the California Department of Education. This would mean that school
districts, the Board, the California Department of Conservation, and the
California Department of Education would all have to work together to facilitate
the orderly collection and sharing of this information. Numerous systems and
management styles would have to develop a plan and reporting architecture that
would work with all involved.
Another example of sharing of information would be environmental permit and
inspection data regarding landfills and transfer stations. There are at a
minimum, four organizations that have responsibility with regards to facilities
that accept and transfer waste to other locations. Those agencies include the
Board, Regional Water Quality Control Board, Air Quality Management District,
and the local enforcement agency (LEA). Information collected by those four
agencies varies in their requirements for the type, amount, and frequency of
data collected.
Decision-makers, citizens, stakeholders, and partners may have need for the
information that is collected by those agencies. As an example, a local government attempting to
permit a new solid waste landfill may need information from each of those
agencies, to ensure that the information is available to share, and in a format
usable by all. The challenge is made difficult by the necessity of continuous
management support, resources allotment, and staff buy-in.
Government to Public
The public is more aware now that governmental
agencies are collecting increasingly more environmental data that they should
have and want access to through a public information request or freedom of
information request. Realization about the types and amounts of information available is a result of
a public that is better educated and more aware of the capabilities of the Web.
The public is also becoming more aware of the importance of data quality as
well as the need for the display of crossmedia information. They realize that
bad or incomplete data can exist and therefore are more open to questioning data
supplied to them. It has also become clear that information from one agency may
not provide the public with a complete picture of the environmental health of a
facility or neighborhood. They want quick and easy access to clear information
forming a complete picture of an environmental situation and they do not want to
have to go to more than one location to get it. The public does not want to
compile information made from separate requests to the California Integrated
Waste Management Board, State Water Resources Control Board, Air Resources
Board, and local agencies.
Therefore, government agencies are now challenged with sharing their
information in order to provide the public with a complete picture of an issue.
In order to share information on the Web, the internal system for data
collection and display must be well managed and maintained.
People Within an Organization
No matter what the goal or purpose, changing the working or organizational
mindset of an organization can be difficult. When an organization embarks on a
new project or path, such as sharing information on the World Wide Web, internal
working procedures may also change.
To successfully implement changes necessary to reach a new or adjusted goal
certain activities will have to be modified at the staff and management level.
It seems that sharing of information has a unique set of circumstances and
attitudes that will need to change. First among those is that all information
must be looked at as a product to be shared. Some
managers and employees think that knowledge is power and if they are the ones
that have the knowledge then they have the power and job security. Another issue that must be addressed
is the quality of the information stored and presented. Both the data quality
and sharing issues need to be adequately addressed in order to develop a program
for placing environmental information on the World Wide Web.
Top
The solution to helping an organization to work within itself or with others
depends on the management. There must be an understandable business need,
commitment, and plan that is clear and reasonable. Major changes, such as
attempting to move an organization in a new direction, require commitment and
resources.
Government to Government (agency to agency)
It is clear that no one organization maintains a complete profile of
environmental information on any topic, material, or location. The amount of
data maintained is staggering and growing. The concern is not only how to share
the information, but how to display it. Therefore, for a decision-maker,
stakeholder, customer, or citizen to obtain all the information on a particular
subject in a clear and easy to use way may require inquires of many sources.
Historically, environmental information has been transmitted in reports or
memorandums containing text, tables, charts, graphs and maps.
Technologies have been evolving and are now at a point where the computer
graphic programs exist that allow clear presentation of considerable amounts of
interrelated information using a GIS system. The use of GIS allows the quick and
efficient sharing of environmental information. Management teams must work
together to facilitate the sharing of information. This will require executive
leadership and guidance to motivate management to overcome internal difficulties
that might slow the sharing process and implement processes that speed the sharing
process. Those problems might range from something as simple as streamlining the
paperwork or file storage system to deep-seated philosophical issues such as
employees who believe “we do not trust them (the public) to understand our
data and they may use it incorrectly” and thereby cause more problems then
sharing data will help.
Government to Public
The World Wide Web offers government agencies a unique opportunity to provide
environmental information to the public. Government agencies can now be a part
of the e-Gov revolution providing information not only to other government
agencies but to the public also. There has always been the understanding that
one of the government’s main jobs is to protect the public health and safety
and the environment. However, the public is increasingly interested in
monitoring governments’ progress in this area and highlighting those instances
where they feel the government has fallen short of its responsibilities.
The use of GIS on World Wide Web provides a government agency with one more
method of sharing information with the public. GIS can clearly and quickly
display interrelated environmental information about an individual’s
neighborhood or location of interest. A GIS-based map can be used to show
information not only from one agency but also from numerous agencies that are
sharing information. As an example, a citizen could use the GIS-based maps on
the Web to quickly view the location of their children’s school and all or
most of the known environmental issues in the area. Those environmental concerns
might include gas stations, public and private drinking water wells, landfills,
chemical plants, and household hazardous waste collection facilities.
Sharing information on the World Wide Web also benefits the government agency
by having the public help with the quality control of the information.
Environmental data that is being collected, stored, and maintained for display
on the Web will benefit not only from the organization checking the information
but from the public’s review of the data. If the location of a school or solid
waste landfill is incorrectly displayed on a map it will quickly be noticed and
can be corrected; whereas that same information displayed in a table or text may
never be corrected. Currently the U.S. Environmental Protection Agency uses GIS
and the WWW to display maps that provide information about permitted or
nonpermitted toxic sites in a neighborhood by entering a ZIP code. The
information displayed on those maps is a compilation of information from the
federal, state, and local governments. The maps may be viewed at www.epa.gov/epahome/comm.htm.
There are two attachments to this paper that compare and contrast the display
methods of using GIS and tables to share information. Attachment #1 displays
information related to Alameda County, California, USA, and where the solid
waste that it produces is disposed of. The map graphically shows the
distributions with percentages and the table displays the same information. This
information helps to plan for solid waste disposal needs on a local and regional
basis by assuring that there is sufficient disposal space for the next 15 years.
The map provides a quicker view of the information as well as putting the
information into a statewide context. Attachment #2 displays information on the
40 Recycling Market Development Zones (RMDZ) in California. RMDZs are used to
help promote the reuse and recycling of materials in California by providing
grants and technical assistance as needed. The map shows the location of the
zones and can be used to see the distribution of the zones throughout the state
and their approximate location in relation to one another. The table lists the
zones for use as appropriate.
People Within an Organization
Possibly the most important and difficult task to consider with implementing
the use of GIS to display information on the WWW is the organization’s
employee culture. In many organizations the maintenance of information is
consolidated--done on an individual level or possible by a few people. This
method of placing information in silos has reinforced the organizational culture
that those with the information are important and that knowledge is power. The
use of GIS to share environmental information on the World Wide Web can be
threatening to those that maintain a tight hold on information.
The need to change the culture of keeping information in silos within an
organization must be changed. That may require a three-fold effort to
effectively create a new culture of sharing information. The three-fold effort
would require effort at the leadership, management, and staff levels of an
organization. An organization’s leadership level must see the value of sharing
the information and demand and hold management accountable for the proper
storage, display, and sharing of environmental data. They must have the
commitment to provide management with the guidance of what they want and the
resources to get the job done.
Management must then take that guidance and resources and design and
implement a plan to replace the silo system with one that is more conducive to
the sharing of information. They must see the benefits of their efforts and be
able to show the benefits to not only the staff who will have to do the work but
also to the middle management that will be responsible for watching the day to
day activities vital to this effort. One action that management may include in
their efforts is to enhance the quality control and assurance by rewarding those
with the most innovative ideas for quality control and assurance of data. Setting clear expectations during recruitment and
hiring is also critical. Scientists,
analysts, and engineers need to understand that data entry, quality and sharing
will be a significant and important part of their jobs.
Computer skills and savvy are now necessary for all environmental
professionals, regardless of whether or not they, or their organizations, wish
to accept this fact. Skills related
to GIS, GPS, and geolocation are not that far behind. They
may also make the sharing of data a performance review item in employee
evaluations. The idea of adding information sharing to employee reviews is
currently being done with such companies as IBM and KPMG Consulting.
The staff will complete the bulk of the work that will ensure that
environmental information within a government agency is correct and accurate.
That staff may be the professional who develops the programs or database for the
information or the staff who is charged with obtaining and placing the
information in the correct database. It is critical that staff believe in what
they are doing and see the reason for it.
Cost and time savings are two reasons that should motivate an organization to
use GIS to share and display information with the public and other government
organizations. Both citizen and staff time will be saved when information is
view using the Web. Staff time will be saved every time another government
employee can quickly access information on the Internet or their intranet--by
the employee gathering the information as well as the employee that would
normally provide the information.
Top
Examples of Organizational Efforts on Sharing Information
Several organizations are now promoting or using GIS systems to provide
information to their customers, stakeholders, and partners. Organizations that
have embraced using GIS to display information include the United Nations, the
U.S. Environmental Protection Agency, and the U.S. Housing and Urban Development
Agency. This short list of GIS users represents a cross section of organizations
using GIS to share information.
The United Nations Environment Programme (UNEP) issued a statement in March
of 2001 stating the importance of placing public environmental information on
the Web. The following is a short exert from a recent UN press release (www.unece.org/env/pp/electronictools/01env02e.htm).
"Information is a vital element in the protection of
our environment. Not only does it raise awareness among decision makers and
the public at large about the problems and issues that should be tackled,
but it also makes it possible to take appropriate action when something goes
wrong. The recent example of the cyanide spill in Baia Mare shows how poor
communication and a lack of information can aggravate an ecological
catastrophe and cause widespread confusion among the population. The
communication technology exists, it is now up to the people working in the
field of environment to use it," says Kaj Bärlund, Director of the
Environment Division of the United Nations Economic Commission for Europe (UNECE).
The United States Environmental Protection Agency (USEPA) currently displays
environmental information on the WWW so that interested parties may view
information that meets their needs. That information allows a viewer to submit a
ZIP code and focus on a specific area and type of environmental information
displayed graphically to see nearby environmental information. The online
interactive maps may be viewed at www.epa.gov/epahome/comm.htm.
The State of California has just created the position of a Chief Geographic
Information Officer and is in the process of forming a unit that will deal
specifically with GIS Information. That work will include setting standards and
architecture for GIS use and files. It will also design and maintain a network
of servers containing minimum levels of information for sharing by government
agencies. This process was long in development and required considerable effort
and buy-in from the Governors’ Office and Cabinet. Once that was completed it
required meetings, networking, and agreements among middle management to agree
on an implementation system. It will now have to work on keeping that staff
motivated to make sure that others share the information for use.
The California Environmental Protection Agency (Cal/EPA) discusses the use of
technology to provide information to those that need it in its strategic vision.
The July 2000 Cal/EPA Strategic Vision (www.calepa.ca.gov/Publications/Reports/StratPlans/2000/)
directly
addresses the open sharing of information and the use of technology to meet that
goal. The vision states that three of Cal/EPA’s eight core values are open
access, collaboration; and innovation. These three values directly relate to the
sharing of information via the Web. The vision also states that Cal/EPA will:
“Create an Internet-based, agency-wide, integrated information
management system that is accessible to the public.”
Cal/EPA is currently undergoing an upgrade in its GIS data
collection, storage, and display systems, with other improvements proposed over
the next few years. The current and proposed improvements will help insure that
environmental information is readily accessible for decision makers, program
staff, customers, and stakeholders.
Possibly the biggest obstacle to the successful implementation of a GIS
system is obtaining buy-in from those involved in the collection and preparation
of the information for display. This requires both management and program staff
acceptance and participation. Management must provide the guidance and resources
to let those involved that this is not another flash in the pan project. Staff
must know that management is on board with more than just talk; there must be a
commitment of resources. Staff must know that the system has a goal, will work,
and provide quality information. They need to be able to believe that the end
product will help in sharing information and save time.
The California Integrated Waste Management Board is currently realizing benefits of using GIS in the display and sharing of information. They have
an effort underway to add demographic, education and public schools (K-12), and
environmental aspects into the current generation of maps. The board is also
looking at upgrading it GIS system in an effort to share information with other
agencies.
Top
The effective sharing of available information is critical to helping all
access and review the large and interrelated amounts of information regarding
environmental issues. The effective use of resources requires that decisions be
made on the best and most complete information available. The use of GIS is one
method that can be used to clearly show interdependent and interagency
information for decision making. The use of GIS to display and interrelate
information for decision-makers, program staff, and interested parties is an
effective method that is available to us at this time. The use of GIS to share
information between government agencies, allowing stakeholders to see all
pertinent information in one format is now expected. The United Nations, USEPA,
and the State of California are committed to presenting environmental
information to the public using multiply display methods, and one of those
methods is GIS. It will require considerable effort to make sure that both
management and staff buy into and support the continued used of GIS. It has been
found that once GIS is brought into use, both management and staff quickly
realize the benefits in time saving and information sharing. Efforts must be
made to encourage management and staff to incorporate the use of GIS into their
day-to-day activities. That action combined with a concerted marketing and
education plan will have a positive effect on the quality of work with regards
to environmental actions.
One solution to the demand by citizens for access to information is to take
advantage of current and future technology to educate, inform, and share
environmental information using GIS on the World Wide Web.
Top
Attachment #1
Disposal Destination Percentages and Disposal in Tons for
Alameda County
The following is an example that is used to display information using GIS.
The table below shows information relevant to Alameda County. The following
information helps local, regional, and state planners track the amount of waste
received by every county in California.
Alameda County Disposal Destinations: 1999 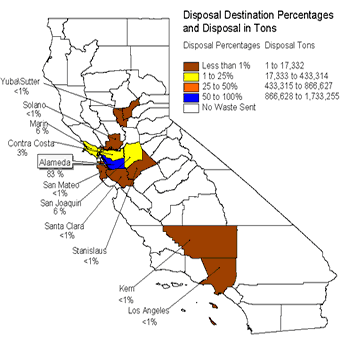 |
Discussion of Information Display
This page shows two ways to display the same information. The
first is in a GIS map and the other is in a table. Both methods show the same
information but use a different context.
The map displays information related to the amount of waste
that the County of Alameda disposes by tonnage range, percentage of total, and
final destination. The information shown is the same as shown in the table
below. The map has the benefit of using colors and geographic references to help
put the data in context.
The table below displays the same information in a tabular
form. |
|
County |
Tonnage Disposed |
% Disposal of Alameda Total |
Range of Tonnages
Disposed in Alameda |
|
Alameda |
1,405,501 |
< 83% |
886,628 to 1,733,255 |
|
Contra Costa |
59,573 |
< 3% |
17,333 to 433,314 |
|
Kern |
282 |
< 1% |
1 to 17,332 |
|
Los Angeles |
630 |
< 1% |
1 to 17,332 |
|
Marin |
108,830 |
< 6% |
17,333 to 433,314 |
|
San Joaquin |
104,991 |
< 6% |
17,333 to 433,314 |
|
San Mateo |
279 |
< 1% |
1 to 17,332 |
|
Santa Clara |
5,537 |
< 1% |
1 to 17,332 |
|
Solano |
2,111 |
< 1% |
1 to 17,332 |
|
Stanislaus |
459 |
< 1% |
1 to 17,332 |
|
Yuba Sutter |
63 |
< 1% |
1 to 17,332 |
Attachment #2
Distribution of Recycling Market Development Zones in
California
The following is displays information on the 40 RMDZ areas in California.
These zones are used to promote the reduction, reused, and recycling of
materials that would otherwise be deposed of in landfills. These zones can be
critical to the Board’s mission of assuring that California reduces the amount
of waste disposed of by 50 percent.
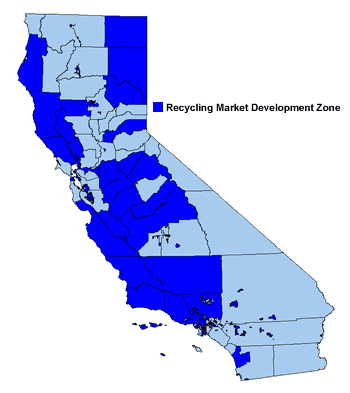 |
Discussion of Information Display
The two attached displays provide information on 40 Recycling
Market Development Zones.
The GIS map shows the State of
California, counties of California and boundaries of the 40 RMDZ areas that are
used for CIWMB recycling efforts.
The table below lists the 40 RMDZ areas located in the State of California in
alphabetical order. |
List of Recycling Market Development Zones in California
|
|
1 |
Agua Mansa |
15 |
Madera County |
29 |
San Bernardino/Kaiser |
|
2 |
Anaheim |
16 |
Merced County |
30 |
San Diego |
|
3 |
Central Coast |
17 |
Mojave Desert Region |
31 |
San Francisco |
|
4 |
Chico |
18 |
Mother Lode |
32 |
San Joaquin County |
|
5 |
Chino Valley |
19 |
North San Diego |
33 |
San Jose |
|
6 |
Contra Costa |
20 |
Napa/Solano |
34 |
Santa Barbara |
|
7 |
Fresno County |
21 |
Northeastern California |
35 |
Santa Clarita |
|
8 |
Glenn County |
22 |
Oakland/Berkeley |
36 |
Shasta Metro |
|
9 |
Greater San Joaquin |
23 |
Oroville |
37 |
Siskiyou County |
|
10 |
Humboldt |
24 |
Placer County |
38 |
Sonoma/Mendocino/Lake |
|
11 |
Kern County |
25 |
Porterville |
39 |
Stanislaus County |
|
12 |
Long Beach |
26 |
Riverside County |
40 |
Ventura County |
|
13 |
Los Angeles (City) |
27 |
S Alameda County |
|
|
|
14 |
Los Angeles County |
28 |
Sacramento County |
|
|
Acknowledgements
We would like to extend our thanks to the Board members, management and staff
of the California Integrated Waste Management Board for their continued help and
assistance in advancing the idea of sharing information on the World Wide Web.
We would also like to acknowledge the efforts of John Sitts for his direct help
and guidance on this project and Chris Allen, Paige Lettington, and Steve
Barnett of the Board’s Information Management Branch for their help with the
placement and maintenance of the GIS data in the Profiles Web site. Additionally
I would like to thank Peter Staklis for the Alameda County graphic.
Darryl L. Petker, P.E.
Senior Technical Waste Management Engineer
Office of Organizational Effectiveness, MS 18
California Integrated Waste Management Board
PO Box 4025
Sacramento 98512-4025
916.341.6704
dpetker@ciwmb.ca.gov