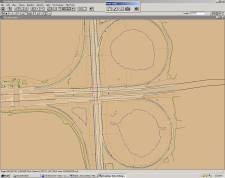
Figure 1, RDIS Application
Abstract: Developed as a pilot project to collect Florida Department of Transportation Roadway Characteristics Inventory (RCI) data. RCI data collection is currently being gathered in the field using traditional methods. This application was developed as an ArcView extension and performs in-house data collection of RCI features directly from the desktop. The application combines the use of a route system, planimetrics, high-resolution aerial photography, and a video log. When compared to the current method of gathering RCI features the new application increases safety and accuracy and reduces data collection time.
BACKGROUND
The Florida Department of Transportation (FDOT) is responsible for keeping current inventory of all its roadways. The Transportation Statistics Office (TSO) is their central clearinghouse and
principal source for highway data collection and analysis. TSO gathers the majority of this data from field personnel in each of their eight districts. This
highway infrastructure data contains the features, characteristics, and usage of highway facilities and services within the state and is contained in the Roadway Characteristics Inventory (RCI) database.
The RCI system is composed of features containing one or more characteristics. For example, feature number 213 is Auxiliary Lanes. This feature contains three characteristics; lane type, number of lanes, and lane width. Each RCI Feature and its corresponding characteristics are listed in the RCI Handbook. The Handbook is distributed to each FDOT district to guide them in gathering the feature information for their roadways and entering the data into the RCI system. RCI data is recorded by a unique roadway identification number and uses a beginning milepost and ending milepost along the roadway to identify the location of the feature.
At the present time, RCI features are gathered by field personnel visiting the roadway site and collecting data using field instruments. Field personnel use distance-measuring instruments to calculate roadway length and mile points where characteristics exist along the roadway.
In January 2001, a task team was formed by the TSO with representatives from all FDOT districts. The team was charged with making improvements to the data collection methods of the RCI system. The team identified three primary goals: Improve Safety, Improve Data Accuracy, and Reduce Data Collection Time.
The task team then challenged each district to develop a pilot project to meet these goals. In response to this challenge the Turnpike District developed an ArcView extension to gather RCI features directly from the desktop. The application was named the Roadway Data Integration System (RDIS), figure 1.
Figure 1, RDIS Application
APPLICATION DESIGN
The Turnpike District looked at the goals defined by the TSO task team and concluded that GIS could meet all the objectives. By developing a desktop application, field personnel would no
longer be required in the field, this would allow for increased safety and would greatly reduce the time spent gathering data. The RCI data would also be more accurate by using the FDOT base map
in the data collection process.
The RDIS pilot application was developed using Avenue and packaged as an ArcView 3.2 extension. Tools were developed that would fully utilize existing resources, which include the FDOT base map route system, high-resolution aerial photography, and a video log on the TSO Department’s intranet site. Using the route system made it possible to obtain the unique roadway identification number and calculate beginning and ending mile points. The aerial photography and video log are used for visual reference. To reach the goal of accuracy, detailed planimetrics were created from existing aerial photography.
A twenty-one mile section of roadway on Florida’s Turnpike was identified as the pilot area. Planimetrics were created for this area at a cost of $10,000. This was the only outside cost associated with this pilot project due to the fact that all work was performed in-house.
For this pilot application seven features were identified that represent a good sample set for data collection:
Feature 212, Through Lanes (Number of Through Roadway Lanes and Through Lane Pavement Surface Width)
Feature 213, Auxiliary Lanes (Auxiliary Lane Type, Number of Auxiliary Lanes, and Width of Auxiliary Lane)
Feature 214, Outside Shoulders (Highway Shoulder Type, Other Highway Shoulder Type, Highway Shoulder Width, and Other Highway Shoulder Width)
Feature 215, Highway Median (Highway Median Width and Highway Median Type)
Feature 219, Inside Shoulders (Inside Shoulder Type, Other Inside Shoulder Type, Inside Shoulder Width, and Other Inside Shoulder Width)
Feature 251, Intersections (Begin Roadway Section Point Name, End Roadway Section Point Name, Intersection Direction, and Intersection Surface Type)
Feature 258, Structures (Box Culvert Structure Number, Bridge Structure Number, Facility Crossing, and Underpass Number)
The data layers included in the RDIS application include a Florida county coverage with detailed shoreline obtained from the Florida Department of Environmental Protection, 0.2 meter resolution aerial photography, the FDOT base map, planimetrics, a mile point data layer created from the FDOT base map, and several existing RCI feature layers created using dynamic segmentation. The data projection was UTM, Zone 17, NAD 83, and the units were meters. The RDIS application opening screen is shown below in figure 2.
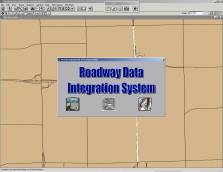
Figure 2, RDIS Application Opening Screen
APPLICATION TOOLS
RDIS has two sets of tools that were developed for the application. The first set uses general tools that aid the user in collecting the RCI features from their desktop. The second set gives the user the ability to actually perform the
RCI data collection from the desktop. The first set of tools are to make it easier for the user to utilize resources already available to them.
The majority of these tools are contained in the RDIS Tools window, figure 3. This window contains several buttons and tools to use during RCI data collection.
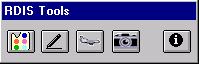
Figure 3, RDIS Tool Window
The Refresh tool,  redraws the planimetric and base map line work available in the view. This allows the user to see all the available line data for a
location. This tool resets the line work to the default colors.
redraws the planimetric and base map line work available in the view. This allows the user to see all the available line data for a
location. This tool resets the line work to the default colors.
The Add RCI Features button  automates the process of dynamic segmentation and adding an event theme. After a user has collected new data they can use this tool to convert the tabular data to a
line or point feature in the view. When the user selects this button a dialog box is displayed allowing the user to select which RCI feature to display, figure 4. The new theme is added to the view and displayed for the user. Predefined legend files are applied making the new line work easily
identifiable in the view.
automates the process of dynamic segmentation and adding an event theme. After a user has collected new data they can use this tool to convert the tabular data to a
line or point feature in the view. When the user selects this button a dialog box is displayed allowing the user to select which RCI feature to display, figure 4. The new theme is added to the view and displayed for the user. Predefined legend files are applied making the new line work easily
identifiable in the view.
Figure 4, Select Tables Window
When the View Aerial button  is selected, all image layers are identified and displayed. By reselecting this tool all image themes are turned off.
Selecting the Identify tool  allows the user to click on a location on the RCI base map and calculate the mile point along the roadway and obtain the roadway
identification number. This information is displayed in an information window, figure 5.
allows the user to click on a location on the RCI base map and calculate the mile point along the roadway and obtain the roadway
identification number. This information is displayed in an information window, figure 5.
Figure 5, Identification Results Window
The user can use the information collected from the Identify tool and use it to display a roadway image. The View Roadway Image tool,  opens Microsoft Internet Explorer and goes to the TSO Video Log Intranet Site, figure 6.
A user can then enter the roadway identification number, mile marker, direction, and select View Roadway Image from the drop-down menu and select Go.
opens Microsoft Internet Explorer and goes to the TSO Video Log Intranet Site, figure 6.
A user can then enter the roadway identification number, mile marker, direction, and select View Roadway Image from the drop-down menu and select Go.
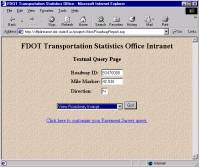
Figure 6, FDOT TSO Web Site
The user is then able to view a roadway image from the selected location, figure 7.
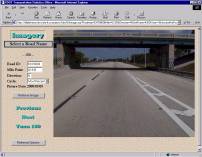
Figure 7, Roadway Image
The Video Log helps the user by providing the ability to view the roadway from ground level.
Another general tool is the Mile Points drop-down menu, figure 8. The Mile Points drop-down menu has two functions. Display Mile Points will show a mile marker in the view and mile number next to the marker as seen in figure 9.
Figure 8, Display Mile Point
Figure 9, Display Mile Point
The Go to Mile Point option allows the user to input a mile point, figure 10, and the view will then zoom to that new location.
Figure 10, Select Mile Point Window
The second set of tools can be accessed from the RCI Features drop-down menu, figure 11.
Figure 11, RCI Features Drop-Down Menu
Although there are different characteristics gathered for each feature, many of the tools were created using the same code structure. Characteristics within each feature must have the roadway identification number and mile point information for the characteristic that is being gathered. This information is obtained by using the Beginning Mile Point tool in the dialog box, figure 12.
Figure 12, Dialog Box Tools
When a user selects the Beginning Mile Point tool and then selects a point along the route system in the view, the roadway and mile point of the selected location are placed into the new data table. If the feature being gathered is a line feature, the Ending Mile Point tool is used to obtain the end point. Other data collection tools include identifying the side of the roadway where the characteristic occurs. This data is entered using the roadside combo box. The number of lanes are entered in a text line and the width of a feature characteristic is obtained by using the measure tool. The measure is obtained from the tool and is rounded to the nearest foot and placed in the feature table. These additional tools can be seen in figure 12.
Other dialog boxes may include Diagram buttons. These buttons allow the user to view documents that may assist in data collection. For example, Feature 213 includes an intersection diagram that helps the user identify the angle of an intersecting roadway, figure 13 shows the Diagram button. After selecting the Diagram button, the diagram is displayed, figure 14.
Figure 13, RDIS Feature 213 Window
Figure 14, Intersection Angle Diagram
A feature may also require the user to identify the Offset of the characteristic, this data is entered through the Offset combo box. There may also be a value that needs to be identified for the characteristic. The value options are given to the user with corresponding checkboxes. After selecting the correct value this information is translated into code and placed in the data table. Examples of these tools are shown in figure 13. An example of a Feature 213 data table is shown in figure 15.
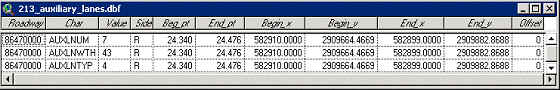
Figure 15, Feature 213 Table
The final data collection tool developed for the RDIS application allows a user to obtain an existing value for a feature and copy the data into the new table. For example, in Feature 258 the user needs to obtain the number of the bridge where they are collecting data. This is done by selecting the Structure tool and clicking on the existing bridge record shown in the view, figure 16. The bridge number is then copied into the new table and placed in the value field.
Figure 16, Feature 258 Table
The search radius of all tools is set to 1 meter, which improves accuracy and is well within the accuracy standards for RCI data collection. In addition to this information, the x/y coordinates are gathered for the selected points. This information is needed if the RCI system is ever changed from mile points to x/y coordinates.
There are four tools that are standard in each data collection window. These tools are there to assist the user in data collection. The Open Table
button  will open the corresponding data table of the current RCI feature.
This allows the user to see the data they have collected. The Delete Record button
will open the corresponding data table of the current RCI feature.
This allows the user to see the data they have collected. The Delete Record button  will
delete the selected record in the table. This allows the user to correct errors that may have occurred
during data collection. The Next button
will
delete the selected record in the table. This allows the user to correct errors that may have occurred
during data collection. The Next button  will
clear all the current selections from the data collection window to prepare for the next record. The final tool is the End button,
will
clear all the current selections from the data collection window to prepare for the next record. The final tool is the End button,  . This will save the data table and close the data collection window
and the data table. Figure 17 shows the Feature 219 window with these additional buttons.
. This will save the data table and close the data collection window
and the data table. Figure 17 shows the Feature 219 window with these additional buttons.
Figure 17, Feature 219 Window
After collecting all the RCI features the user must then transfer the new information into the RCI system. The user must open the Add/Update screen in the RCI system to enter this information, figure 18. The user can select a data table in the RDIS application and open it to editing. By opening the table to editing, the user can select the values from a field and copy that data. The user can then go to the RCI system and paste the data onto the screen. This minimizes manual input; greatly improving accuracy and the data entry process.
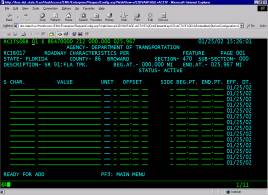
Figure 18, RCI Add/Update Screen
TESTING
After development was complete, an extensive user document was created along with an installation application. The application has been tested within the FDOT Turnpike District and found to
perform well. The accuracy of the data was greatly improved and the time required for data collection was significantly reduced. It was successful within the Turnpike District and is now being
tested by FDOT District 6, Miami-Dade County. This will allow the application to be tested in a more urban area. Results are pending.
CONCLUSIONS
The RDIS application has met all goals identified by the TSO Task Team. Data accuracy has improved, data collection time has been reduced, and the safety of field personnel has been greatly increased by reducing time spent in the field. We
have found that many of the RCI Features can be collected from the desktop. While this application reduces time spent in the field, it will never completely
replace fieldwork. There will be occasions when it is necessary to make the trip to the actual location, but the RDIS application will reduce that number.
The accuracy of the data used for feature collection is of the utmost importance. Therefore, the planimetrics and base map must be accurate and reliable in order for the data collected from it to be useful.
Because this application was created using the Avenue programming language it will not be possible to utilize this extension in ArcView 8.1. FDOT is not anticipated to upgrade to this version in the near future, therefore development of the RDIS application will continue. In the future, however, upgrading the application to be compliant with ArcView 8.1 using Visual Basic will be necessary.
REFERENCES
Florida Department of Transportation, Transportation Statistics Office, 2001, RCI
Features and Characteristics Handbook. Tallahassee, FL.
Florida Department of Transportation, Transportation Statistics Office, 2002, Main page
(http://d9plintranet.dot.state.fl.us/opintranet/statistics/transtat.asp).
ABOUT THE AUTHORS
Christy Dove is a Senior Spatial Data Analyst with URS Corporation consultant to the Turnpike District of the Florida Department of Transportation.
She has been with URS for over 2 years. She earned a B.S. in Geography from the University of Georgia and has been developing GIS applications
for the past 5 years.
Christy Dove
Senior Spatial Data Analyst
Florida Department of Transportation, Turnpike District
PO Box 613069
Ocoee, Florida 34761
(407)532-3999, extension 3811
christy.dove@dot.state.fl.us
Daniel Teaf is the Program Manager of the Spatial Data Analysis Department of Florida’s Turnpike. He has been working with Florida’s Turnpike for 6 years and holds a M.S. in Geography from Florida State University.
Daniel Teaf
Spatial Data Analysis Program Manager
Florida Department of Transportation, Turnpike District
PO Box 613069
Ocoee, Florida 34761
(407)532-3999, extension 3807
daniel.teaf@dot.state.fl.us