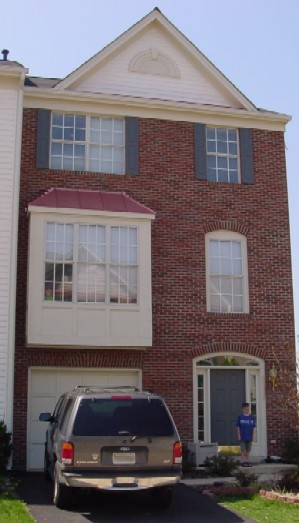
 Nicholas in Front of his House
This project explores the idea of using GIS with a young, challenged audience. This project plans to determine one child's basic strengths and weaknesses, select a set of tasks suitable for that child, work through a sequence of activities starting at a basic level, and see how much progress can be made over a period of three months. The project proposes to use GIS data and imagery of Loudoun County, Virginia, with a child who lives in that county. Future work could involve controlled studies with various exceptionalities, in differing settings, and with different age and ability groups.
As I work with imagery and GIS daily, I have thought more and more about how the tools and challenges that make each day interesting and fun for me might be used to teach young children with learning difficulties. I have a Master’s Degree in Special Education and spent over fifteen years teaching children with and without learning disabilities before becoming interested in computers and GIS, and returning to college for a Master’s Degree in Geography. For the past thirteen years, I have worked in the Remote Sensing/GIS field, largely in the government arena. I feel that bringing the expertise and experience from these two fields together, can result in a powerful new way to teach hard-to-reach children.
This project explores the idea of using GIS with a young, challenged audience. For this effort, I worked a ten-year-old boy who has been diagnosed with learning disabilities. His mother/teacher worked with me to determine Nicholas’s basic strengths and weaknesses, and select a set of educational objectives suitable for him. I related these tasks to GIS activities and worked through them with Nicholas, recording his progress from a basic level to mastery of stated objectives over a period of three months.
I found no specific references in the literature to using GIS to reach learning-disabled children. Research on the use of GIS in the elementary classroom praised it for motivating students to learn about their communities, especially their own neighborhoods, suggesting it be used to augment lessons in history, geography or political science (Couret, 1999) (Baker and Case, 2000). In one effort, elementary teachers from literature and science content areas worked together to present some web-based lessons that took advantage of material available on the Internet to reinforce their lessons. The emphasis here was on using computer/Internet technology in the classroom, rather than being strictly on the use of GIS, but since there is much GIS on the web this might suggest another approach to gaining access to GIS for teaching purposes (Wepner and Tao, 2002). Stallworth and Braun in their review of new GIS software tools for teachers and students believe that using GIS can give students an opportunity for “active participation . . . in a powerful learning environment” (2000). Other studies concluded that while GIS is useful, it is expensive and complex to learn, listing data formatting and conversion as a particular problems (Parmenter and Burns, 2001). According to one study, time is a factor in limiting the use of GIS in the classroom. Teachers don’t have time to learn it or practice it enough to be able to teach it to the students (Baker and Case, 2000). The critical need of children with these types of disabilities is to assume appropriate social roles, express emotion, establish relationships, respond to conflict and engage in self control (Sigman and Capps, 1997), though GIS is not suggested as a means of attaining these goals. Training that facilitates social interaction, whether it is with their elementary school peers (Kamps, et. al., 2002), or with a tutor, is useful to children with social development needs such as those of Nicholas, the child worked with in this study.
Nicholas originally demonstrated a number of behaviors that interfered with his learning. At times he was very distractible, jumping from topic to topic, while at other times, he would settle on a favorite topic (usually unrelated to the task at hand), and stay on it regardless of efforts to get his attention back on the learning activities or he would become fixed on a certain idea and not be able to let it go of it. When I created a CD with some of his work on it for him to take home, and labeled it with that day’s November date, he became very disturbed about this, telling me that his birthday wasn’t in November, that was his little brother’s birthday month and that his was in December. I was unable to make him understand why I had used November on the CD and not December. In another early session, while learning how to modify the symbology used in various map layers, he decided to use a blue color scheme for the roads layer we were working with because “blue is my favorite color”. Each layer after that was colored with blue for the same reason, making it very hard to distinguish between features on the map.
Our general objectives were to capture the child’s attention and motivate him. Motivation is a critical part of any learning and is especially important for children for whom learning and social interaction can be frustrating. His areas in need of improvement were: consistency of emotional behavior, social development, self-control, persistence on task, and self-esteem. To achieve these goals, his mother and I decided that he needed to learn coping strategies to handle frustrating situations, practice them in a controlled environment (one-to-one tutoring), and work from being almost entirely extrinsically motivated (told what to do), to being intrinsically motivated (deciding appropriately for himself). We hoped that his GIS successes would move him in this direction, building his self-esteem along the way.
Overall, we decided to use GIS activities to reduce his distractibility and enable him to spend longer on a given task before giving up, teach him coping strategies such as asking for help or using the “undo” or “go back” buttons to recover from errors so that he could achieve more success, and use his desire to continue with the GIS activities he enjoyed as a means to reduce inappropriate behavior.
As a result of his time spend working with GIS tools and data, Nicholas will move toward the following goals:
It was my original intention to do most of the work with Arc Explorer 2 because it is freely available, and I did install it on Nicholas’ computer at home and show him how to open projects and add and manipulate layers. However, as I learned more and more of the added capabilities of ArcMap and ArcCatalog, we ended up using my software so that we could more easily find and add data, and manipulate symbology and lay out and print maps.
Initially we used the excellent data produced and updated by the Loudoun County Office of Mapping & Geographic Information, because Nicholas and I live in Loudoun County, Virginia, and this enabled us to start with his house and street and work our way to less familiar environs. We used a handheld GPS to collect geographic points on a walk around Nicholas’ neighborhood and added digital photos of spots along the way. We also utilized data from the Esri dataset distributed with ArcGIS and added data layers from the Geography Network to look at China and the world.
We began our tutorial efforts with getting acquainted and introducing the GIS software, expanding in subsequent sessions to experimenting with the spatial environment and learning to think geographically. While behavioral objectives were the primary concern, they were transparently woven into the context of GIS learning, so that the main focus for the child was GIS.
The goal of our initial sessions was to build geographical awareness based on familiar objects and locations. We did this by starting with the concrete and known, and moving toward the increasingly abstract and unknown. Taking Nicholas’ home as a starting point he first identified them:
Nicholas in Front of his House
 Where Is My House?
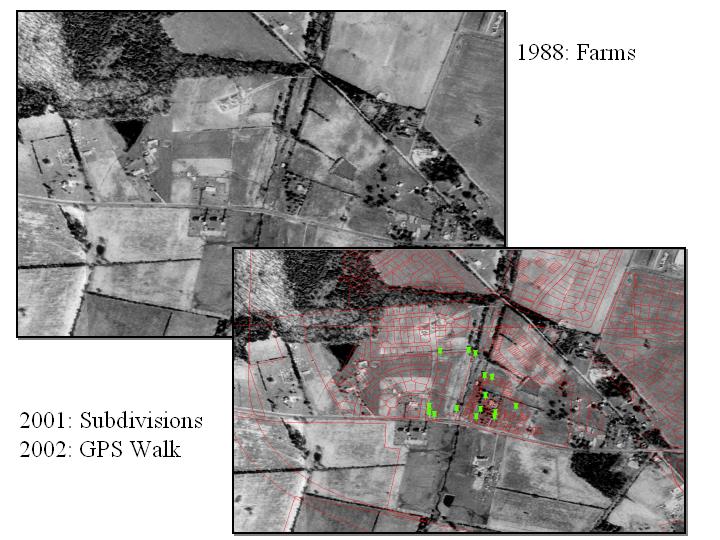
As a next step from looking at Nicholas’ house
and street from the front, we took a walk around his neighborhood using a GPS to
collect coordinate points. We then imported the GPS points into a shapefile and
displayed them over a USGS Orthophoto Quad. Nicholas’ first question was, “Where
is my house?” We discussed the passage of time and the fact that the aerial
photo of his neighborhood had been taken in 1988, five years before he was born
and long before his house had been built in 1999. Loudoun County, Virginia, is
currently the second fastest growing county in the United States, so change has
been rapid. We then used 1999 GIS data created and maintained by the Loudoun
County Mapping and GIS Office, to see the lot boundaries for his neighborhood,
and figured out just where his house would be built. The green pushpins show the
GPS points and the red boundaries are the lot lines in 1999.
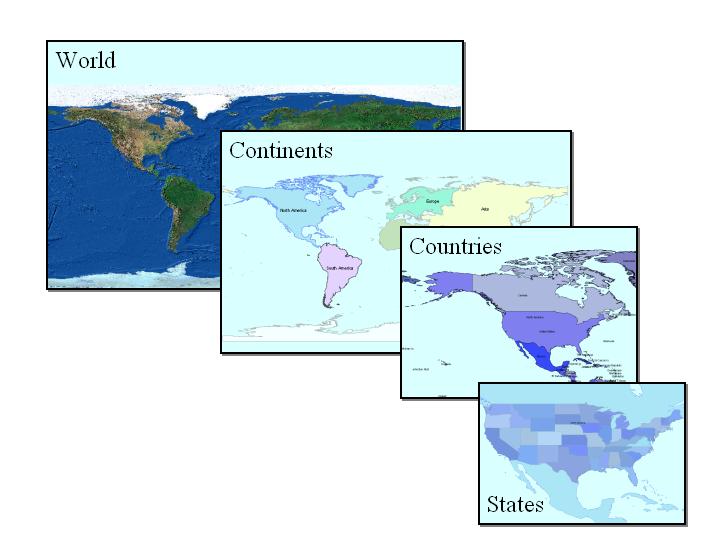
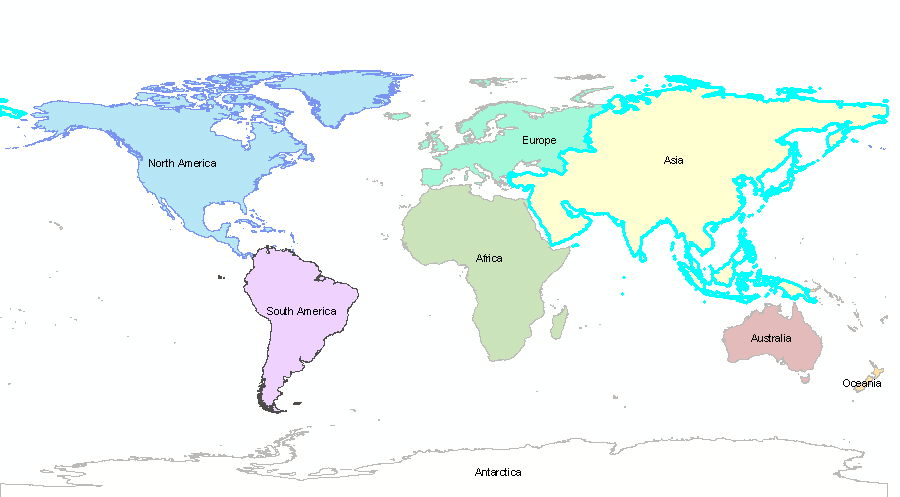
On another day we took the opposite approach,
starting with the whole world, looking at the landmass without any cartographic
notations. Nicholas then added the continents layer and set the Map Tips to the
name of the continent, guessed its name, and moved the cursor over it for
immediate feedback. A similar exercise with the countries and then the states of
the United States was just as much fun.
 From State to County to Neighborhood
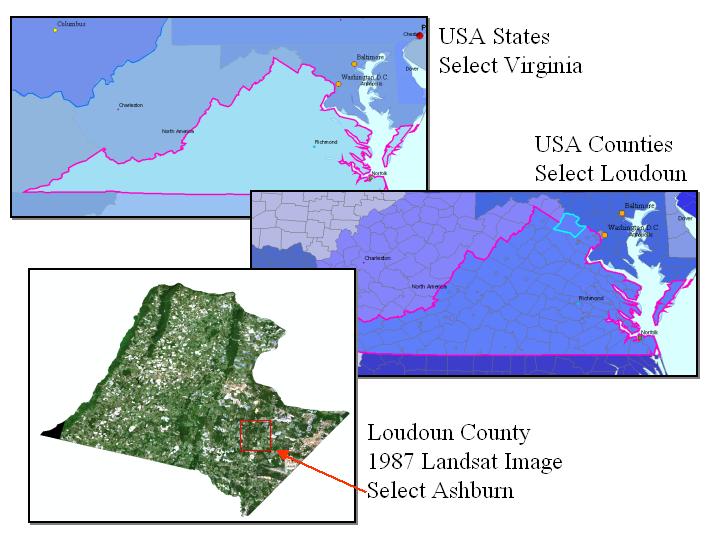
The identification activity held Nicholas’
attention for 15 or 20 minutes. Another variation of this exercise was to look
at the rivers in each country or continent and try to identify them, using the
cursor to identify them as above. We proceeded to the state and then the county
layers, finally zooming in to Loudoun County and displaying a 1987 Landsat image
of the county.
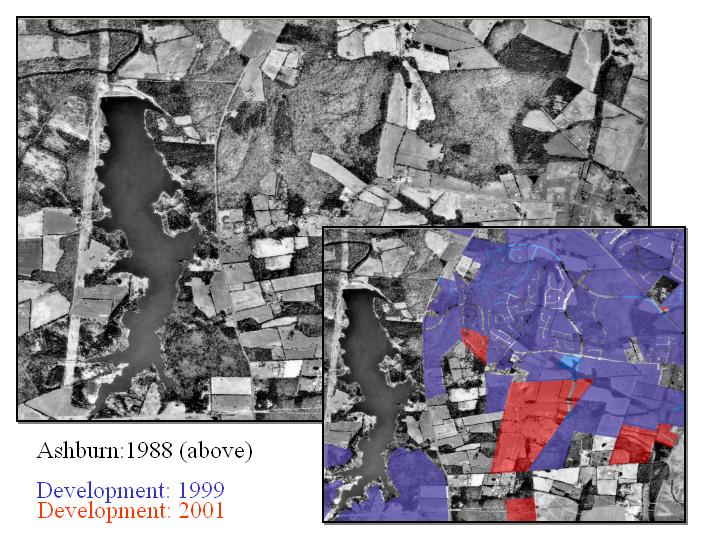
My Changing Neighborhood
The final level of detail was the DOQ (aerial
photo level). We overlaid subdivision polygons from 1999 (blue) and 2001
(additional red areas) to see how much and where our neighborhood had grown as
it changed from farms and forest to suburban development.

Nicholas started out making everything blue
because blue is his favorite color, but eventually graduated to making some
layers blue and others different colors.
 Zoom to Asia: Why doesn’t it?
At the worldview, we could relate the globe and
geographical coordinates to a flat map and known locations. We then related
concepts such as north/south and east/west to latitude and longitude on map and
globe. In the course of the tutoring sessions, Nicholas created and added layers
to many projects in ArcExplorer, ArcView and ArcMap. We queried for countries or
states or counties, and zoomed to them. We selected Asia and zoomed to it. We
still saw the whole world and had to figure out why.
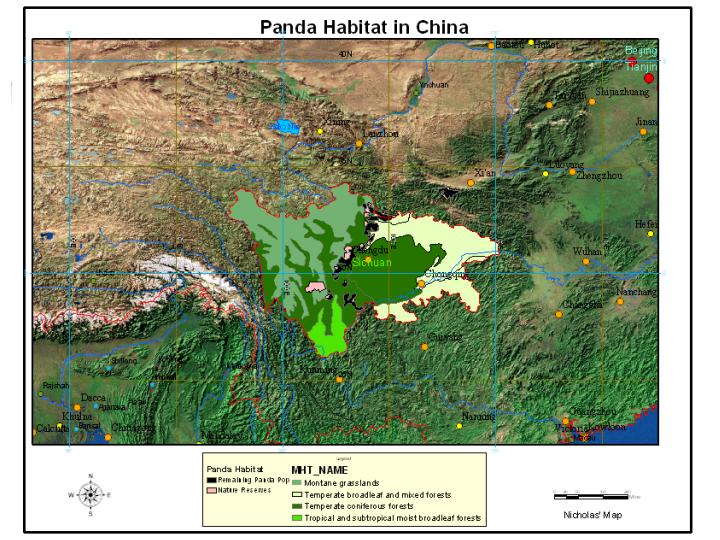 Where Do the Pandas Live?
Once we had thoroughly experimented with the
Loudoun dataset, Nicholas wanted to create a project for China, a country he is
quite knowledgeable about and very interested in. Nicholas used ArcCatalog to
browse through and add the data layers he wanted for China from the Esri Data
Disk and the Geography Network and we also found a map on the Internet showing
the location of Panda habitat. I helped register it to our map and digitize the
areas. Nicholas was then able to add the panda habitat layer to his map and set
the symbology. He made a number of maps and added them each week to a notebook
to show his family.
Results and Discussion
The GIS activities were definitely a positive influence for Nicholas. His time on task for working with a GIS activity extended from 5 or 10 minutes to an hour and 19 minutes at one point. He especially enjoyed the GPS activity and using his new skills with GIS to map the panda habitat in China.
He exercised his reading and spelling skills sounding out the names of countries and states, showed me the rivers that flow into the Mississippi, and identified the source of the Nile River and which way it flowed. He spent some time working with longitude and latitude, especially in connection with the GPS activities, but needs more practice with it before he really understands how it works. It would be nice to add elevations and shaded relief and discuss mountain ranges and look at addresses in Loudoun County in the future.
Over time, Nicholas grew very proficient with the mouse and learned to identify and use all the key ArcMap buttons, making sure to save often. He also mastered the pan and zoom techniques, especially enjoying the “go back” button. He used the identify button to list the attributes of a feature, and was able with to query for something he was interested in in a layer. When we looked for and grabbed layers from the web, he learned to exercise patience, as do we all.
When things went wrong, Nicholas was able to delete the offending layer or project and either add it again or recreate the project. He also saved his work frequently and asked for help when things got confusing. He discovered that there is more than one correct way to do something.
Now that he has some basic familiarity with GIS and how it works, I look forward to focusing more on the actual project side of the work and showing him how to answer questions using GIS. I believe Nicholas can learn to georeference image layers and digitize information from them. We also plan to learn more about some basic projections. Measuring distances from points of interest and getting more practice with lines of latitude and longitude on map and globe will also be on the agenda.
Nicholas achieved most of our initial goals during the months we worked together on GIS. He significantly increased his time on task, learned to refocus his attention from miscellaneous topics to the task at hand, “changed his mind,” based on new information, and used more acceptable coping strategies when faced with frustrations. He has recovered from failures and increased in self-esteem, as his personal successes have mounted. He has learned to enjoy making maps and being the map authority at his house.
GIS is not a cure-all for the problems associated with learning disabilities, but it can be another effective tool to be used in motivating and teaching hard-to-reach learners. GIS doesn’t have to be complicated or expensive. With more and more data available free on the web, and GIS maps and tools accessible via the Internet (with a fast connection), I believe that teachers and learners alike will increasingly see it as a fascinating new way to learn about the earth. If teachers don’t have expertise in GIS, or the time to learn it, the thousands of GIS professionals attending this conference who do have that expertise might consider volunteering to tutor a learning disabled child an hour or two a week. I found the experience very satisfying and feel that knowledge of GIS and a desire to help children are the only firm requirements.
It is my hope that other GIS professionals will choose to do volunteer work with LD children and that future work in this area will include controlled studies.
Baker, Thomas R., and Steven B. Case. (2002) Let GIS Be Your Guide, The Science Teacher, October, 24-26.
Couret, Christina, (1999) Schools Add GIS to Curriculum. The American City & Country, 114, 2, 46.
Kamps, Debra, et. al., (2002) Peer Training to Facilitate Social Interaction for Elementary Students With Autism and Their Peers. Exceptional Children, 68, 173-188.
Meyer, Judith W., Jon Butterick, Michael Olkin, and George Zack, (1999) GIS in the K-13 Curriculum: A Cautionary Note. Professional Geographer, 51, 4, 571-578.
Parmenter, Barbara and Mary Burns. (2001) GIS in the Classroom, Learning and Leading with Technology, 28, 4,10-16.
Sigman, Marian and Lisa Capps. Children With Autism: A Developmental Perspective: Cambridge, MA: Harvard University Press, 1997.
Stallworth, Corsandra and Joseph A. Braun Jr., (2000) GIS Programs: Geography Tools for Teachers and Students. Social Education, Arlington, 63, 3, 161-164.
Wepner, Shelley B., and Liqing Tao. (2002) From Master Teacher to Master Novice: Shifting Responsibilities in Technology-Infused Classrooms, The Reading Teacher, 55, 7, 642-651.
Linda Tischer
Image Processing/GIS
Northrop Grumman, Inc./TASC
lindatischer@hotmail.com