Geographic Information System (GIS) is increasingly used in many industries due to the recent improvements in desktop, workstation, and server processing capabilities. The researchers in the field of hydrology are cognizant of the benefits of GIS applications towards hydrology and hydrological modelling. The application of GIS in the field of hydrology has enabled the planners of WRPs to address various conflicting issues by taking into consideration the spatial dimension and temporal variations on a regional scale.
Hydrological and WRPs will always present a realm of issues both technical and non-technical. The technical issues include but are not limited to upstream watershed management, downstream flow management, loss of reservoir capacity, and even dam stability. The non-technical issues include but are not limited to ecological, environmental, socio-economic problems, and other political, religious, legal, and international disputes (M. Ravichandran and N. Indrasenan, 2001).
Modelling surface and subsurface flow using a GIS can be done with a comprehensive setting for both surface and groundwater scenario instead of individual models. When the transport of pollutants and contaminants is considered, the scenario is very complicated. When the pollutants are carried away by runoff, the groundwater specialists feel relieved, as the pollutant is to be considered as a part of the river. When the pollutants go into the groundwater, the hydrologists feel that they are not affected. Instead both the hydrologists and the groundwater specialists should identify ways to reduce the contaminant content in a comprehensive manner. GIS based hydrological project models can be effectively used to resolve such conflicting issues (David R. Maidment, 1993).
The presence of an integrated and a reliable GIS database with quality control to maintain positional, attribute, and logical accuracies are needed to provide quality data to plan effective WRPs. When such accuracy of data is maintained, the data can be considered to be complete in all respects and can be used for planning purposes (Sindre Langaas, 2001).
The GIS based integrated database can help the planners make perpetual decisions for better engineering and even non-engineering decisions to ensure the success of the projects.
GIS that can be used to integrate, interact, visualize, and resolve the complexities of hydrological problems is a promising idea and should be actively pursued to minimize the problems presented and enhance the benefits of the projects (K. Fedra, 1993).
There is a need for the development of not only integrated database but also hydrological oriented GIS database, as there may be many watershed parameters and ill-posed nature of watersheds of river basins unique to modelling of WRPs. Further, the hydrologic cycle with its associated activities is a random one and any hydrological based GIS with the embedding of stochastic analysis will serve as a good WRP model.
A preliminary study in South Africa identified GIS as a viable tool to mitigate issues arising out of complex geopolitical, socio-political, and international agreement bound water-sharing problem to optimise the water utilization (J. J. Oliver and D. R. McPherson, 1993).
GIS was used for developing a hydrological model for River Nile to address the issues such as water demand, geopolitical, and socio-political disputes and litigation. It was found that the spatial orientation was well addressed by using commercial GIS software such as ArcView. The study further highlighted the fact that with the advent of multimedia, hypertext, development in computer science in the fields of expert systems, and decision support systems will enhance the applications of GIS particularly to hydrological modelling (John Schaake, Robert Ragan, and Edward J. VanBlargan, 1993).
GIS can provide a framework for the integration of data from different and disparate data sources. This will enable the planners to integrate data from satellite imagery, aerial photographs, historical map, raster format data, fine DEM grids, and other point data from hydrological and environment monitoring agencies (Angela Gurnell and David Montgomery, 1998).
The GIS can permit the modelling of the data from varied sources highlighting their importance in an intuitive form otherwise unavailable. The research also warns hydrologists of potential error amplifications, which would be hard to detect by the use of the GIS framework (Angel Gurnell and David Montgomery, 1998).
Integrating complex systems such as ARC/INFO GIS, a product of Environmental Systems Research Institute Inc.(Esri) and Hydrological Modelling Systems (HMS) was found to be useful in improving water resources planning, land management to minimize pollution from agricultural land and informal settlements. This helped the planners in effectively translating the spatial features into meaningful hydrological parameters (Stefan W. Kienzle, 1993).
Another study found that the absence of temporal variations in GIS tools presented an incomplete modelling scenario and the research concluded that future GIS tools would allow temporal variations in GIS modelling of hydrological modelling (M. Brilly, M. Smith, and A. Vidmar, 1993).
A recent research concluded that the implementation of GIS modelling to solve hydrological problems will suffer an inevitable paradigm shift. The study further indicated that the paradigm shift would equip researchers and planners with new computational models and implementation strategies that are platform independent to perform better modelling (D. Z. Sui and R. C. Maggio, 1999).
GIS and Landsat Thematic Mapper (TM) were used in a research that concluded with a correlation of human presence and their interaction with the environment and its relevance to a watershed were found in Kickapoo watershed and two other watersheds (Tracy K. Kuczenski et. al., 2000).
GIS as a tool will soon be the preferred environment for hydrological modelling as more GIS vendors are adapting to open standards for data models and customisation using different programming languages and tools (Neil Stuart and Christopher Stocks, 1993).
From the above studies, it can be seen that GIS, as a tool is finding increasing use in modelling the hydrological, environmental, socio-economic, political, and other issues of WRPs.
In all the above studies, the researchers could have used data from disparate sources and some of them might be in proprietary formats.
If data such as elevation, topography, hydrological flow characteristics, ecological disturbance, foliage, and a variety of demographic information can be stored in a database with geo-codes as their primary keys, the resulting database will be reliable, consistent and with a high level of data integrity.
If the database is periodically updated by doing surveys and other studies, and periodically updated by the departments, the resulting database will be a robust and a reliable one.
Such a database can be used for planning WRPs to optimise the benefits and reduce the negative outcomes of the projects.
Raw data collected and geo-coded were transferred into shapefiles using different GIS tool and was shared on the web server. Data in the form of arc files and polygon files of the rivers, lakes, and river basins for the entire state of South Carolina and the Richland County were used in this study.
The data in the form of shapefiles about the different rivers, water bodies, and different watersheds (arcs and polygons) are integrated into a map document of Esri’s ArcView 8.x (SP1 – service pack 1). The data was downloaded from the university server to the author’s workstation for further studies.
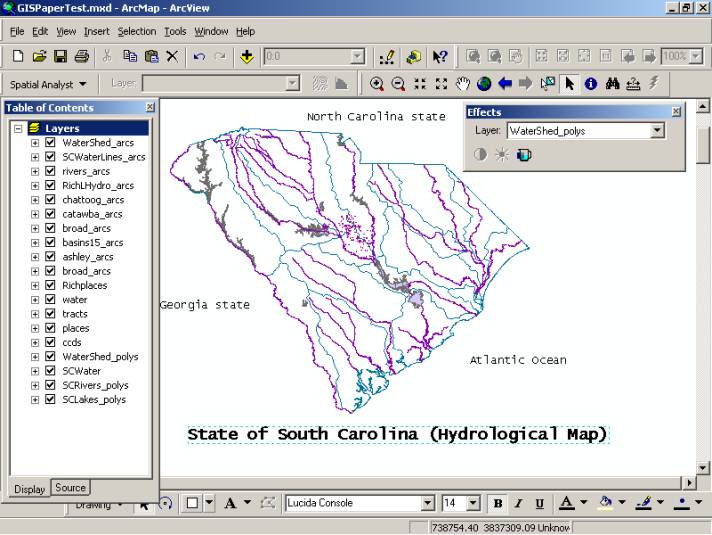
A simple map of the South Carolina (SC) with the neighbouring states and the Atlantic Ocean is shown in figure 1 as obtained from GIS mapping capability of the software.
On the left side of this figure 1 shape files were loaded into the map document as shown in the table of contents. These shapefiles were present in the hard drive of the workstation of the author.
Although, the watershed arcs and polygon shape files were loaded in the table of contents, they were made 100 percent transparent to display the different water bodies of the South Carolina. The feature of making layers selectively transparent in the GIS tool enables the users to superimpose one or more layers on an existing theme (layer) to study the relationships.
Normally a watershed can be ably represented by a group of systematic gauging stations. In developing countries, most of the watersheds do not present this proposition. But then, even in the absence of proper gauging, GIS can represent and support prediction of flood hydrographs on ungauged watersheds. In essence, GIS with a total hydrological orientation, can ably address the “ill-posed” nature of watersheds. This is because GIS has the capability of computing a number of watershed and hydrological parameters.
The watersheds of South Carolina were made visible by decreasing the transparency of the arcs (in figure 2) and polygons (in figure 3).
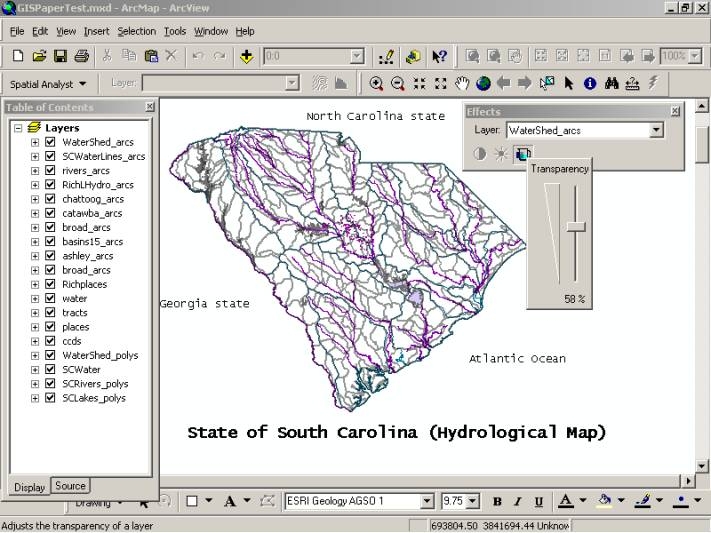
Polygons are shaded to the level of transparency selected and the colour assigned to the appropriate themes.
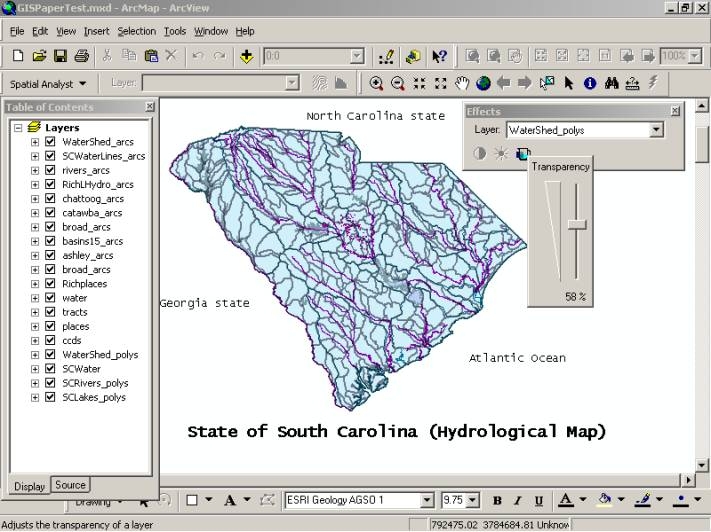
Each of the layers present on the ‘Table of Contents’ can be selected in the ‘effects’ window – ‘layer’ dropdown to adjust the transparency level depending on the analyses to be done. This significantly enhances the user’s ability to superimpose more than one layer to make relevant engineering or non-technical analyses of the effects of WRPs.
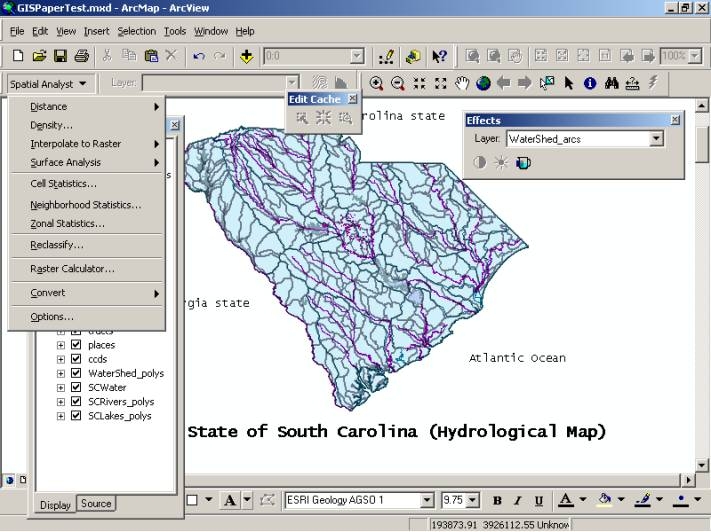
The software tool (ArcGIS 8.1) used in this study was capable of additional spatial analyses. Figure 4 shows the different types of spatial analyses functions available for the user.
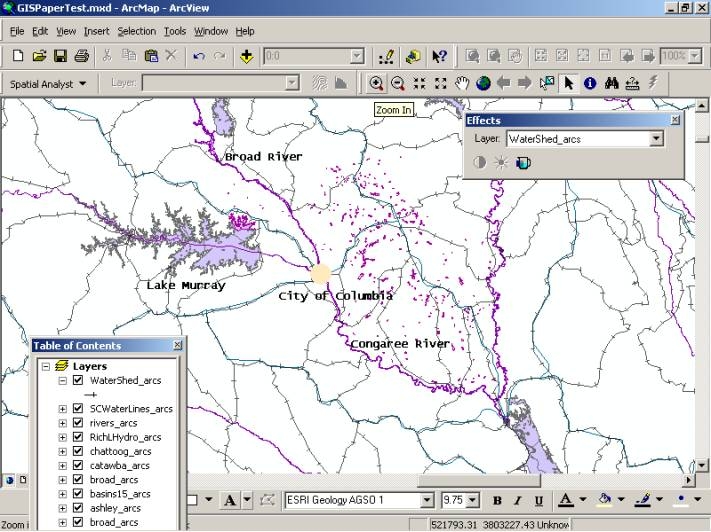
Since all the data was loaded for the state of South Carolina, the region in the central portion of the state was used for analysis. A closer view (zoom in) of the central portion of the map shows the capital city of Columbia and the water bodies around it. The watershed arcs are shown in the form of ‘railway line’ to distinguish them other rivers and boundaries as in figure 5.
The data labels were enabled for the watershed polygons to be identified. The software allows the user to display other attributes.
An inquiry was done on the watershed east of Columbia using the query/information tool of the software.
In this case, properties for the watershed area number 225898500 (east of Columbia city) were queried to be displayed as shown in the figure 6. The number used to indicate the area is the actual area occupied by the watershed in fps units. The data tables that store the watershed polygon use the FID (as shown in figure 5) as the primary key.
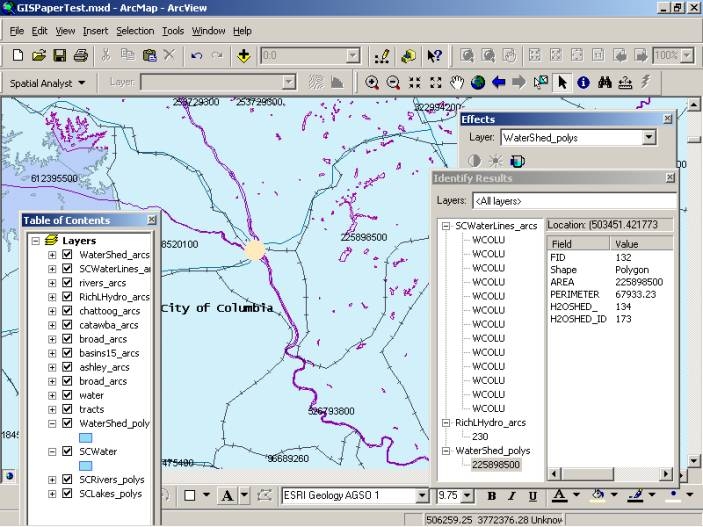
Additional information about the different rivers flowing (river # 230) and other water bodies are present in the ‘Identify Results’ window. Since all the information is geo-coded, the relevant information about the water bodies can be visually presented to the user.
Additional hydrological analyses such as flood hydrographs can also be done; they are beyond the scope to this study. More analyses can be accomplished by the hydrological modelling extension; that was not presently available for this release when the study was conducted.
The competing GIS tools in the market will have nearly all of the features of the software used in this study and sometimes they might be presented in propriety ways. In any case, the spatial analyses features provided can significantly assist the planners and designers in their analyses.
The observations and the inferences that can be made from this study are presented in this section.
The software used in this study was developed by one of the leaders in the GIS software industry. With competition from other vendors and the company’s initiative to be among the top few vendors benefits, it greatly benefits the users and the planners to get the best software at all times.
The data used in this study was residing in a local database present in the author’s workstation. Although, the contents of the database are limited, it enabled the users to know about the different rivers flowing through South Carolina and the watershed area of interest. It also provides additional information about the particular watershed.
The location of the watershed used in this case study is yet another important aspect. The fact that it was east of the capital city of Columbia was discernible easily from the map. It would have taken a longer time to sift through the geo-codes and coordinates to determine the location with reference to Columbia on traditional relational database management systems (RDBMS).
Further, the data used in the research was made available by the University of South Carolina abiding the regulations and the restrictions on the type of data that can be shared for off-campus studies and research work.
If all the data without any restriction were made available, the extent of information available for analyses would be significant and commendable.
If a reliable database with all relevant and updated information, is available to the planners and the engineers will enable them to do proper analyses at the planning and design stage of any water resources projects.
Additional information such as forest cover, land usage, housing and commercial site locations, and sensitive defence information, when superimposed as layers to the existing map document will enable the planners to determine the nature and the extent of damage of a proposed water resource project or an existing water resource project and identify measures to mitigate them.
The hydrological modelling extension (software) was not ready from the vendor (beta testing phase) at the time this paper was drafted. Such an extension will enable the planners and designers to perform detailed hydrological analyses to determine the effects of the water resources project and identify ways to mitigate and minimize the damage to the ecosystem and surroundings.
Additional hydrological models developed in procedural languages such as C/C++ and other developer tools such as Visual Basic, when used along with the hydrological extensions will greatly enable the planners to develop customized solutions to suit the topology and the field conditions without being limited by the capability of the software.
The data for a developed country such as the USA was available online from a university server for the planners and other researchers to use. Such a data sharing might not be available right now in most developing countries. The research organizations and universities in developing countries should collect data to make it available for the public and planning officials.
An integrated geo-coded database can be constructed by collecting geo-data using surveying, photogrammetry, satellite imagery, and other means and by integrating them into a spatial database based on sound database construction principles. Existing field data can be also integrated into the database by effective means (Peter A. Burrough and Rachael A. McDonnell 1998).
The geo-coded database should be updated on a continuous basis by field surveys, remote sensing, or by other techniques where the information is dynamically changing.
Data collected by different governmental agencies and other organizations can be efficiently shared using GIS industry standards such as XML (eXtensible mark-up language) to make data sharing more convenient. This will ensure that information pertaining to different layers of the same map have more accurate information to enable more accurate analyses in the design stage.
Different GIS companies, governmental agencies and other non-profit research organizations can take the initiative to develop industry XML messages to transfer data among one another. The concept of data sharing from business to business (B2B) can serve as a starting point or guideline for this effort.
When this paper was drafted, different agencies in the USA were forming an organization to develop standards for a GML (geocode mark-up language) based on the principles of XML.
By this effort, data can be exchanged among organizations that use different formats without a need to redesign their legacy system (OpenGIS Consortium 2001).
Using a GIS based database was hastening the pace of decision making without sacrificing the quality of the decision made.
With the advent of 64-bit windows processing and UNIX based system already offering the 64-bit processing capabilities, geo-data retrieval and geo-based data processing will be more beneficial for the planners and the designers.
Greater processing and more flexible operations might be possible with 64-bit processing which are currently not available in 32-bit processing (Rany Premont 2001).
When more data is available from different sources is integrated into a database, it can serve as a data repository from which the planners can generate reports to determine the optimum solution and address the different problems faced in the planning stages of a water resources project.
Commercially available database engines such as Oracle and Informix have an SDE (spatial data extender) that enables the geo-data to communicate with the RDBMS (relation database management systems); it can significantly enhance the reliability of data in the database (Joseph R. Francica 2001).
A geo-coded database built on sound entity and data relationships will benefit the planners and designers in designing the WRPs for an optimised benefit and a minimized loss scenario.
GIS as a reliable and integrated database with proper geo-coded data will benefit the planners and the engineers to make sound engineering decisions to avert disasters arising due to WRPs without a support of GIS. Not only space variations but also space-time variations, settling demographical disputes in WRPs and easy handling of constraints of the projects are unique in GIS based hydrological models. Most WRPs suffer due to insufficiency of data. A good project can therefore be envisaged only with embedding of integrated GIS database.
The authors would like to extend their sincere gratitude to M/s. Esri for donating their ArcView 8.1 and its additional GEOSpatial Analyst module for this study. The authors appreciate the Geographic Information Systems division of the College of Liberal Arts and Sciences in the University of South Carolina for making the data available on the Internet and the technical advise provided by their staff members, especially, Mr. Lynn Shirley. Thanks are due to the family members for their patience and support when the study was conducted and the paper was drafted.
D. Z. Sui and R. C. Maggio, Integrating GIS with Hydrological Modeling: Practices, Problems, and Prospects. Computer, Environment and Urban Systems, 23(1): 33-51 (1999).
David R. Maidment. Environmental Modelling with GIS, edited by Michael F. GoodChild, Bradley O. Parks, and Louis T. Steyaert, Oxford University Press, New York. pp 147-169 (1993).
Fedra, K., Models, GIS and Expert Systems: Integrated Water Resources Method. HydroGIS 93: Application of Geographic Information Systems in Hydrology and Water Resources (Proceedings of the Vienna Conference). Vienna, Austria, pp 297-308 (1993).
J. J. Oliver and D. R. McPherson, Application of GIS to Water Management in a Developing Region. HydroGIS 93: Application of Geographic Information Systems in Hydrology and Water Resources (Proceedings of the Vienna Conference). Vienna, Austria, pp 417-426 (1993).
John C. Schaake, Robert M. Ragan, and Edward J. VanBlargan, GIS Structure for the Nile Rive Forecast Project. HydroGIS 93: Application of Geographic Information Systems in Hydrology and Water Resources (Proceedings of the Vienna Conference). Vienna, Austria, pp 427-431 (1993).
Joseph R. Francica, Large Spatial Databases. Business Geographics, January/February 2001.
M. Brilly, M. Smith, and A. Vidmar, Spatially Oriented Surface Water Hydrological Modelling and GIS. HydroGIS 93: Application of Geographic Information Systems in Hydrology and Water Resources (Proceedings of the Vienna Conference). Vienna, Austria, pp 547-557 (1993).
M. Ravichandran and N. Indrasenan, Environmental Aspects in Water Resources Project Planning, submitted for publication to Water International, Southern Illinois University, Carbondale, IL.
Neil Stuart and Christopher Stocks, Hydrological Modelling Within GIS: an Integrated Approach. HydroGIS 93: Application of Geographic Information Systems in Hydrology and Water Resources (Proceedings of the Vienna Conference). Vienna, Austria, pp 319-329 (1993).
OpenGIS Consortium. Geographic Markup Language (GML) 2.0, OpenGIS Implementation Specification, http://www.opengis.net/gml/01-029/GML2.html, USA, (2001).
Peter A. Burrough and Rachael A. McDonnell. Principles of Geographical Information Systems, Oxford University Press, Oxford, England (1998).
Randy Premont. Impact of 64-bit Processing, http://www.compaq.com/solutions/onlinelab/whitepaper/guest06.html, Compaq Computer’s website, California, USA, 2001.
Sindre Langaas, Cartographical Data and Data Quality Issues. UNEP/GRID Arendal, Dept. of Systems Ecology, Stockholm University, Stockholm, Sweden, 2001.
Stefan W Kienzle, Application of a GIS for Simulating Hydrological Responses in Developing Regions. HydroGIS 93: Application of Geographic Information Systems in Hydrology and Water Resources (Proceedings of the Vienna Conference). Vienna, Austria, pp 309-318 (1993).
Tracy K. Kuczenski, Donald R. Field, Paul R. Voss, Volker C. Radeloff, and Alice E. Hagen, Integrating Demographic and Landsat (TM) Data at a Watershed Scale. Journal of The American Water Resources, American Water Resources Association, 36(1): 215-228 (2000).
USGS website, Geographical Information Systems, http://www.usgs.gov/research/gis/title.html, U.S. Department of the Interior, U.S. Geological Survey, Reston, VA, USA, (April 2001).