Jon Brandt, Railroad Commission of Texas, Surface Mining and Reclamation Division
During the week of March 19 to March 23, 2001, a radiation survey was conducted by the Conrad Blucher Institute and the Railroad Commission of Texas at the abandoned Kopplin uranium mine. The project was part of an independent study and as part of collaboration between the Conrad Blucher Institute and the Railroad Commission of Texas. The presence of radionuclide contamination was confirmed and characterized using a gamma ray counter and Geographic Information Systems (GIS) mapping. The mapping included the identification of all sampled locations, the graphic display of the intensity of the point gamma ray fields, and a contour map displaying gamma emission gradients throughout the site. The maps allowed for the identification of general areas of above background radiation levels possibly requiring future remediation and historical features of the mining operation such as the approximate location of the former ore pad. An additional benefit of the study was the testing of GIS applications to aid in survey and mapping methodologies. The use of United States Geological Survey (USGS) Digital Ortho Quarter Quadrangle (DOQQ) files in particular provided a suitable base map for the entire project and facilitated navigation at the site during data collection. Other features of the methodology selected for the project, such as the collection of these data in Universal Transverse Mercator (UTM) coordinates, will also facilitate the combination of the data with future data into seamless GIS databases.
Uranium and its associated trace elements and radionuclides are ubiquitous in the South Texas Tertiary environment (Bartlett, 1997). Surface mining of this resource from the 1960s through the early 1980s in at least 60 locations (USEPA, 1998) has left an extensive anthropological footprint, both physically and radiochemically, around the mines in the lower Nueces and San Antonio river basins. Reclamation of mining sites initiated after 1975 has been under the regulatory authority of the Railroad Commission of Texas. Mines that were active before the Texas Surface Mining Act of 1975 was enacted, and never reclaimed, are now considered abandoned (Waggoner et al., 1994). The Abandoned Mine Land Section of the RCT is currently reclaiming these pre-law uranium mines with funding from the federal government.
The first step in the reclamation of an abandoned uranium surface mine is a preliminary radiation survey to estimate the extent of contamination. During the week of May 19, 2000, a systematic gamma radiation survey was conducted at the abandoned Kopplin uranium mine in the Ray Point area of Live Oak County, Texas, under the supervision of Mr. Jon Brandt of the Railroad Commission of Texas (RCT). Mr. Brandt routinely performs such surveys as a preliminary investigation of the contaminated areas around mines slated for possible reclamation. Participation of the authors Beaman and Tissot was graciously allowed by the RCT as a preliminary cooperative effort by the RCT and the Conrad Blucher Institute (CBI), to examine natural and technologically enhanced radioactivity in the South Texas environment.
The Geographic Information Systems (GIS) mapping results presented in Maps 1-3 of this report were constructed by Mr. Beaman as part of a Directed Independent Study, in the partial fulfillment of graduate studies in Environmental Science at Texas A&M University-Corpus Christi (TAMU-CC).
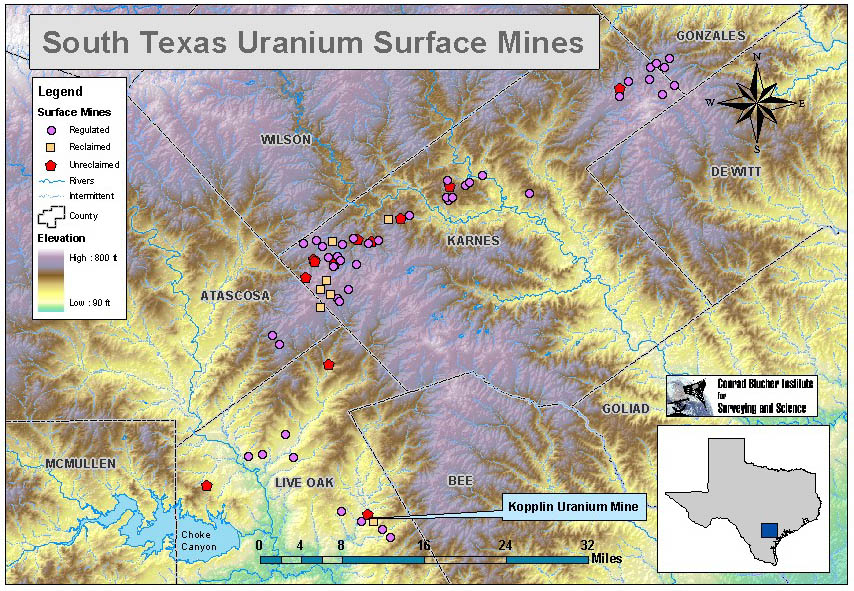
Located in the Nueces River watershed, the Kopplin uranium mine is situated in the Miocene age Oakville Sandstone along a listric fault within the Ray Point district of Live Oak County, Texas (see Map 1). Listric or "growth" faulting is common in basin filling sedimentation such as the Gulf of Mexico. Generally, the slumping of sediments towards the basin produces a fault plane that curves gently basinward. The Miocene-age Oakville Sandstone was deposited by several sand-rich paleostreams that ran across a broad coastal plain similar to the modern Gulf Coast (Galloway, 1982). The source of uranium (U) is the underlying volcanic ash of the Catahoula Formation. Oxidized U6+ entering the Oakville Sandstone in groundwater recharge was reduced and precipitated as U4+ by reducing waters rising along the fault (Henry et al., 1982). Map 2 shows the fault location relative to the mine. Photo 2 depicts the growth fault in the pit wall.
Surface core samples were taken by Dr. Tissot, who will perform radiometric spectroscopic analyses and correlate the gamma ray spectra with the field measurements. These results will be presented in a subsequent report.
Map 1. South Texas Uranium Surface Mines
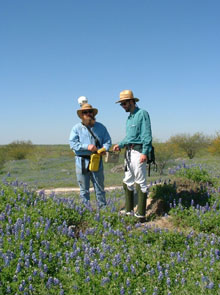
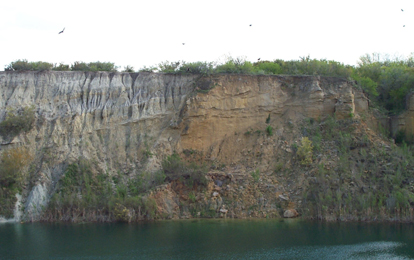
Photo 1. Field Methods Photo 2. Growth Fault in Pit Wall
Radiation levels were measured using a Ludlum Model 12s scintillometer (calibrated to Cesium 137) measuring micro-Roentgens per hour (�-R/h), with an accuracy of plus or minus 10 %. Point locations and intensities were recorded with a Trimble ProXRS global positioning system that included a TSC1 Datalogger (see Photo 1). Sub-meter horizontal accuracy was achieved with real-time differential correction.
Point measurements (1270) were taken over an area of approximately 300,000 square meters surrounding the pit lake. These point values and locations are depicted on Map 2. A minimum grid sampling distance of 30 meters was the goal. Due to complex terrain and dense vegetation, the actual sampling intervals were variable. The sampling interval was denser than the goal in areas with high gamma radiation emissions. This increase in point density was required to determine the areal extent of contamination. Conversely, areas of lower emissions were sampled at greater intervals until a nominal value of 9 �-R/h was reached.
In addition to the �-R survey, a set of soil samples was collected from the site. Their locations are indicated in Map 2. While �-R surveys give a good indication of the surficial radionuclide concentration (Moxham, 1964), the daily, seasonally and meteorologically influenced fluctuations in radon emanation from the soils can substantially influence the measurements (Grasty, 1997; Ball, 1991; Jonsson, 1999; and Winkler, 2001). The collected soil samples will be analyzed by gamma ray spectroscopy in a low background High Purity Germanium-based counting station. The analysis will yield the actual radionuclide concentrations of the sampled soils. The results will be correlated with the �-R survey measurements at a later date. Other factors such as the importance of radon emanation from deeper soil layers could be investigated by long-term radon emanation measurements. The combination of the different measurement techniques is likely necessary to fully characterize environments such decommissioned uranium mines.
The base maps used for this survey are 1-meter resolution Digital Ortho Quarter Quadrangles (DOQQs) published by the U.S. Geological Survey (USGS) and supplied by the Texas Natural Resources Information Service (TNRIS), who kindly provided the data at an educational discount of 50%. The DOQQs are digital images of aerial photographs without distortions caused by camera angle and terrain slope. DOQQs combine the image characteristics of color infrared photography with the geometric qualities of a map and are distributed relative to USGS topographic quadrangles in the Universal Transverse Mercator (UTM) grid coordinate system, (North American Datum of 1983 [NAD83]). The images used for the production of the DOQQs were obtained from National Aerial Photography Program during 1995-98. The horizontal accuracy of these DOQQ files is 33 feet at a scale of 1:12,000, or approximately twice that of a standard USGS 7.5 minute topoquad.
To facilitate the use of the DOQQs as a base map, point data were collected in UTM Zone 14R coordinates (the horizontal datum was NAD83 and all distance units were meters).
All point values of gamma radiation emissions and soil/spoil samples collected were exported from the native Trimble file format into ArcView 3.2a GIS software. Locations are displayed over line files drawn from the USGS DOQQ files to illustrate their distribution relative to the historical mining activity and present land use of the area (see Map 2). It should be noted that without a physical examination of the site it would not have been possible to completely distinguish the topographical features such as the high wall or spoil piles from the DOQQs. These generalizations are intended to present the character of the terrain around the site and its relationship to the distribution of contamination and not to quantify the features depicted.
Radiation level classifications of 9-13 �-R/h (apparent background & clean spoil), 14-25 (�-R/h (disturbed/slightly radioactive spoil materials), and 26-50 �-R/h (apparent threshold where cleanup of materials may be needed) were chosen based upon RCT protocol. The classifications above 50 �-R/hr were chosen to best depict variations in radionuclide contamination observed. Different colors and graduated symbols are both used to aid in interpretation. These classification values are also used for the contours of Map 3.
Some inferences are possible from the point data shown on Map 2. The approximate area of the former ore pad was the most obvious feature identified. Mr. Kopplin, the owner of the property containing the mine site, also confirmed the general location of the former ore pad during the survey. Mr. Kopplin indicated as well that the dam around the stock pond might be contaminated. This was verified during the survey. Close scrutiny of the point data also reveals a plume of contamination migrating down slope from the former ore pad towards the stock pond.
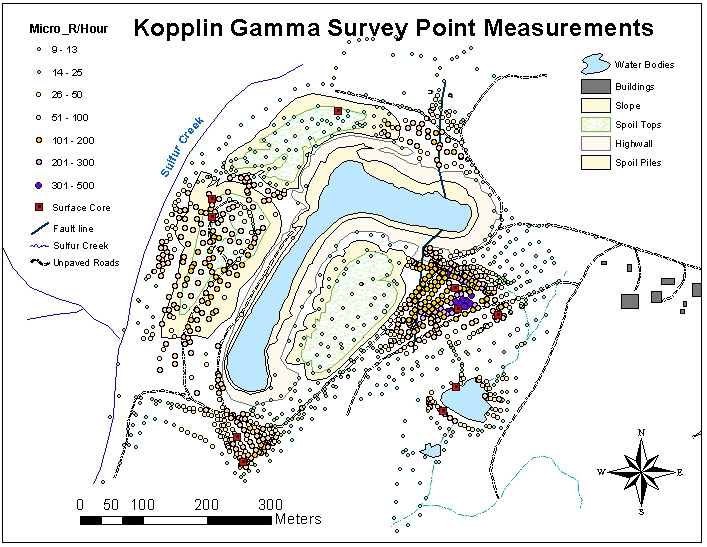
Map 2. Point measurements and Surface Core locations.
The isoline (contour) map of radiation intensities presented in this report (Map 3) displays gamma radiation gradients on the DOQQ file. These are qualitative changes in radiation and are not intended to represent quantitative delineations in contaminant distribution. Numerous attempts were made to generate contours using ArcView 3.2a Spatial Analysis extension. Every attempt produced unsatisfactory results: contours were generated for values that did not exist or the contour was generated on the wrong side of the point. It is the principal authors' opinion that the ArcView 3.2a software lacks the robustness to properly generate contours. Many alternative programs are available for contouring of point files but the importing of the contours into ArcView is not always possible. The contours of Map 3 were constructed using Surfer v.7, which allowed for the export of .shp files that are georeferenced in ArcView. Contouring accuracy appears to be a function of the size chosen for the grid cells in the point file interpolation process. Consequently the smaller the cell size, which is chosen in map units, the better resolution in the final contours. This process is a trade off with the time taken to generate the grid file. Even the more accurate contours generated by Surfer v.7 were adjusted by "hand" in ArcView using the vertex editing tool. While Surfer produced substantially less errors and more realistic contours minor changes were still necessary to accurately represent the radiation emissions of the site. At least 25 different attempts were made to generate acceptable contours and the final result still required editing. It should be noted that contouring by hand on paper maps has always been a matter of cartographic interpretation and the advent of complex software may have simplified the process but does not remove the human element.
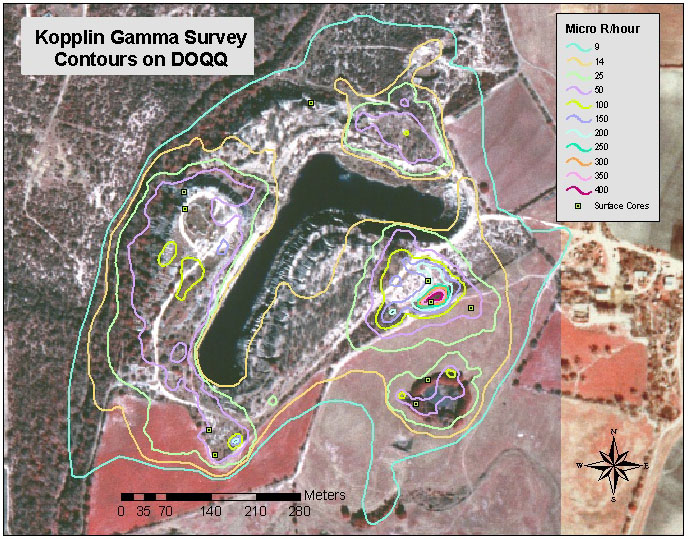
Map 3. Contours on DOQQ
The presence of radionuclide contamination at the abandoned Kopplin uranium mine site was confirmed and characterized using a gamma ray counter and GIS mapping. The mapping included the identification of all sampled locations, the graphical display of the intensity of the point gamma ray fields and a contour map displaying gamma emission gradients throughout the site. The maps allowed for the identification of general areas of above-background radiation levels that may need remediation and historical features of the mining operation (such as the approximate location of the former ore pad).
As for the GIS rendition of the collected data, it was found that ArcView v.3.2a Spatial Analyst extension lacks the functionality to generate acceptable contours. The Surfer v.7 software was used to produce acceptable contours and provide an exported file compatible with ArcView, thereby allowing the successful integration of the two programs. The DOQQ files provided background images upon which we could delineate relevant surface features. Georeferenced data files with identified features were then uploaded into the GPS unit and allowed us to navigate the site during the survey. By collecting the point data in the UTM 14R coordinate system, no conversion or reprojection of data was required. Collection of the data in UTM coordinates will also facilitate the combination of these data with future data into a seamless GIS database.
Ball, T. K., D. C. Cameron, T. B. Colman, and P. D. Roberts (1991). "Behaviour of radon in the geological environment: a review." Quarterly Journal of Engineering Geology 24: 169-182.
Bartlett, A. C. (1997). The South Texas Tertiary: stratigraphy, structure, geomorphology, soils. Waco, Texas, Baylor University: 41.
Galloway, W. E. (1982). Depositional architecture of cenozoic Gulf Coastal Plain fluvial systems. Austin, Texas, Bureau of Economic Geology: 127-155.
Grasty, R. L. (1997). "Radon emanation and soil moisture effects on airborne gamma-ray measurements." Geophysics 62(5): 1379-1385.
Henry, C. D., W. Galloway, and G. Smith (1982). Considerations in the Extraction of Uranium from a Fresh-Water Aquifer - Miocene Oakville Sandstone, South Texas. Austin, Bureau of Economic Geology: 36.
Jonsson, G., C. Baixeras, R. Devantier, W. Enge, L. Font, K. Freyer, R. Ghose, and H. C. Treutler (1999). "Soil radon levels measured with SSNTD's and the soil radium content." Radiation Measurements 3(1): 291-294.
Moxham, R. M. (1964). "Radioelement dispersion in a sedimentary environment and its effect on uranium exploration." Economic Geology 59: 309-322.
USEPA (1998). BASINS Database.http://www.epa.gov/ost/basins.
Waggoner, R., J. Brandt, and L. Moffett (1994). South Texas uranium district abandoned mine land inventory. Austin, Railroad Commission of Texas: 209.
Winkler, R., F. Ruckerbauer, and K. Bunzl (2001). "Radon concentration in soil gas: a comparison of the variability resulting from different methods, spatial heterogeneity and seasonal fluctuations." The Science of the Total Environment 272: 273-282.