The Hurricane Evacuation Assessment Toolset of Hillsborough County, Florida
Earl J. Dame and Teresa Rodriguez
ABSTRACT
This paper presents the use of Geographic Information Systems for the development of the Hurricane Evacuation Assessment Toolset(HEAT) for Hillsborough County, Florida. The application has been created to assist resident by providing evacuation and sheltering information in the event of a hurricane or other natural disaster. This interactive program was designed to assist the public to determine if they are in an evacuation zone. It also provides information on shelters, hospitals, fire stations and sandbag locations. With the additional use of the Evacuation Routing Program, residents are able to quickly print maps, with driving instruction to one of these facilities.
I. INTRODUCTION
In the state of Florida, Hurricanes are a pernnial fact of life. Historically, hurricanes are the deadliest and costliest natural disasters that impact the peninsula (Rappaport, 1995). The effects are not only to the anthropogenic features of urban areas, but also to the flora and fauna of the state. Complete ecosystems are transformed and landscapes are shaped by wave action, tornadic activity, and torrential rains caused by these destructive storms. Hurricanes have played an important part in the geomorphological development of Florida and have been catalysts in the ever-changing shape of the coastline. Since the early days of settlement in Florida, hurricanes have decimated populated areas and claimed countless lives. In 1992, hurricane Andrew was responsible for 26 billion dollars in damages, 65 deaths, and leaving over 250,000 people homeless. Approximately 600,000 homes and business were destroyed or severely impacted by Andrew (Willoughby, 1996). Thankfully the death toll was relatively low compared to previous hurricane events, but the chaos the storm created was of epic proportions. Many lessons were learned from Andrew, specifically, the lessons of the dissemination of critical data and the mobilization of evacuees into shelters (Cochran, 1994). This paper addresses how geographic information systems assisted with the task of distributing information of critical facilities for the purpose of emergency management.
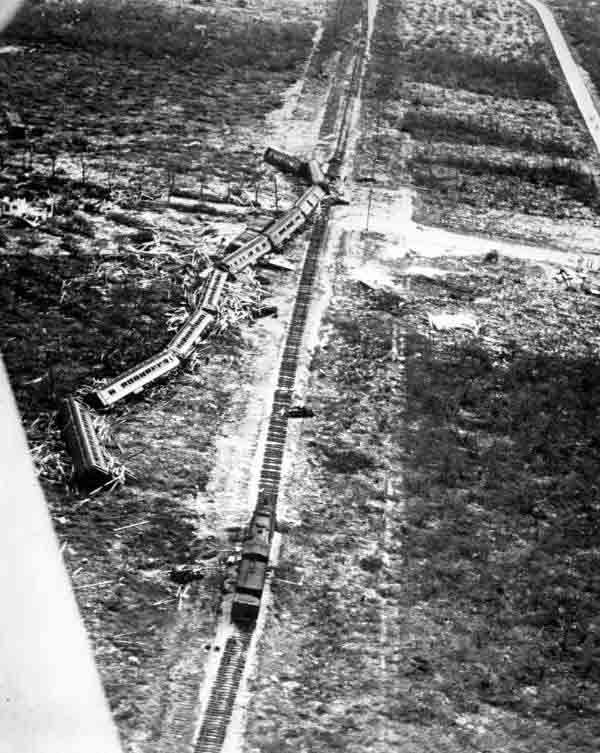
Hurricane Andrew was the most powerful hurricane to hit South Florida in almost 30 years. The last major hurricane, which is a hurricane with winds in excess of 115 miles per hour, to hit that region was Hurricane Betsy in 1965 which reached the Florida shoreline as a Category Three Hurricane. Andrew was much more powerful than Betsy, although it was a small storm in terms of its size as it only carved a path of destruction some 40 miles wide in diameter. Prior to making landfall in South Florida, Andrew had sustained winds of 145 mph in its eye wall, and wind gusts of approximately 175 miles per hour, which made it a Category Four Hurricane on the Saffir-Simpson Scale. Andrew's central pressure, the pressure measured in the eye of the storm, was the third lowest of any hurricane to make landfall in the United States with 922 millibars, or 27.22 inches of Mercury (Doehring, 1994). Only the Category Five Hurricanes Camille and the Labor Day Hurricane of 1935 had lower barometric pressures when they reached land. The combination of the high winds and extremely low pressure gradients created a storm surge of approximately 17 ft. along the coast in South Miami.
Figure 1. Labor Day Hurricane of 1935
Ironically, the State of Florida was completely unprepared for the devastation that Hurricane Andrew inflicted. Climatology and meterology were still more of an art form than a science, and predictability models of storms were a general approximation at best. To compound the situation, the lack of any severe storm hitting Florida dated back to the 1960's, made Floridians very myopic and relaxed in their attitudes toward Hurricanes(Williams, 1964). So, when Andrew provided Florida with that proverbial "slap in the face", state legislators scrambled to enact laws and regulations which provided a continuity plan in the event of a major natural disaster. Emergency planners realized that the traditional method of broadcasting information about Hurricanes and evacuation plans was through the conventional forms of mass media. For example, the Emergency Operations Center for the State of Florida would announce that a Hurricane was an eminent threat and that residents in certain evacuation zones must mobilize to a designated shelter. The utter pandemonium that ensued from the mass exodus created a stressful and potentially dangerous environment (Simpson, 1981). With the advent of the modern computer technology and the Internet, emergency planners have realized the great potential a web-based application would have for the purpose of distributing evacuation shelter information. This new technology harnessed with Geographic Information Systems has become a powerful tool for the process of developing an emergency preparedness plan in the event of Hurricane.
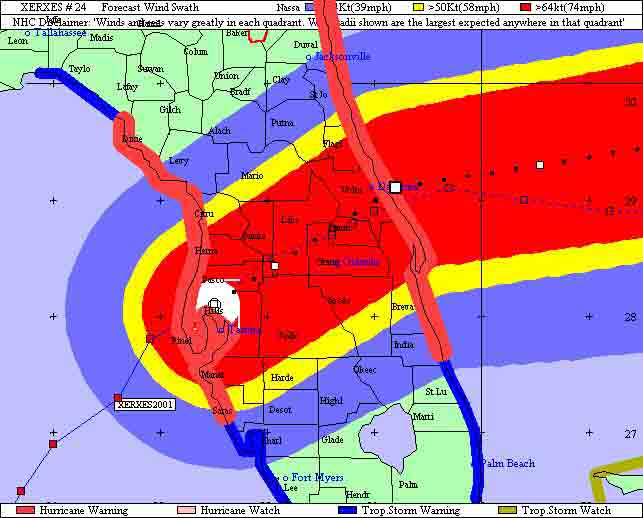
Figure 2. Modern Hurricane Tracking Models
Geographic Properties of Hillsborough County
Hillsborough County is located midway along the West Coast of Florida and encompasses 1, 072 square miles. The unincorporated area has 931 square miles, and the municipalities total 141 square miles. The largest municipality of Hillsborough County is the City of Tampa. Since Tampa bay is a protected waterway it has become the largest port in the southern United States, and is the largest exporter of Phosphate in the World. The population of Hillsborough County in 2001 was 1,026,906 and the 2010 projected population is 1,153,100.
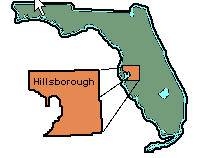
Figure 3. Locator Map of Hillsborough County
In the 16th Century, Europeans explored what is now known today as, Hillsborough County. Spanish conquistadors, Panfilo de Narvaez and Hernando DeSoto, came in search of gold for the crown of Spain. No treasures were found and many conflicts were had with the natives of the penisula. Hernando DeSoto extensively explores the region and encountered resistance from the Seminole Indians. As Americans took possession of Hillsborough County in 1821, Fort Brooke became the central point of the area, and eventually evolved into municipality of Tampa. Much trading went on in the area and, soon, Tampa became one of the largest cities on the west coast of Florida. Historically, the Florida peninsula has been the stage for two Seminole wars, A Civil War, plagues and countless hurricanes.
With the introduction of the railroad in 1885, Spanish and Cuban cigar factory owners and workers moved from Miami to Tampa. The southern tip of Florida, which is now Miami, was the original location of the cigar industry. But due to several severe hurricane seasons, the cigar industry became one of the largest industries in the area. In 1898, The American Army was highly involved in the Spanish-American War under the conductance of Teddy Roosevelt. Roosevelt's troops, who were known as "The Rough Riders", passed through Tampa on their way to invade Cuba. With a strong military presence, Hillsborough County began to grow rapidly in population and the industrial sector. Foreigners and tourists started to visit the county on a regular basis and county's resources, primarily made up of cigars, cattle, citrus, and phosphate fertilizer started becoming widely distributed. When the great depression of the 1920's began, Tampa was greatly affected as much as other regions in the United States. But, Tampa had a very stable economy during that period and was able to survive the economic depression. Tampa is the only major Florida city that is not solely dependent on tourism.
Hurricane Evacuation Assessment Toolset (HEAT)
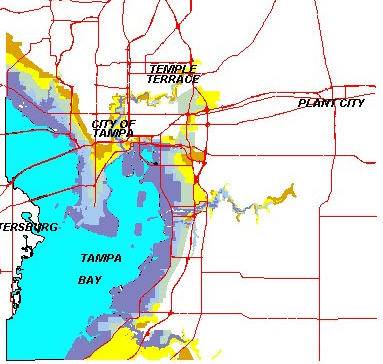
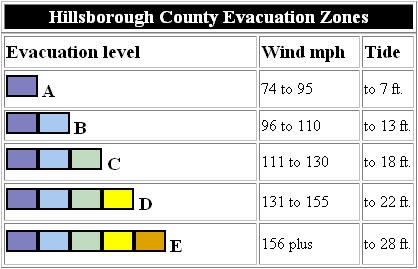
In 2000, the Information and Technology Services Dept (ITS) of the Board of County Commissioners of Hillsborough County, Florida created a web-based application that provided citizens with geographic information of local critical facilities. This application is called the Hurricane Evacuation Assessment Toolset (HEAT). HEAT allows citizens of Hillsborough County to locate critical facilities in relation to their residence. These critical facilities include: Hospitals, fire stations, evacuation shelters, and sandbag locations. This interactive program was designed to allow citizens to determine if they are in one of the five evacuation zones(Figure 4). Depending upon the strength and track of an approaching hurricane, the evacuation plan calls for one of five color-coded evacuation levels(Figure 5).
Figure 4. Hillsborough County Flood Prone Areas
Figure 5. Hillsborough County Evacuation Zones
Each evacuation level requires the successive movement of residents from the coastline toward the interior part of the county. If a citizen resides in an evacuation zone that has been activated, they are required to leave the area and move to a safer zone. All mobile home residents in the county must evacuate during ALL evacuation levels, due to their inherent structural weaknesses. Since there is a shortage of emergency shelters, it is recommended that citizens first try to stay with friends or family who reside in areas that are NOT located in any of the evacuation zones. If this is not feasible, then citizens are required to mobilize into shelters. In 2000, Hillsborough County shelters had space for 65,000 evacuees. Now, there are only 11,000 spaces. The department of Emergency Management of the State of Florida has enacted stricter engineering standards for evacuation shelters. Shelters must be able to withstand winds in excess of 111 miles per hour which, consequently, has reduced the number of approved shelters from 51 to 24. Most shelters that have been disqualified do not have hurricane window screens and/or reinforced walls. The State is providing grants to retrofit these older shelters to bring them up to code compliance. Also new public schools have to be constructed to these structural codes so they can augment the total number of buildings eligible for shelter purposes.
II. SYSTEM COMPONENTS AND USER INTERFACE
System Components
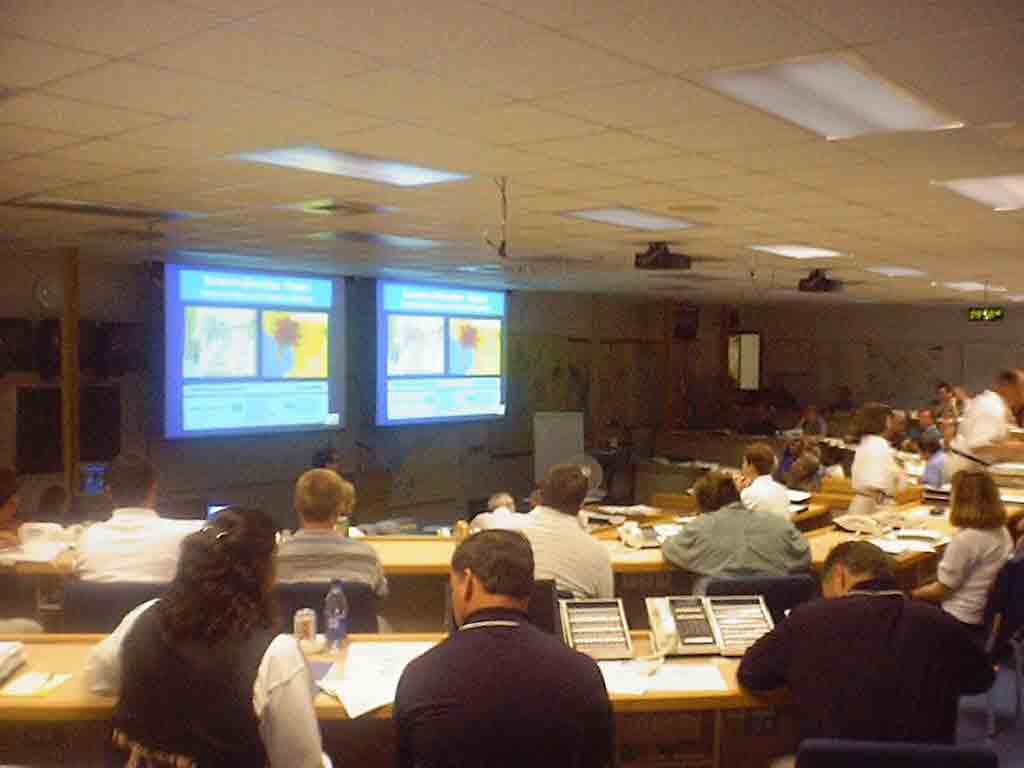
The objective of the HEAT application is to provide an electronic interface, accessible via the internet, that allows citizens to access critical geographic layers. These layers include: hospitals, shelters, sandbag source locations, fire stations, and evacuation routes. Also, address matching and geocoding functionality are provided within this application. Another objective of the HEAT is to reduce the number of phone calls the Citizen Action Center receives during a natural disaster (Figure 6). According to the Management of the Hillsborough County Emergency Operations Center, "The Citizen Action Center receives as many as 50,000 phone calls per storm event, in which most calls are inquiries regarding evacuation zones". One aspect that differentiates this toolset from other static applications is the evacuation routing capability to emergency facilities.
Figure 6. Emergency Management Operations Center
HEAT is composed of:
1) Geographic maps of critical facilities and local terrain (i.e. shelters, hydrography, road centerlines, parcel data, aerial photography, etc.)
2) Dynamic geographic databases of emergency evacuation shelters and critical facilities
3) Graphical User Interface tools for displaying critical facilities in relation to parcel addresses
4) Address matching and geocoding tools for route mapping functionality
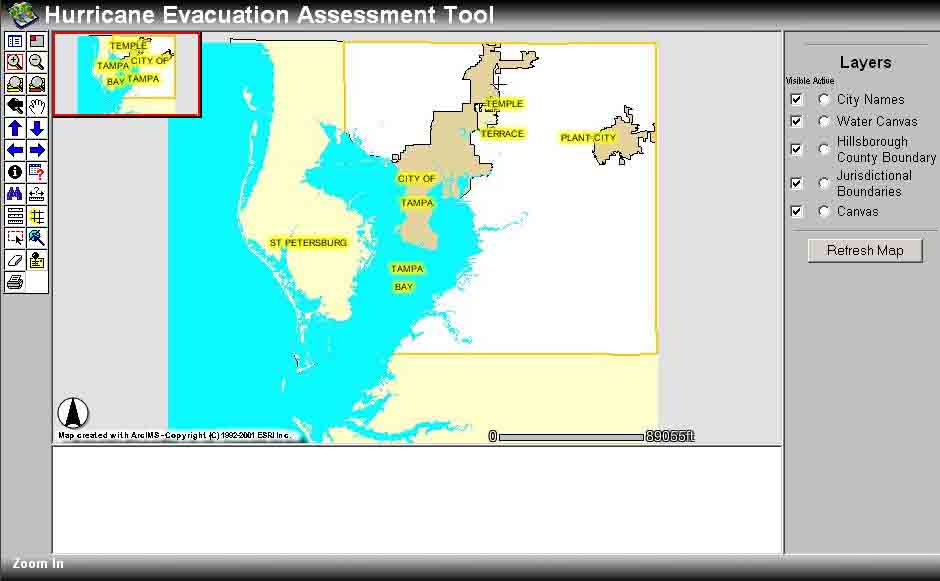
Figure 7. The Hurricane Evacuation Assessment Toolset
Locating Evacuation Zones
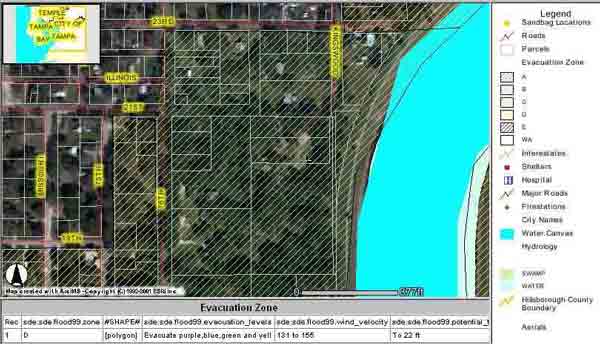
Evacuation zones can be determined in relation to a citizen's address. This is the most common and critical information residents of Hillsborough County need to know BEFORE a Hurricane makes landfall. In Figure 8, the application shows the extent of the evacuation zone and its proximity to streets and landmarks. One the user inputs the residential address they can view specific emergency locations as well as the geographic extent of the evacuation zones. The interface allows for the display of specific layers and attributes associated with them.
Figure 8. Example of Evacuation Zone lookup
Geographic Location of Shelters
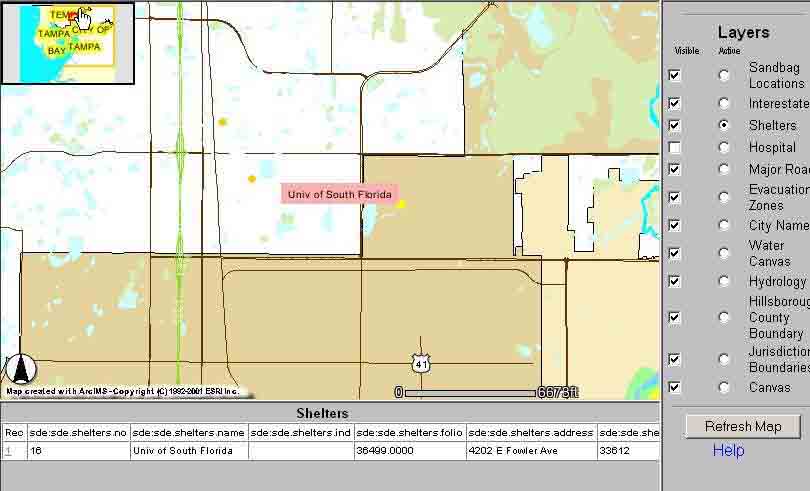
Once a user determines if they are in an evacuation zone, they can query HEAT and locate the nearest open evacuation shelter (Figure 9). Since shelters operate on a "first come-first serve" basis, it is very important to know the locations of serveral surrounding shelters. Shelters are symbolized with a small red square depicting the geographic location of the building. Using the 'select polygon' button, a shelter can be selected and the attributes displayed. Information such as: Shelter name, shelter number, street address, opening status, special needs, and maximum occupancy are available from the query results. Shelter phone numbers have been intentionally omitted because all phone inquiries should be directed to the Citizen Action Center's hotline.
Figure 9. Example of Shelter Lookup
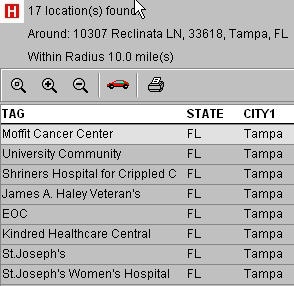
Proximity of Hospitals
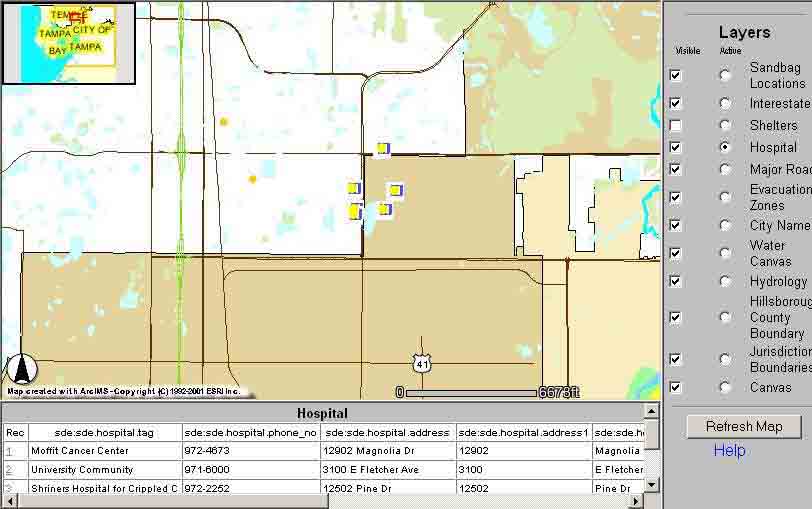
As with the shelters, area hospitals can be located within the vicinity of the resident's address. Citizens with special medical needs should know beforehand what hospitals in the vicinity have the proper and adequate services for them. The available attributes for hospitals are: Hospital name, street address, and telephone number. As with shelters, hospitals reach maximum occupancy based on the severity of the storm and patient demand. Figure 10 displays hospitals within proximity of a specific address. At the bottom of the interface screen is a table listing all of the hospitals within the search radius. The user can click on the hyperlink in the table and the application will zoom into the geographic extent of the selected hospital.
Figure 10. Example of Hospital Proximity
As with the previous critical facilities mentioned above, fire stations and sandbag locations can also be located and queried. Their geographic extent can be displayed in relation to a source address. Viewing each layer consecutively allows to user to determine a priority level and the ability to create an emergency preparedness plan for the hurricane season.
Locating specific addresses and street intersections
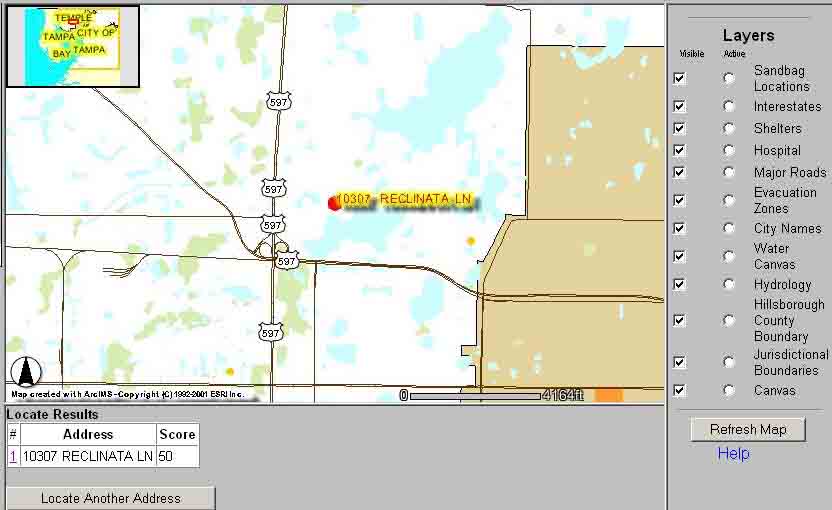
This functionality ties in the Property Appraiser's Office parcel database with the geographic layers of the county. This allows the user to view their geographic location in respect to the nearest critical facilities. Also, during many of the broadcasts of television and radio programs, downed power lines and flooded streets are referenced by address. This aspect of the HEAT application has great potential for emergency preparedness, providing a resource for citizens to create an emergency plan in the event of a hurricane. Figure 11 illustrates a sample address and its surrounding geography.
Figure 11. Example of Address Lookup
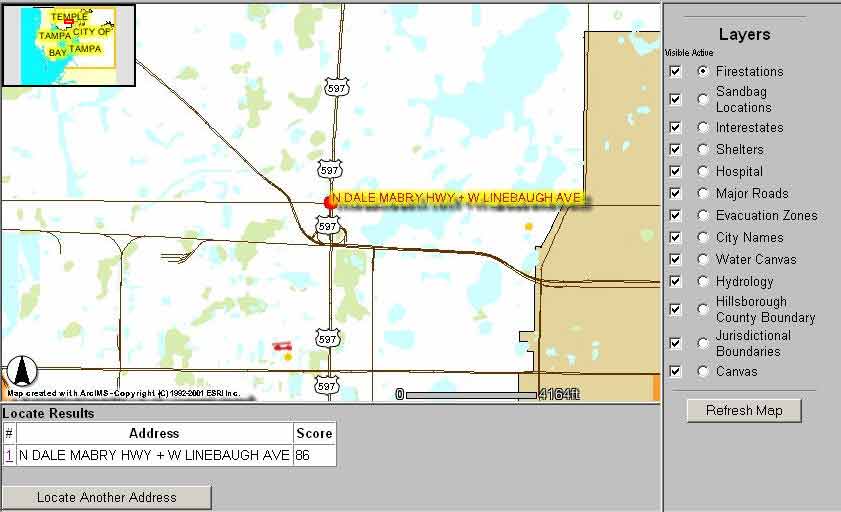
But, sometimes specific addresses are cryptic and meaningless for visiting tourists or residents who are not familiar with certain areas of the county. HEAT allows users to locate street intersections. From there, they can navigate via dead reckoning to a desired evacuation shelter or critical facility. The use of street address ranges is unintelligible for users who have no idea which direction the addresses increase or decrease. Streets and avenues with azimuthal attributes (i.e. North Dale Mabry Highway versus South Dale Mabry Highway) further confuse the inexperienced user. Figure 12 is an example of finding a location based on street intersections.
Figure 12. Example of Intersection Lookup
Route mapping to Critical Facilities
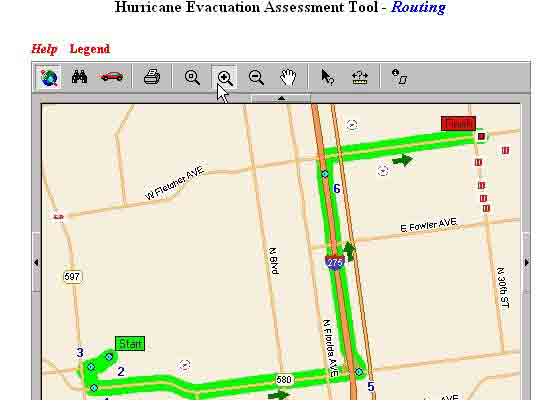
Once a user has located their residence and the neighboring critical facilities, driving directions can be generated. The directions are given in linear miles and estimated travel time between waypoints. This is an invaluable feature for users who are not familiar with the area (i.e. tourists, relatives) and serves as a distance gauge and travel time estimator. Figure 13 provides an example of a point by point text description of the desired travel path and a graphical highlight of the roads that will be traversed.
Figure 13. Example of Emergency facility routing
Component Architecture
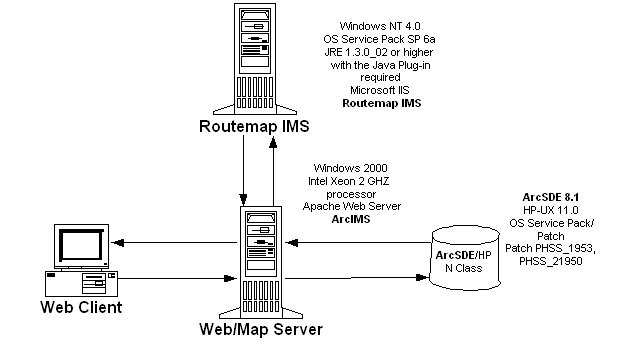
HEAT was designed with Environemental Systems Research Institute's (Esri) ArcIMS 3.1 and Esri's Routemap IMS. ArcIMS provides the foundation for distributing high-end GIS and mapping services via the Internet. This software enables users to integrate local data sources with Internet data sources for display, query, and analysis in an easy-to-use web browser and revolutionizes the way users can access and interact with Internet mapping and GIS data. RouteMAP IMS is a stand-alone Internet-based site locator application that generates driving directions to desired locations. This out-of-box Internet mapping solution is designed for developers that wish to add "find-and-route" mapping capabilities to their Web sites. Coupling ArcIMS and RouteMap IMS creates a very powerful interface that allows citizens to answer geographic questions about their location in respect to the surroundings of their homes.
ArcIMS also handles the database connection to ArcSDE. Esri's proprietary central database repository, which is housed on a HP 9000 N-class server (Figure 14). All files were exported to shapefile format using ArcGIS 8.1.2 and imported into RouteMap IMS. Tables 1 - 4 illustrate the specific configurations and systems requirement for ArcIMS and RouteMap IMS in the HEAT application:
Table 1. Setup of HEAT - ArcIMS Server
| Server | Web Server | Browser | DBMS | ArcSDE |
| OS- Windows NT | Apache HTTP Server 1.3.24 | IE 5.0, 5.5, 6.0 | Informix Dynamic Server 9.21HC4 | ArcSDE 8.1 |
| Tomcat 3.3.1 | OS - HP-UX 11.0 |
Table 2. Setup of HEAT - RouteMap IMS Server
| Server | Web Server | Browser |
| OS- Windows NT | IIS 4.0 or higher | IE 5.0, 5.5, 6.0 |
| Java Virtual Machine 5.0 | Netscape 3.xx, 4.xx |
Figure 14. System Architecture of HEAT
Table 3. Setup of Real-Time Shelter Update Application
| WorkStation | DBMS | Language | ArcSDE |
| OS- Windows NT or Windows 98 or Windows 2000 | Informix Dynamic Server 9.21HC4 | ArcINFO ODE with Visual Basic 6.0 | ArcSDE 8.1 |
| OS - HP-UX 11.0 |
Table 4. Software used for development and end use of HEAT.
| Software | Vendor | Development/ End Use | Purpose |
| Adobe Illustrator | Adobe | Development | Development of interface icons and documentation figures. |
| Macromedia Dreamweaver 3 | Macromedia, Inc. | Development | Help Files, Documentation, and Screens |
| Informix 9.2.1 | Informix | Both | Data Storage and Management |
| Routemap IMS 2.0 | Esri | Both | Core Interface |
| ArcIMS 3.1 | Esri | Both | Core Interface |
| ArcSDE 8.1 | Esri | Both | Manages spatial data in a DBMS |
III. DATABASE DESIGN AND DEVELOPMENT
Designing and Compiling the Database
The data used for the HEAT application comes from many different sources within Hillsborough County and the City of Tampa. The County's Real Estate Department provides annual updates to the 3 core HEAT databases, which are: Hospitals, Fire stations/sandbag locations , and Shelters. The Property Appraiser's Office distributes the Parcel layer on a monthly basis. The remaining geographic layers are collected intermittently throughout the calendar year, as they are routinely updated. Table 5 provides a list of the layers used and a brief description of their attributes.
Table 5. Primary HEAT database tables
| Table Name | Description | Data Sources |
| Hospital | Hillsborough County Hospitals - Contact information and street address | Real Estate/ Survey Mapping/ GIS |
| Firestations/ Sandbags | Fire stations and sandbags - Contact information and station numbers | Real Estate/ Survey Mapping/ Gis |
| Shelters | Evacuation shelters - Shelter number, contact information, special needs amenities and maximum occupancy | Real Estate/ Survey Mapping/ GIS |
| Parcels | Complete database of parcel information. | Property Appraiser |
| Roads | County wide road centerlines with properties for geocoding | City of Tampa |
| Hydrography | Cartographic depictions of bodies of water within the county | Real Estate/ Survey Mapping/ GIS |
| Evacuation Zones | Polygon outline of evacuation zones, attributes of category levels, wind veloctiy, potential tide height | Tampa Bay Regional Planning Council (TBRPC) SLOSH Model (Sea, Lake, and Overland Surges from Hurricanes) |
| City names | Names of the municipal areas within Hillsborough County | Real Estate/ Survey Mapping/ GIS |
| Jurisdictional | Polygons outlining municipal areas within Hillsborough County | Real Estate/ Survey Mapping/ GIS |
| Aerial photography | Countywide mosaic of aerial photography | Public Works |
IV. REAL-TIME ANALYSIS AND DATA INPUT
Since this data is vital for effective mobility of residents, there are concerns over the accuracy of Shelter availability in the HEAT application. The Emergency Operations Center (EOC) of Hillsborough County only provides shelter information on an 'ad hoc' basis. Since this information is not known until an actual storm threatens the area, the availability of these resources needs to be updated in real-time. A database update interface was developed to allow this information to be entered instantaneously at the EOC. Once the changes are made to the shelters database, HEAT will display shelters as either "Opened" or "Closed". As shelters begin to fill up with evacuees, EOC staff can begin to prepare to open other shelters to meet the demands. This real-time analysis is one of the greatest assets that HEAT possesses.
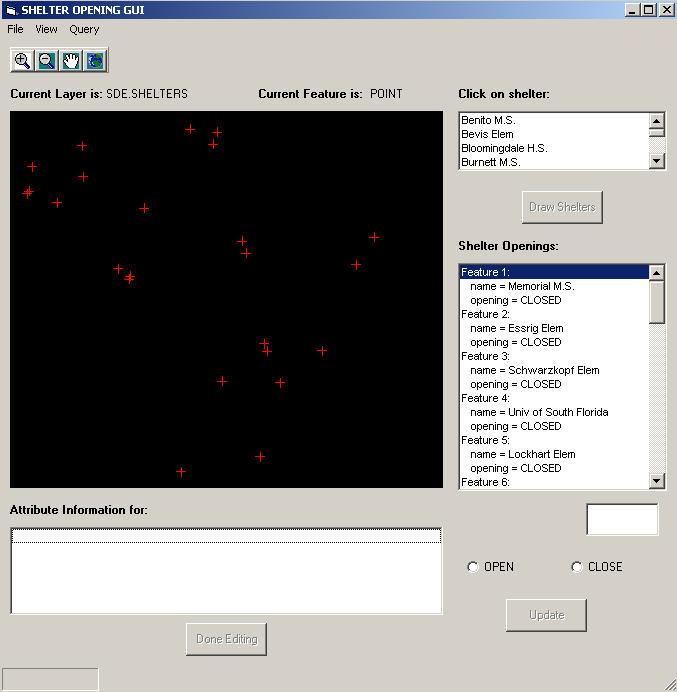
Figure 8. Example of Real Time Shelter Update application.
V. CONCLUSION
The results of the Hurricane Evacuation Assessment Toolset have far exceeded the original goals. Many years ago, when the idea of creating a web enabled interface was conceived, the lack of technology was the greatest obstacle to overcome. Insufficient processing power and primitive development software made the task of an internet-based evacuation toolset unfeasible. But, as modern computers and Geographic Information Systems advanced the goals became obtainable. The introduction of Esri's MapObjects IMS, ArcIMS and RouteMap IMS greately facilitated GIS analysts in creating a fully functional application for the Internet. In the beginning the goals were simple: Provide the citizens of Hillsborough County with an easy to use Internet application, which would relieve the Citizens Action Center with the overwhelming number of phone calls regarding information about Evacuation Shelters. By no means was the HEAT application ever intended to replace the Phone centers. Its prime directive was to explore the benefits of the Internet and its potential usage as an electronic form of mass media.
Inronically, the greatest task ahead in the development of HEAT is to prioritize what needs to be further developed. The possibilites for the usage of HEAT are endless. There are discussions already about using HEAT as a spatial decision support system for the allocation of critical facilities in real time. Another potential offshoot would be to use HEAT as a planning tool for future shelters. Since public schools are a prime source for evacuation shelters, a needs analysis can be performed using the parcel information of the surrounding neighborhoods. Since HEAT is the first application of its kind in Hillsborough County, many local governmental agencies are realizing the capabilities and power of geographic data. So by default, HEAT in a sense, has become the flagship and purveyor of Geographic Information Systems, with a great future ahead of it.
ACKNOWLEDGEMENTS
First and foremost, we would like to thank Mark Dickson, the GIS Manager of Hillsborough County, for all of his leadership and vision during the development of the HEAT application. Without his assistance, this project would have never come to fruition. Thanks also to ITS department director Roger Dean for his support and belief in Geographic Information Systems and allowing us to pioneer this alternative toolset. A special thanks to Rick Cvarak and Marta Escobar of the Real Estate department, who assisted us with data collection and image processing. Thanks also to Eric Harvey of the GIS section for his wisdom and great advice with the database administration and system design of HEAT. Thank you also to DeAnn Capanna of the GIS section for developing the Real Time Shelter Update interface. We would have never been able to accomplish this task without the help of Brett Simpson, the County's Web administrator. Brett's vast knowledge of internet technology and performance enhancement allowed us to create a streamlined application. And, last but not least, many thanks to Eugene Henry and Chris Zambito, of Hazard Mitigation for Hillsborough County, for their great insight of critical facilities management and emergency preparedness.
REFERENCES
Cochran,L., and M. Levitan, 1994: Lessons from Hurricane Andrew. Architect Sci. Rev., vol. 37
Doehring, F., I.W. Duedall, and J.M. Williams, 1994: Florida Hurricane and Tropical Storms, 1871 - 1993: An Historical Survey. Florida Sea Grant College Program TP - 71. University of Florida, Gainesville, FL.
Rappaport, E.N. and J. Fernandez-Partagas, 1995: The Deadliest Atlantic Tropical Cyclones, 1492- 1994. NOAA/NWS Technical Memorandum NWS NHC-47 (January). Coral Gables, FL
Simpson, R.H. and H. Riehl, 1981: The Hurricane and Its Impact. Louisiana State University Press, Baton Rouge, LA
Williams, H.B., 1964: Human factors in warning-and-response systems. In The Threat of Impending Disaster(G.H. Grosser, ed.) MIT Press, Cambridge, MA. 7
Willoughby, H.E. and P.G. Black, 1996: Hurricane Andrew in Florida: Dynamcis of a disaster. Bull. Amer. Meteor. Soc., 77
AUTHOR INFORMATION
Earl J. Dame / Programmer Analyst
Hillsborough County, FL., Board of County Commissioners
Information & Technology Services/ GIS
601 E. Kennedy Boulevard
P.O. Box 1110, 28th Floor
Tampa, Fl. 33601-1110
Office:(813) 301-7203
Fax: (813) 272-6358
Internet: Damee@hillsboroughcounty.org
Teresa Rodriguez / Software Specialist II
Hillsborough County, FL., Board of County Commissioners
Information & Technology Services/ GIS
601 E. Kennedy Boulevard P.O. Box 1110, 28th Floor
Tampa, Fl. 33601-1110
Office:(813) 272-7166
Fax: (813) 272-6292
Internet: RodriguezT@hillsboroughcounty.org