Assessing Multi-Modal Transportation Accessibility Using ArcView Network Analyst
by:
Kenneth Aloisio, Rod Cruz, Lawrence Marcus, and Heather Whitlow
ABSTRACT: The City of Rockville, Maryland, is leading an effort to assess multimodal transportation accessibility, simulating travel times to key activity centers by all modes of travel: automobile, truck, transit, bicycle, and pedestrian.� The applications of this work effort are far reaching including (1) improving master plan and development review analysis procedures, (2) setting capital improvement program priorities, and (3) maximizing the efficiency of existing traffic operations.� Networks were created using ArcGIS, ArcPad, and ArcView, while travel time rings were developed using ArcView Network Analyst.� Other participants include FHWA, the University of Maryland, and Montgomery College.
In the true spirit of a multi-organizational partnership, the City of Rockville, Federal Highway Administration (FHWA), University of Maryland, and Montgomery College joined forces to initiate the application of new technologies in transportation planning and engineering.� Using geographic information systems (GIS), laptop computers, Compaq iPAQ pocket PCs, and global positioning satellite (GPS) technologies, the City of Rockville is leading an effort to assess transportation accessibility and manage public infrastructure in a new and efficient manner.� With the support of a grant from FHWA, the City is in the process of developing a tool which will (1) assess multi-modal transportation accessibility to the Rockville Town Center for planning purposes; and (2) inventory the fine details of the transportation system for engineering applications.� This paper discusses the accessibility analysis portion of this initiative.
A GIS-based model is being created to simulate travel times to key activity centers by all modes of travel: automobile, truck, transit, bicycle, and pedestrian.� By October 2002, five networks will be created and calibrated using Esri�s ArcView Network Analyst.� The automobile, pedestrian, and transit networks are essentially complete.� The applications of this model are far-reaching.� For example, in areas that possess poor accessibility, the model can be used to simulate the benefits of new construction projects.� Based on the results of the model, capital improvement program projects can be prioritized based on a quantitative measure.
Street (automobile) network
The Rockville street network line file was created, using Montgomery County�s �Streets� line file as a basis.� The shapefile had to be altered substantially to ensure that nodes only appear at the ends of streets and at intersections.� In the street network travel time costs are assigned to both the line segments (arcs) and the intersections (nodes.)�
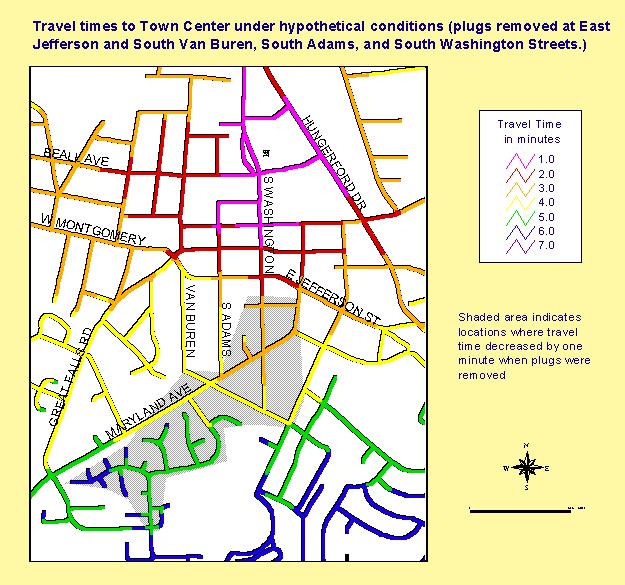
The cost assigned to the arcs was calculated using the speed limit along the street segment and the length of this segment.� This cost is a field in the line file itself.� Initially, the arc cost was calculated using actual speeds taken from field measurements.� However, the delays at intersections have a much greater effect on overall travel time than do the speeds on individual links.� Sensitivity tests show that for speeds ranging from 25 to 50 mph, changes in speed of up to 10 mph have very little impact on the overall travel time.
The costs at intersections were assigned using a turntable.� In addition, the turntable allowed us to limit turns and U-turns in accordance with street geometry and existing turn restrictions.� The delays at intersections were generalized for the whole city based on empirical data taken from a sample set of intersections.� This data was extrapolated based on the Rockville street classification of the two intersecting streets (used as a proxy for traffic volume) and the type of control at each intersection (signalized, two-way stop, etc.)�
For a small portion of the City, Synchro and SimTraffic traffic modeling software was used to generate actual delays at intersections from a simulation run using volume counts, turning movement counts and existing signal timing and phasing.� These delays were then entered by hand into the ArcView street network turntable.� It is hoped that one day the two software types can be integrated so the entire network will run using the simulation delays.� The fact that the turntable contains over 15,000 records makes the hand-entry of data impractical.
The street network model has already been used to the estimate travel time savings that the removal of certain turn restrictions would produce.� It will be an invaluable tool in evaluating the several street extensions and connections that have been proposed in the Rockville Town Center.
Sidewalk (pedestrian) network
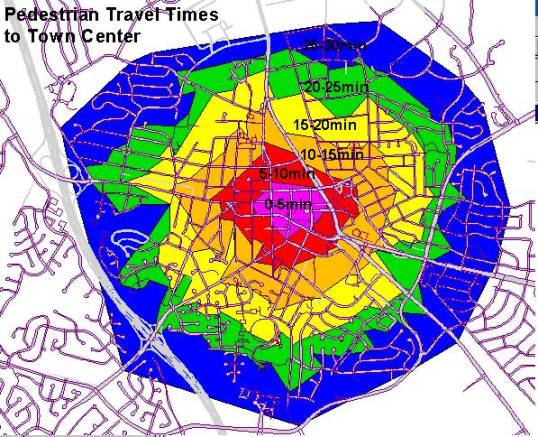
The sidewalk network was modeled in a manner similar to the automobile network.� It generally follows either side of the street layer, but with the addition of mid-block street crossings, off-street paths, and cut-through routes.� The network was constructed by tracing over the aerial photo of the City and field checking the results.� Lines were broken not only at intersections, but every time the type of pedestrian facility changed.� These facilities were classified as existing sidewalks, missing sidewalks, street crossings, commercial driveway crossings, overpasses, or stairs.� Presumably a pedestrian will travel at a different speed when he encounters each of the different types of facilities.� Areas with no sidewalk were included to account for the fact that pedestrians can (and do) traverse these areas by either walking in the street, shoulder, or grass strip alongside the street.
The cost factor assigned to a given line segment was based on the type of facility and the length of the segment.� The idea, of course, is that the absence of a sidewalk will slow pedestrians down, as would a street or driveway crossing where they must look for cars before walking.
No turntable was used in modeling the sidewalk network.� This decision was made for three main reasons.� First, since pedestrians can walk on both sides of the street, one street intersection is actually four separate intersections to pedestrians (with sixteen possible turns instead of four, as in the street network).� Thus, an excessive amount of data entry would be required in order to create a sidewalk network turntable.� Second, pedestrian movement is technically unrestricted.� There is no need to limit turns or u-turns as we did in the street network.� Third, because street crossings are a separate category of lines in the network, impedances could be coded directly onto these short links without creating confusion about which portion of the cost can be attributed to the walk speed and which portion of the cost can be attributed to the delay in waiting for a safe opportunity to cross.
To determine the delay at the intersections, each street crossing was further classified according to the type of� traffic control.� The categories are: a signal (pedestrians must wait a fixed amount of time), cars yielding to pedestrians (pedestrians do not have to wait), cars should yield to pedestrians (where legally cars should yield, but often they don�t, causing some pedestrian delay), and no control (pedestrians must wait for a gap in the traffic stream.)��
The delay pedestrians experience also depends on the volume of traffic on the street they are trying to cross.� Crossing a lightly trafficked residential street, a pedestrian need only slow down enough to turn his or her head to see if a car is on the road before crossing.� Crossing a major arterial, though, a pedestrian may have to wait ten or twenty minutes before there is a break in traffic long enough to cross. To assign this delay, a matrix was developed using the Rockville street classification (used as a proxy for traffic volumes) and the type of traffic control at each intersection.� The delays for each street classification and traffic control type are based on empirical data.
Using the sidewalk network for travel time analysis has proven to be a useful tool for quantifying how much time a sidewalk improvement will save pedestrians.� It can also be used as part of the development review process; showing how well parcels are connected and how many residences are within walking distance of say, a school.
Lastly, the sidewalk network line file will also be used to store information collected about sidewalk width, materials, and the buffer width (the distance between the sidewalk and the street).� While they are presently useful from an inventory standpoint, these factors may eventually be incorporated� into the network travel times, as some pavement materials are more comfortable to walk on, and pedestrians tend to slow down and use more caution the closer they are to moving traffic.�
Transit
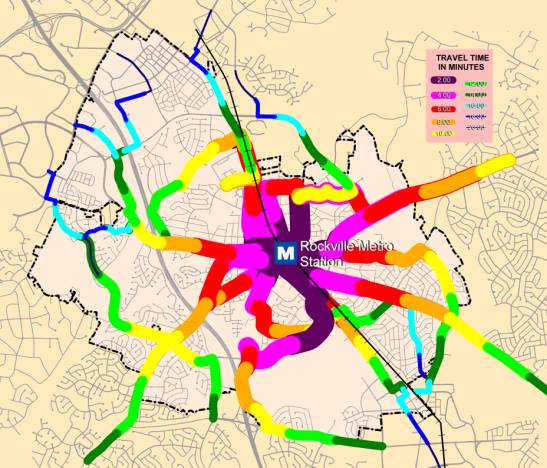
Metrobus and RideOn bus routes cover most areas within the City of Rockville.� The whole network provides access to Rockville�s business, commercial and industrial establishments.� Buses also provide transit service to most Rockville neighborhoods, as well as the Rockville, Shady Grove and Twinbrook Metrorail Stations in the Washington D.C. Metro system.
The transit network is a line shapefile created to model the existing Metrobus and RideOn bus routes that originate from or go through the city.� There are 20 bus routes that flow through Rockville, and for each a separate line was created.� For each bus route, the buses have scheduled time points, which are listed in the RideOn System Headways Manual along with the approximate time the bus arrives at each time point.� The lines comprising� each bus route were split at each of the scheduled time points.� The difference in time from one time point to another is assigned to that particular line segment.� This is the time cost that Network Analyst uses in running the network.� Thus, the resulting travel times are based on the buses� actual schedules.
The lines comprising each bus route were also divided at points where one bus line meets another to allow for transfers.� A turntable was created to add a delay for these transfers, account for the directionality of some routes, and to prevent U-turns.� The delay for a transfer was assumed to be one half of the headway for the bus route being transferred to.�
The transit network was the most complicated of the three networks we created.� Each bus route was modeled as a separate line, even when parts of the route were shared with other buses.� This resulted in several lines overlapping and ending up on top of one another.� The biggest problem we encountered was in building the turntable.� There are 20 separate bus lines, and in some locations as many as 12 lines converge at a single node.� In such cases, the turntable has as many as 144 entries for one node, a situation that ArcView seems unable to handle.�
Once we had the travel times for the buses, it was easy to combine this layer with buildings and the pedestrian network to see the scope of bus coverage.� Looking at these layers together, we immediately see areas where there is good coverage, and where more may be needed.
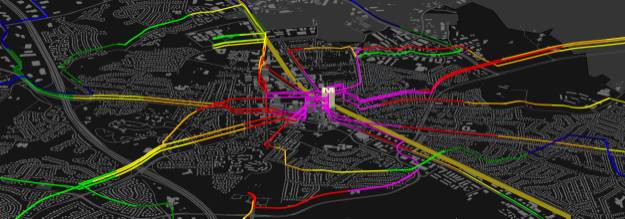
We also took these same travel times and converted them into 3D.�� Each bus route is represented as a floating line and the differences in color between each route is now more noticeable.� This proves more effective in figuring out route efficiency and transfer points.
����������� Simulating travel times for all modes of transportation is an excellent planning tool.� It allows transportation staff to quantify the impacts of proposed development and assess the benefits of future improvements.� Planners are able to display information to the pubic with simple, effective graphics.�� In using network analyst to assess multimodal transportation accessibility, Rockville has added to its transportation database and improved its analytical capabilities.