Table of Contents
Objective 1
Data Acquisition 2
Map Projection 5
Metadata 5
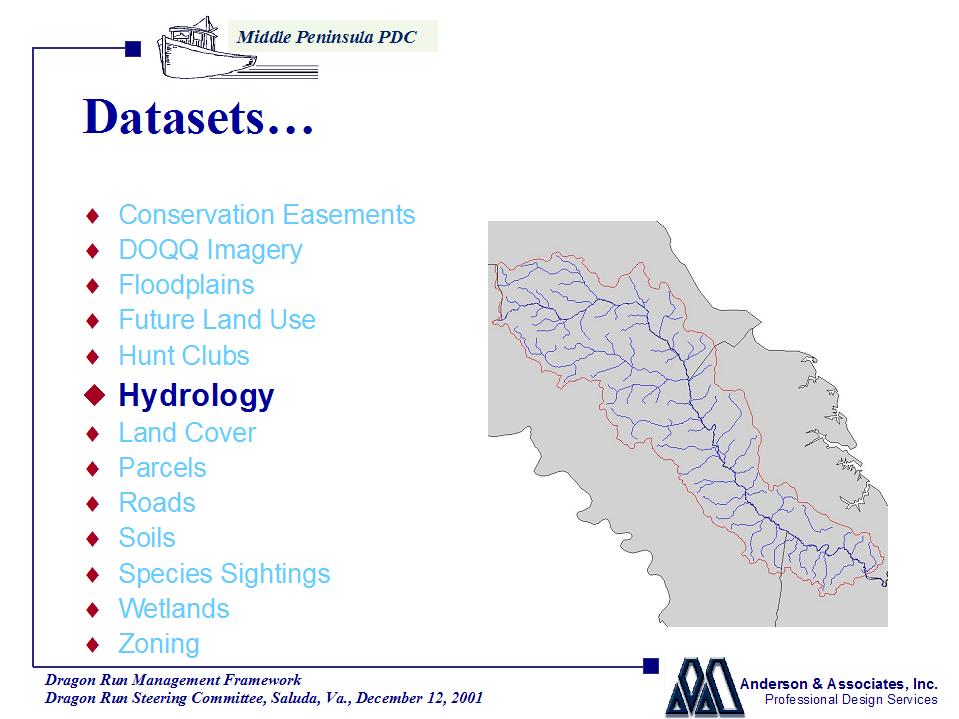
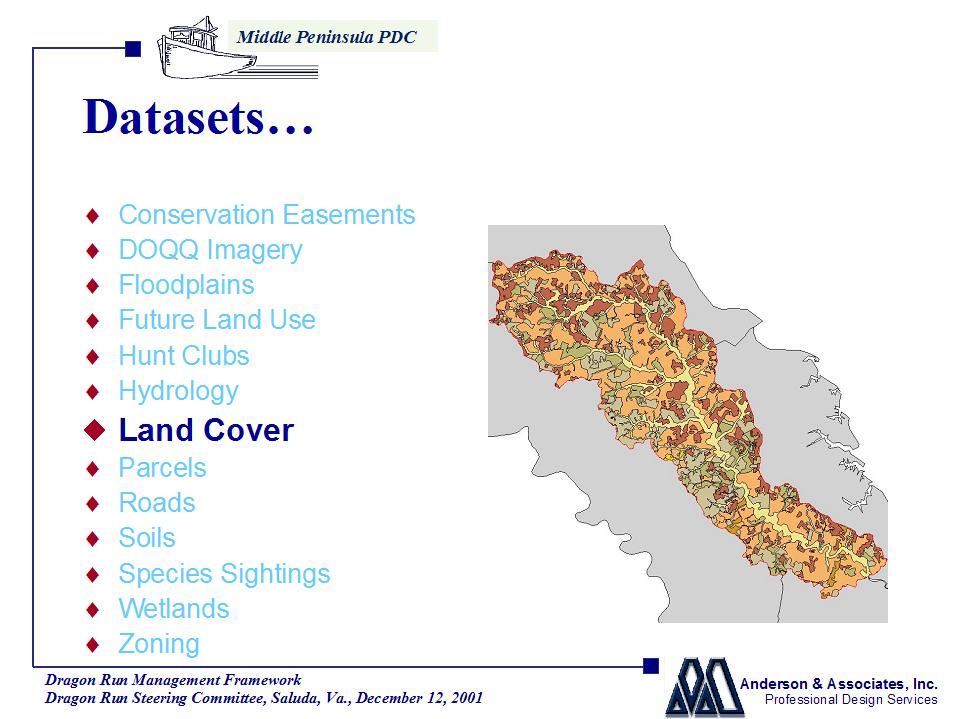
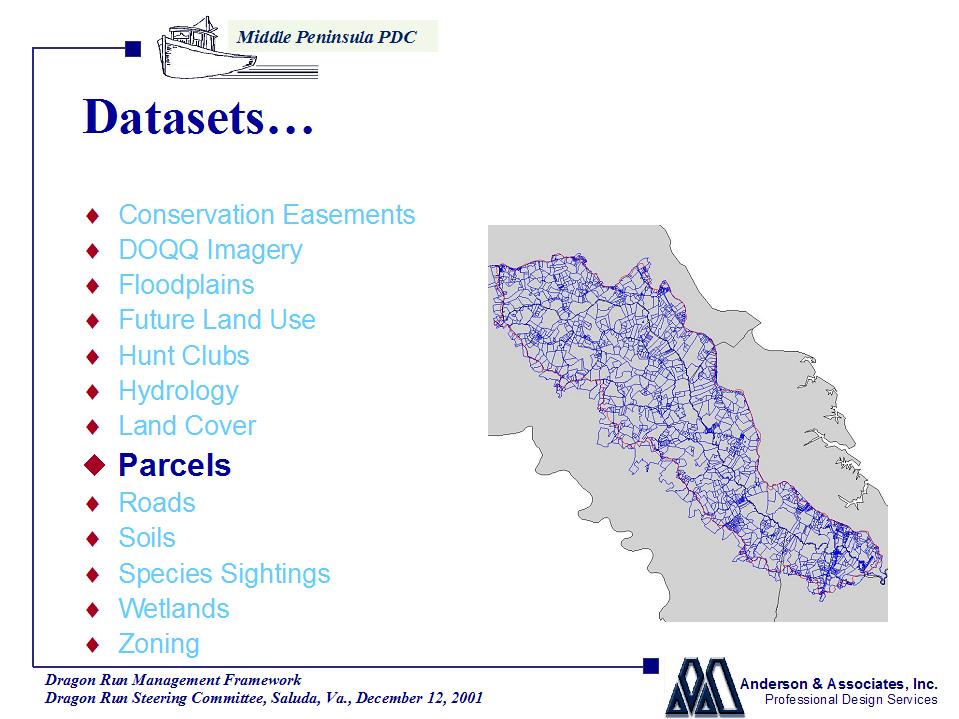
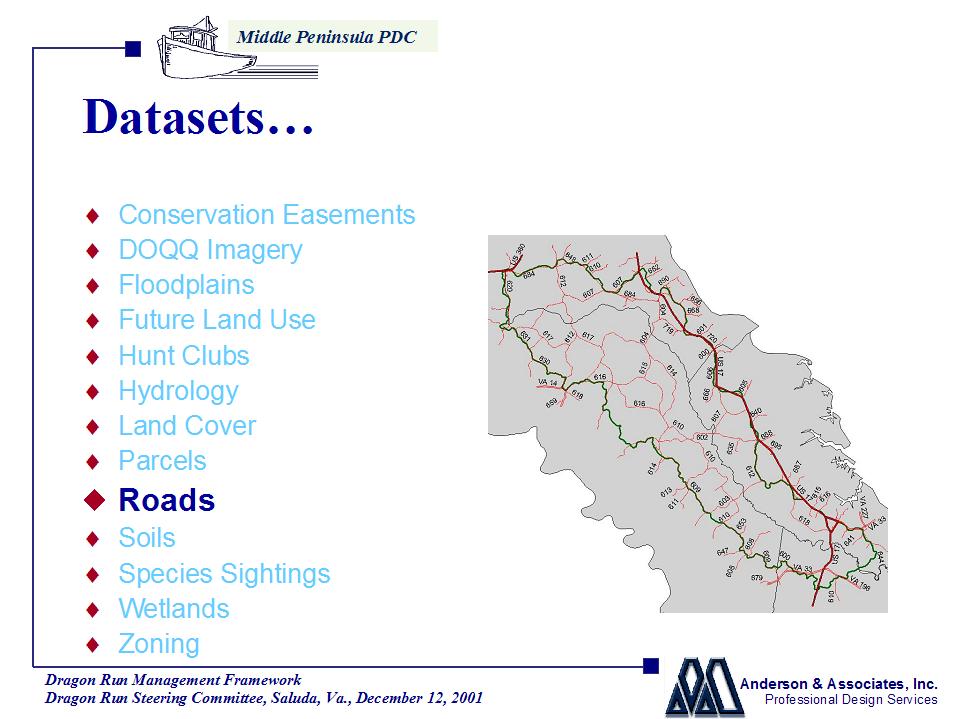
Datasets (Map prints) 6-19
Buildout Analysis 20
Composite Index 22-25
Economic Analysis 26
Hunting Values 26
Fishing Values 26
Wildlife Observation Values 27
Timber Values 27
Agricultural Values 27
Synopsis 28
Objective
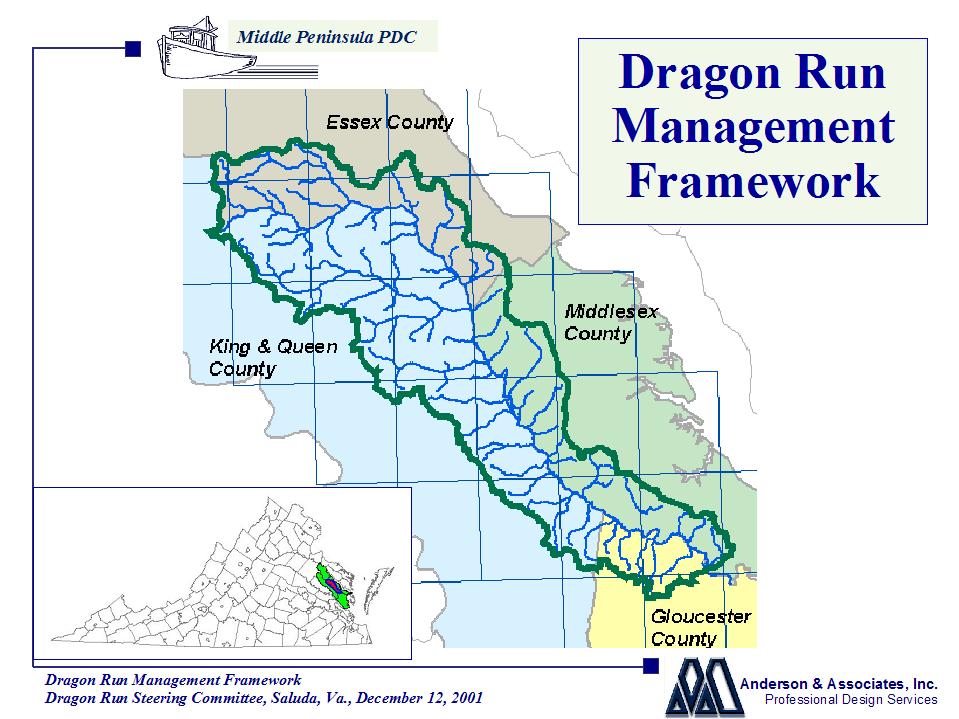
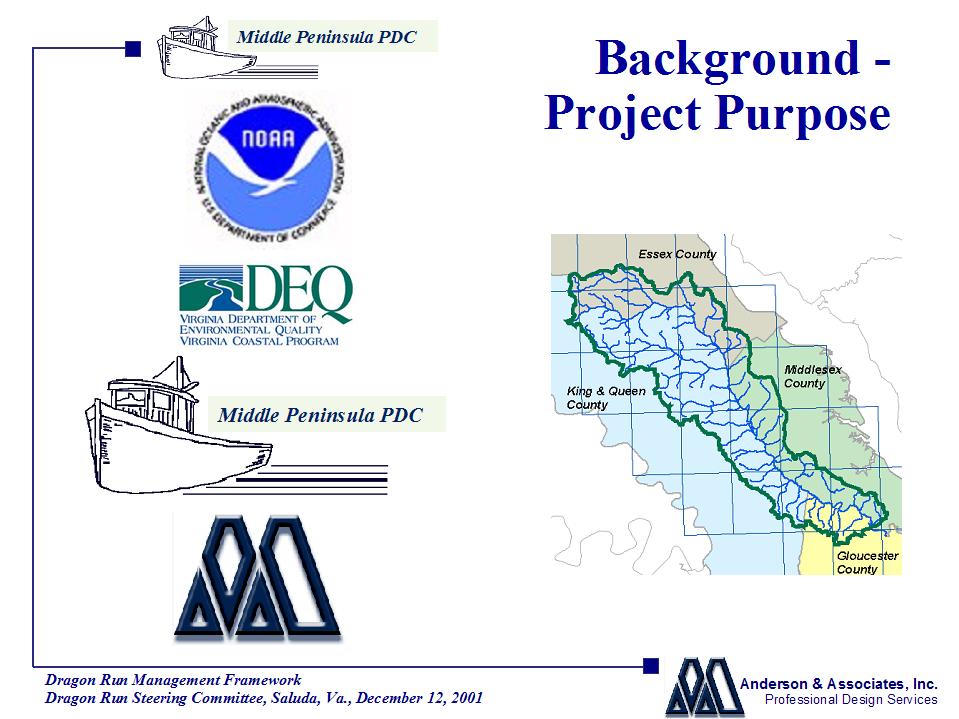
The Dragon Run Watershed has been recognized by the Smithsonian Institute as one of the most pristine watersheds in the country. As part of the movement to maintain the quality of this ecosystem, it was recognized that the value of an environmental GIS would be of great benefit in the stewardship of this area. As part of it’s "Special Area Management Plan", the Middle Peninsula Planning District Commission contracted Anderson & Associates to acquire and or generate datasets useful in the compilation of a spatial tool to serve in the administration of the watershed’s values to the citizens of the area and to those interested in it’s eco-tourism. Of special interest is the assignment of quantitative values to the Dragon’s eco-tourism pursuits such as hunting, fishing, and wildlife observation. Other concerns are directed at the possible damage development could do to the watershed and is discussed further with the graphics shown in the Buildout Analysis. The nearly 90,000 acre watershed is a jewel to be protected and this report is intended to display spatially the attributes of its value.
Data Acquisition
Through contact with various state, local and federal agencies, the following datasets were either acquired or digitally created.
County boundaries were obtained from Department of Conservation and Recreation’s Planning Division. These same boundary files are obtained from a wide variety of available sources. Basic information is found in the attributes such as county name and FIPS code.
Likewise, the Hydrology drainage and watershed delineations were obtained from the Virginia Department of Conservation and Recreation (DCR) – Planning Division in Richmond. The hydrology linework is intelligent in that each linear segment has attributes that relate to the subsequent segment downstream. These features will be important concerning the display of possible source point pollution problems and again, their impact downstream.
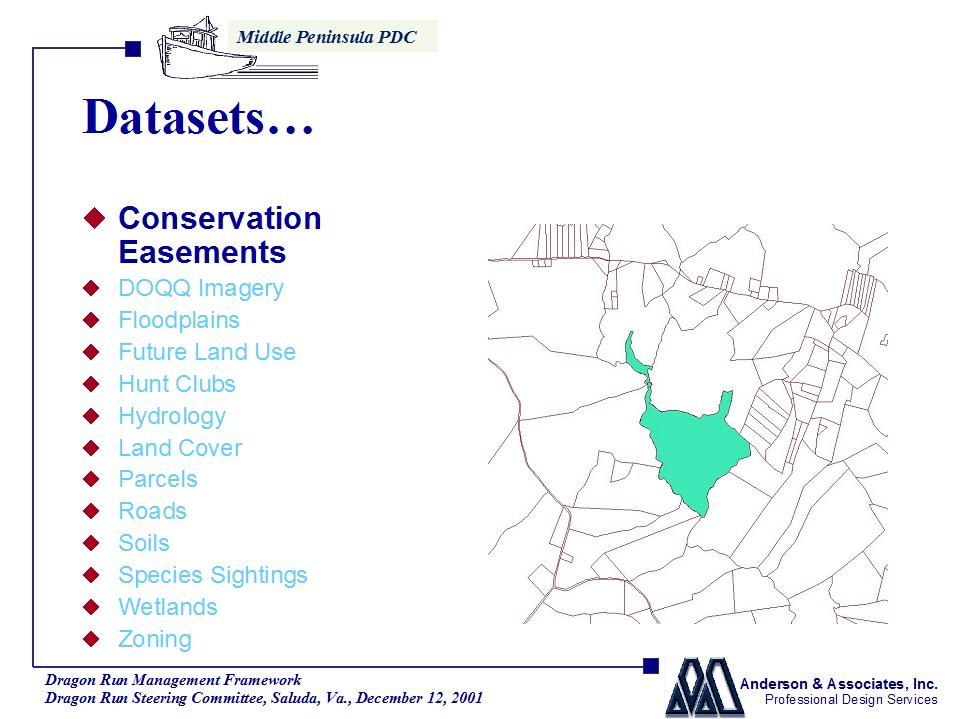
The Conservation Easements were digitized from hard copy maps obtained from contacts with the Middle Peninsula PDC as well as our contacts at the Virginia Outdoors Foundation. Ownership and administrative contact information if provided is shown.
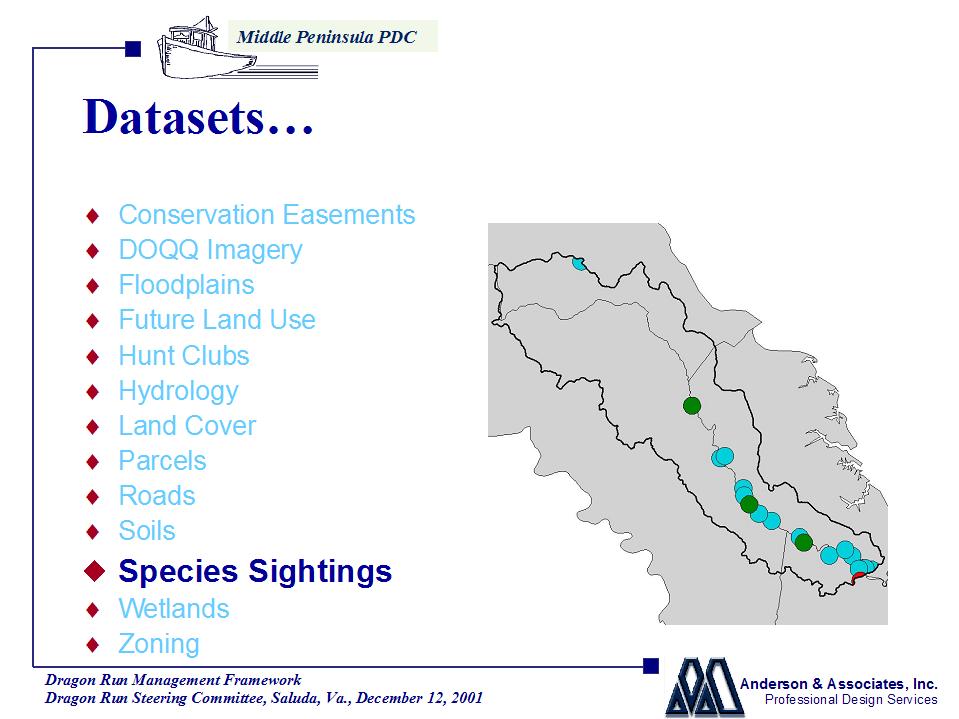
Natural Heritage Species site information was obtained from a different division of Department of Conservation and Recreation, the Division of Natural Heritage. Attribute information includes the species and purposely degraded location of rare and or exemplary species.
Colonial Water Birds and Threatened & Endangered Species site information was obtained courtesy of the Department of Game & Inland Fisheries’ Wildlife Diversity Division. Attributes for these two datasets include name of threatened species, date of observation, and again a purposely degraded location of these sightings or nesting areas.
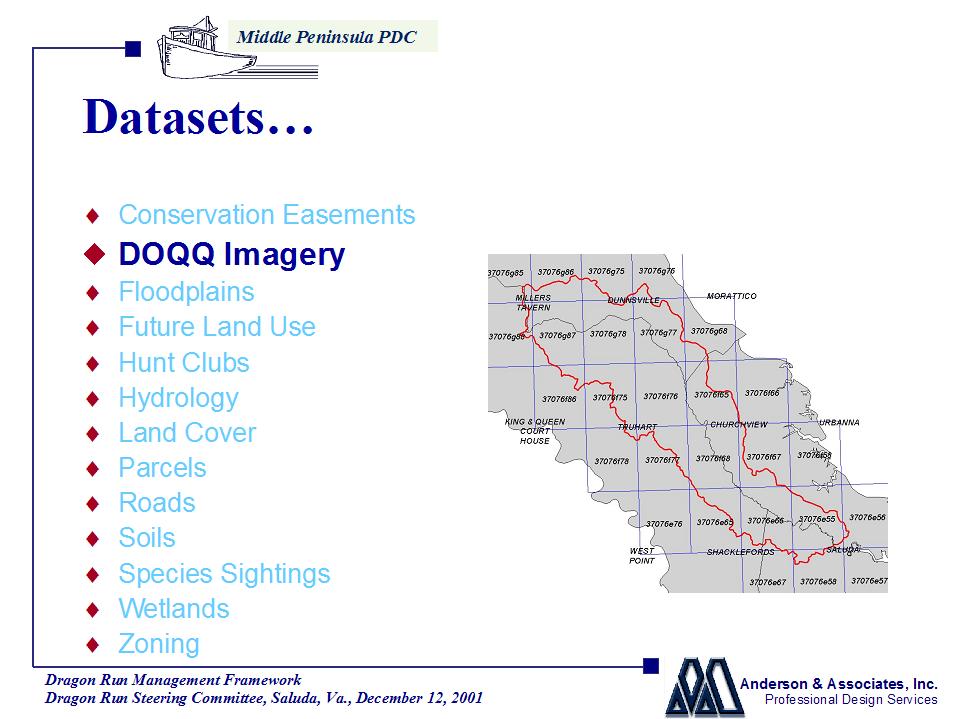
The Digital Orthophoto Quarter-Quads (also called DOQ’s or DOQQ’s) are obtainable from several sources – these are from our friends with the Virginia Economic Development Partnership. The DOQQ imagery includes the US Geological Survey (USGS) topographic quad name, it’s quadrant abbreviation, and the individual color imagery file name.
The digital topographic quads, commonly called DRG’s, are from the Virginia Department of Mines, Minerals, & Energy. These are scanned copies of USGS topographic quad maps commonly used as a base for referencing spatial features.
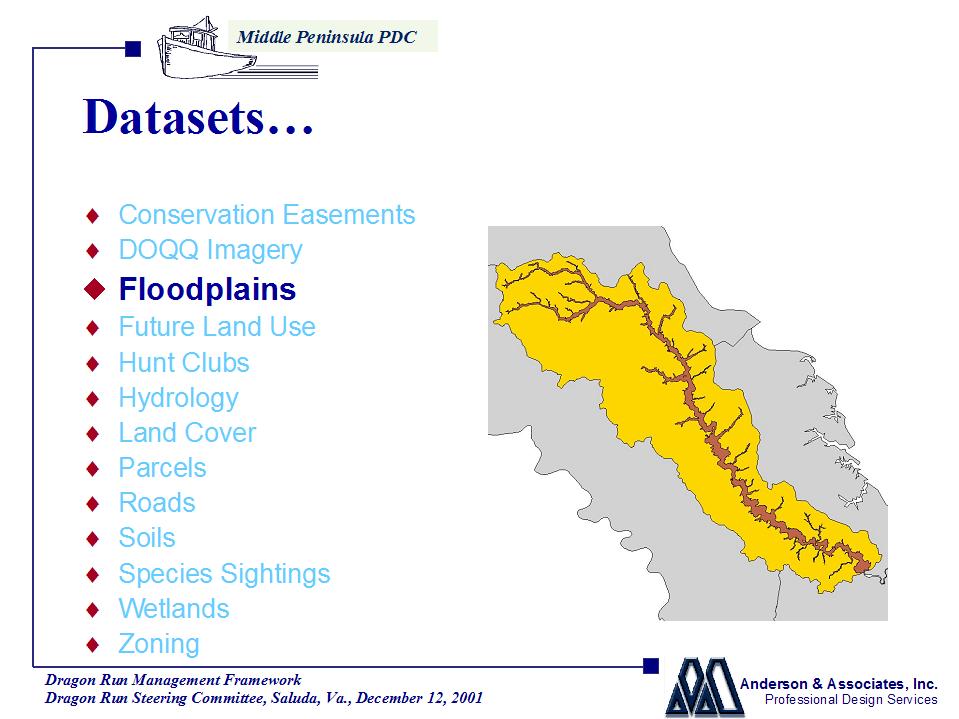
Floodplains information was digitized from scanned copies of Federal Emergency Management Agency’s FIRM maps. These maps were obtained for each county, digitized and compiled together to display the 100-year floodplain.
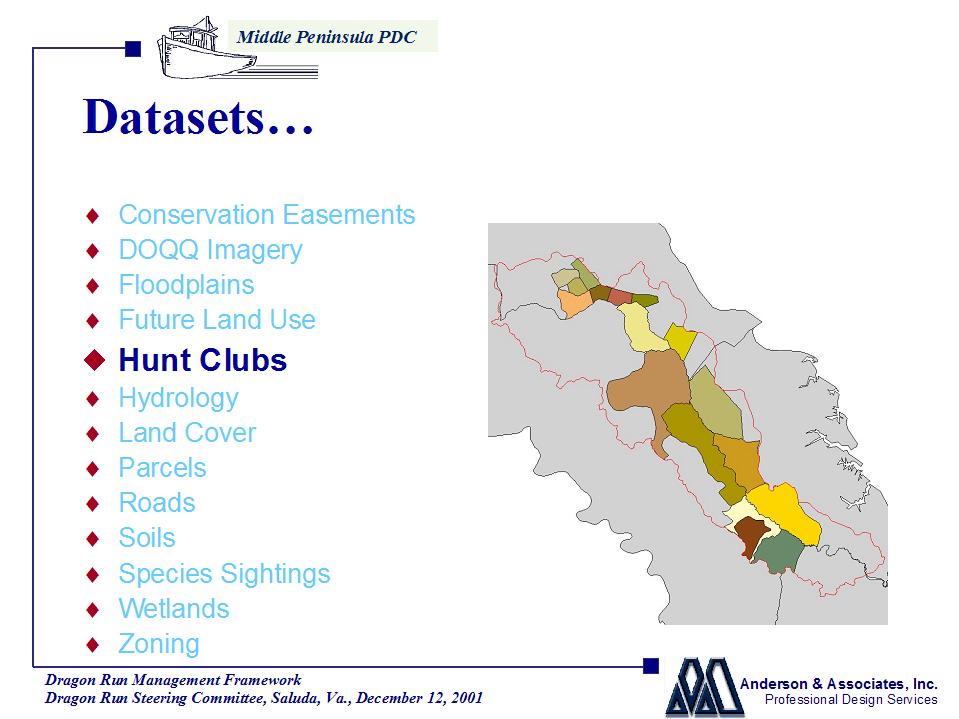
Hunt club area delineations were digitized from marked copies of county road maps. The areas were defined through Middle Peninsula PDC hunt club contacts and should be considered approximate. The attributes include acreage and contact information.
Landcover delineations were defined by review of the DOQQ imagery and divided into the following classifications: Wetlands, Hardwood Forests, Pine Forests, Mixed Forests, Agriculture, and Residential.
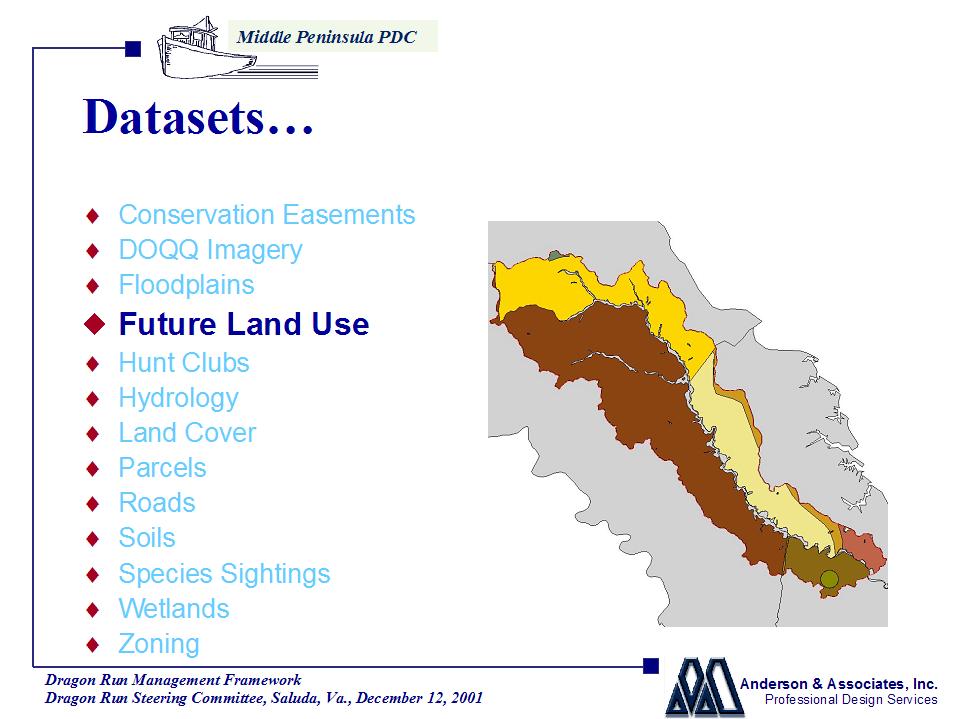
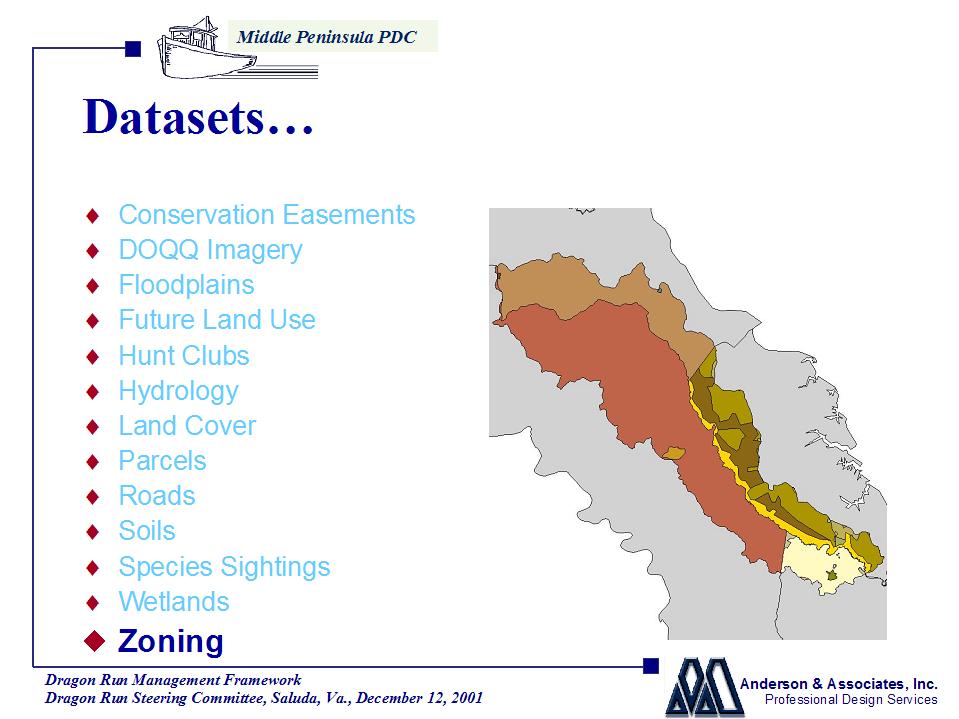
Future Landuse features were obtained from digitizing hard copy Comprehensive Plans from each of the four counties. The land use type was adopted from the hard copy plans.
Roads data was obtained from the Virginia Department of Transportation County map series road data. Attributes for these were directly adopted from the VDOT files including the more important parameters such as route number and road class type.
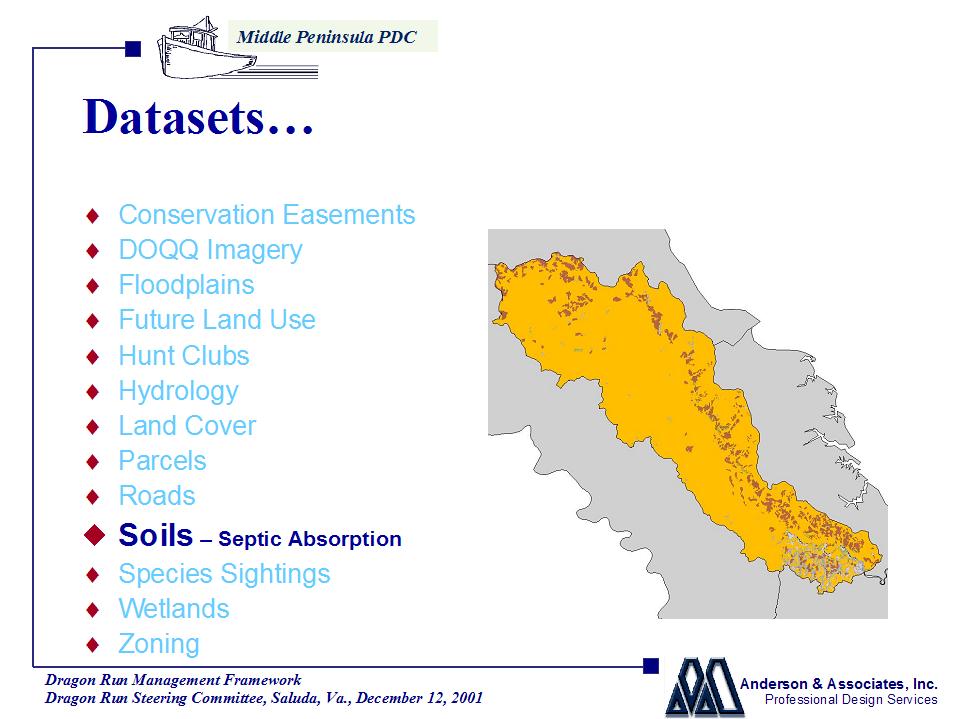
Soils’ data was obtained from the US Department of Agriculture’s Natural Resource Conservation Service. The soils data is extremely complex involving numerous table of attribute information. Specifically the rating attribute was obtained from the USDA manual Soil Survey Geographic (SSURGO) Data Base and refers to the following terminology:
620.03 Rating Terms
.Ratings for proposed uses are given in terms of limitations and restrictive features, suitability and restrictive features, or only restrictive features. Other features may be included for soil limitations that need to be overcome for a specific purpose.
(a) Limitation ratings.
A limitation rating identifies the degree of limitation that restricts the use of a site for a specific purpose.
Also from the same manual is information pertaining to ‘septic absorption’. Both of these sections are included here to display the septic absorption ratings for soils in the Dragon Run Watershed.
620.08 Sanitary Facilities.
(b) Septic tank absorption fields.
(1) Septic tank absorption fields are subsurface systems of tile or perforated pipe that distribute effluent from a septic tank into the natural soil. The centerline depth of the tile is assumed to be 24 inches. Only the soil between depths of 24 and 60 inches is considered in making the ratings. The soil properties and site features considered are those that affect the absorption of the effluent, those that affect the construction and maintenance of the system, and those that may affect public health.
(2) As shown in Table 620-17, the soil properties and qualities that affect the absorption of the effluent are permeability, depth to a seasonal high water table, depth to bedrock, depth to a cemented pan, and susceptibility to flooding. Stones and boulders and a shallow depth to bedrock, ice, or a cemented pan interfere with installation. Subsidence interferes with installation and maintenance. Excessive slope may cause lateral seepage and surfacing of the effluent in downslope areas. Also, soil erosion is a hazard where absorption fields are installed in sloping soils.
(3) Some soils are underlain by loose sand and gravel or fractured bedrock at a depth less than 4 feet below the distribution lines. In these soils the absorption field may not adequately filter the effluent, particularly when the system is new; as a result, the ground water supply may be contaminated. Soils that have a hazard of inadequate filtration are given a severe rating.
(4) Percolation tests are used by some regulatory agencies to evaluate the suitability of a soil for septic tank absorption fields. These tests should be performed during the season when the water table is highest and the soil is at minimum absorptive capacity. The percolation rates do not correspond to the permeability rates because they are measured by different methods. Experience indicates that soils that have a percolation rate faster than 45 minutes per inch function satisfactorily, soils that have a rate between 45 and 60 minutes per inch have moderate limitations, and soils that have a rate slower than 60 minutes per inch have severe limitations. (U.S. Department of Health, Education and Welfare, Public Health Service, l969 Manual of Septic Tanks, PHS Publication No. 526, p. 8)
(5) In many of the soils that have moderate or severe limitations for septic tank absorption fields, it may be possible to install special systems that lower the seasonal water table or to increase the size of the absorption field so that satisfactory performance is achieved.
(New Concepts in Soil Survey Interpretations for Onsite Disposal of Septic Tank Effluent, J. Bouma 1974.) However, such systems are not considered in this guide.Additional information pertaining to Soils can be found at the USDA-NRCS home page found on the web at
http://www.nrcs.usda.gov. Also additional information on SSURGO soils can be found at http://www.ftw.nrcs.usda.gov/ssur_data.html. SSURGO is an acronym by the USDA Natural Resources Conservation Service and stands for "Soil Survey Geographic" (data base).A point-coverage of residential buildings or Structures was developed by reviewing the digital orthophotography for the locations of perceived residences. Approximately 1300 structures or clusters of structures (including barns and accessory buildings) were located.
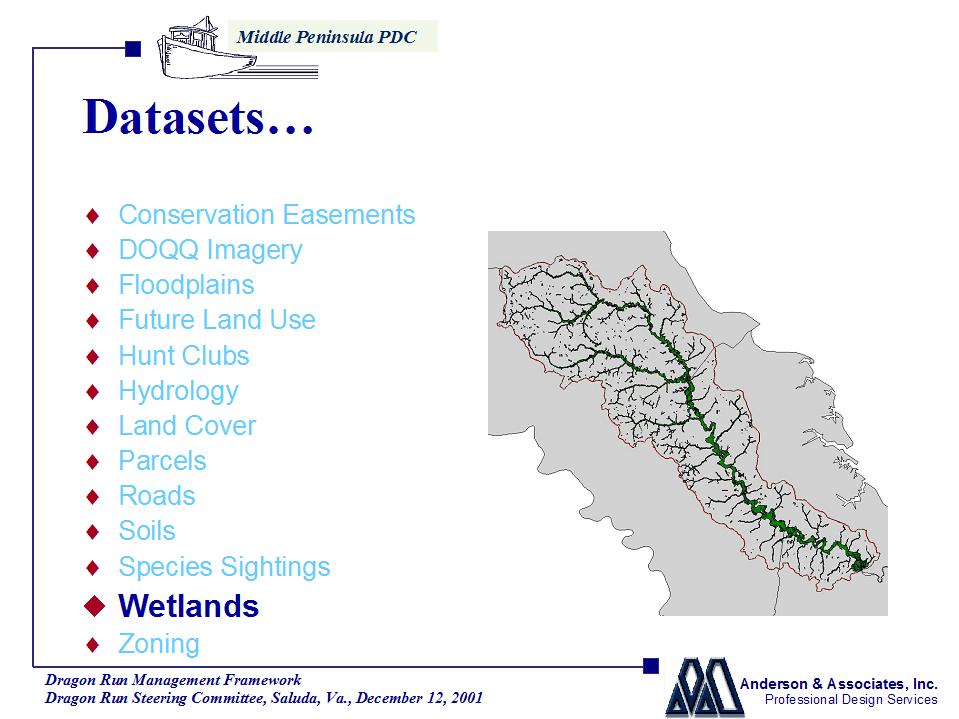
And lastly Wetlands information was obtained from the US Department of Fish and Wildlife Service. Wetlands information was downloaded from the web and merged together to create a composite file. Additional detail concerning wetlands can be found at
http://www.nwi.fws.gov/.Map Projection
The desired map projection was requested to be a modified Lambert Conformal Conic projection used by VDOT, VEDP and other agencies. Digital datasets not in this projection were reprojected to the following spatial reference taken directly from the metadata:
Spatial_Reference_Information:
Horizontal_Coordinate_System_Definition:
Planar:
Map_Projection:
Map_Projection_Name:
Lambert Conformal ConicLambert_Conformal_Conic:
Standard_Parallel:
37.500000Standard_Parallel:
39.000000Longitude_of_Central_Meridian:
-79.500000Latitude_of_Projection_Origin:
36.000000False_Easting:
0.000000False_Northing:
0.000000Planar_Coordinate_Information:
Planar_Coordinate_Encoding_Method:
coordinate pairCoordinate_Representation:
Abscissa_Resolution:
0.002048Ordinate_Resolution:
0.002048Planar_Distance_Units:
metersGeodetic_Model:
Horizontal_Datum_Name:
North American Datum of 1983Ellipsoid_Name:
Geodetic Reference System 80Semi-major_Axis:
6378137.000000Denominator_of_Flattening_Ratio:
298.257222Metadata
Metadata for all vector datasets has been generated and is viewable in XML (Extensible Markup Language) format. The metadata includes additional information other than the spatial reference above. It also includes abstract and dataset definition as well as source contact citation information.
The following pages are maps of the datasets comprising the Dragon Run Watershed GIS.
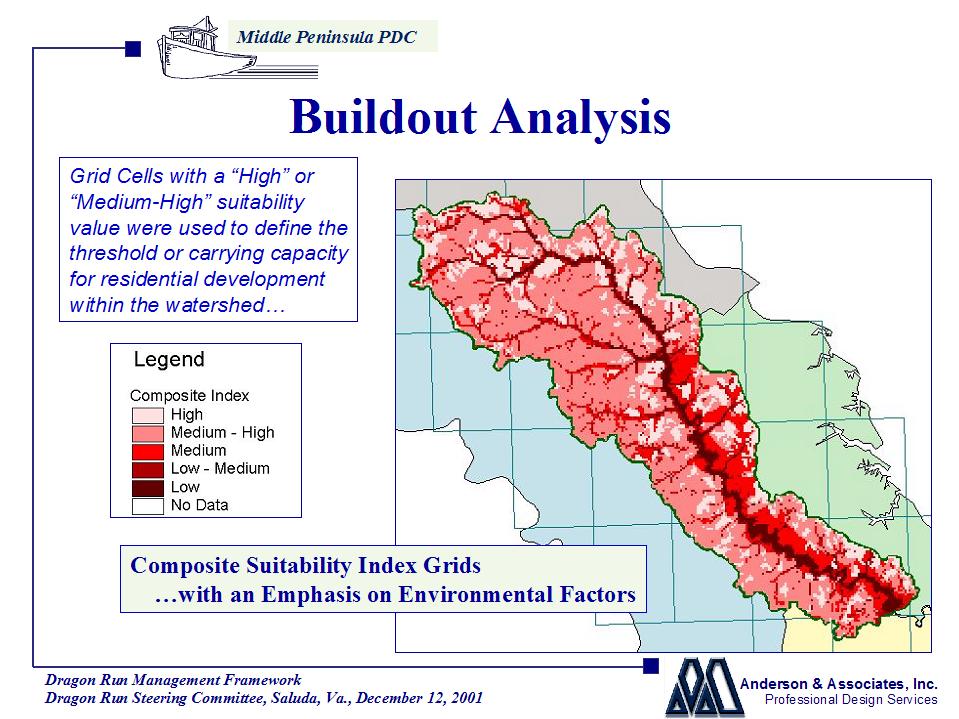
Buildout Analysis
With the intention of developing buildout potential or residential carrying capacity, a variety of datasets were brought together to create a composite index to display the areas most suitable to build and where the areas of highest conservation exist. To this end we created Grids from shapefiles using ArcView Spatial Analyst. To identify these areas more fully, we utilized the following datasets:
Two Buildout Analysis composite grids were created. One composite grid displays the locations of suitable build based strictly on "build-compatible" values meaning you cannot build on wetlands but there is no present restriction to build within a set distance of an observed bald eagle nesting site. For the composite suitability values, the higher the value, the higher the suitability of development.
The second composite grid displays the locations of suitable lands using the layers listed above. This grid displays more of an environmental sensitive depiction. The features shown in the data (and the plots in the report) were compiled from eight separate grids with the suitability value 'summed' from the contents of each of the eight. Concerning the environmentally emphasized buildout grid, the higher the value, the higher the un-suitability of development.
In more detail each of the layers were defined their own suitability value. These were:
- Wetlands grid cells were either defined with a value of 1 or 10
- Both DGIF Threatened and Endangered species and DCR Natural Heritage species sightings' areas were given a grid cell value of 100, remainder of watershed was given a value of 1.
- Slope grid cell values were defined as 1 or 10 - as they terrain is relatively flat, there was little variance outlined here.
- Landcover grid cell values were defined as 1 (agriculture), 10 (forested lands or residential areas), 100 (wetlands).
-Zoning grid cell values were defined as 1 (commercial, industrial), 5 (residential or agricultural-type classifications), or 10 (conservation-type classifications).
- Conservation easements' grid cells were given a value of 10 where they exists and 1 for the remainder of the watershed.
- Floodplain grid cells were given a value of 100 if they exist inside of the 100-year floodplain and a value of 1 for all else in the watershed.
- Soils septic suitability was NOT compiled into the composite index because of questions to the data pertaining to the classification. Indications are that it is a classification based on the soils natural criteria not taking into consideration the possibility of improvements provided by an engineered solution. However the grid was included in the data deliverables and has suitability index values of 1 (slight), 5 (moderate), or 10 (severe).
To explain it another way, datasets displaying a highly conservative feature such as wetlands delineation or a known bald eagle sighting, were given a very high un-suitability factor. For those datasets where there was a median value for a given feature, such as zoning, then likewise a middle of the road value was defined for the grid cells associated with that feature.
The environmentally emphasized composite grid was created from a total of the above and the suitability values were summed. For comparison against the zoning theme, we identified those areas with a composite index suitability value lower than 26 to study the buildout potential for the watershed.
Grid cells with a suitability value less than 26 were converted to a shapefile along with their associated original zoning classification. Next a review of each county’s Comprehensive Plans was studied to determine minimum lot sizes for each zoning category in all four counties. Because the intent was to define the carrying capacity of residential development within the watershed, a display of "theoretical parcels" or "lots" was created based on the minimum lot size for each zoning classification.
To create arbitrarily a layout of theoretical lots was not possible, but a series of shapefiles were created based on these minimum lot sizes. The lots found in these shapefiles were shown with horizontal and vertical lines as edges. These theoretical lot shapefiles were merged together to display a composite of lot sizes again based on zoning classification.
The total lots defined from this methodology yielded 38,208 theoretical parcels.
The Buildout Analysis layer is shown on the following page and define development potential based on our restrictions from environmental factors and existing zoning regulations in place at this time.
Economic Analysis
It is difficult to quantify values associated with the development of forested or rural areas. Various factors have been identified in studies ranging from sediment accrual to ozone depletion to eco-tourism.
The Dragon is popular with both residents and non-residents alike in it’s diversity of wildlife. Situated in a rural environment where traditional hunting and fishing are ways of life, the watershed is visited by any fishing enthusiast willing to portage a canoe over the numerous logjams present. Or the hunt clubs that straddle both edges of the wetlands areas that have existed in the area for generations. Or the nature lover desiring nothing more thane a quiet canoe ride or quietly observing the variety of birds present, including the occasional bald eagle. These are all pursuits that have value but how to quantify them in financial terms?
A valuable resource defining these activities is the 1996 National Survey of Fishing, Hunting and Wildlife-Associated Recreation. For ease of reference, this report will quote this document as the "Survey". This report outlines trip-related expenditures as "food and lodging, transportation, and other expenses such as equipment rental or boat fuel". This definition will be utilized concerning the following expenses.
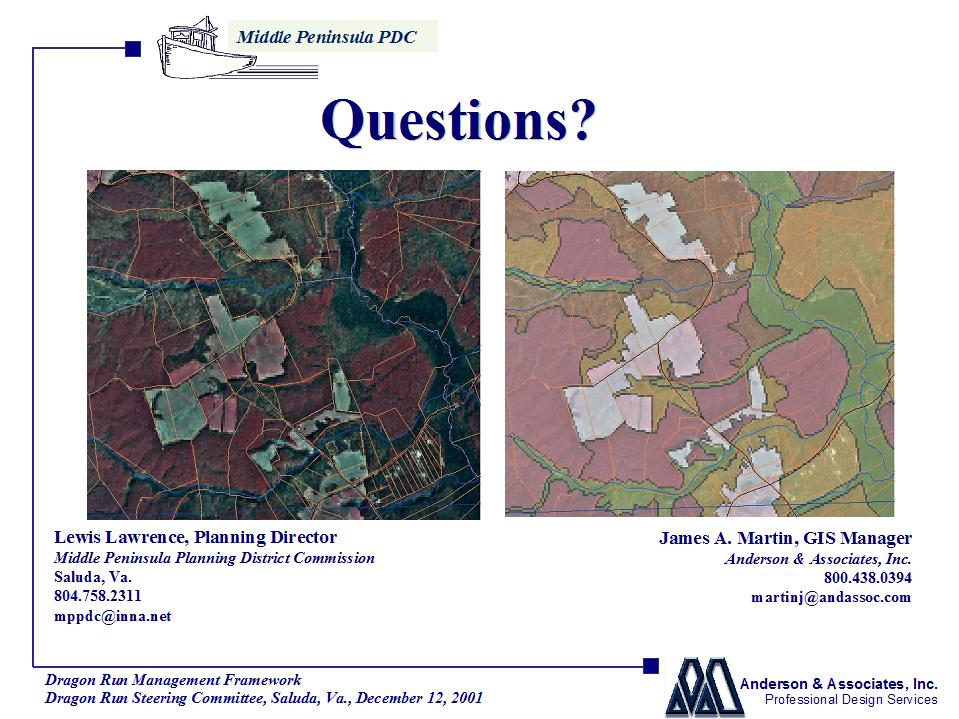
A note concerning the imagery is important to observe prior to the subsequent issues discussed here in this report. This imagery was obtained from state agency sources that obtained these from USGS released othophotography. Imagery covering the watershed was taken in March 1994 and March 1995. Landcover is indicative of the features present at that time.
Hunting Values
Per Matt Knox, Deer Program Supervisor with the Virginia Department of Game & Inland Fisheries (DGIF), "Virginia's white-tailed deer represent a beneficial economic and social resource… Unquestionably, the considerable aesthetic and social values of white-tailed deer contribute a significant proportion of Virginia's non-consumptive wildlife value."
The Survey notes that Virginia in-state hunting expenditures were $98 million dollars. Assuming a total of 25,396,480 acres (39,682 sq mi) in Virginia and a DGIF recognized value of 79% of Virginia is defined as "hunt-able lands", this indicates 20,063,219 acres of hunting lands in the Commonwealth. Dividing $98,000,000 by the hunt-able lands acreage, a hunter expenditure rate is $3.86/acre per year is defined. This rate yields a total hunting value of $162,282 covered by hunt club lands alone within the watershed (42,042 acres). If all non-commercial, non-residential lands were defined (88,605 acres), this figure would grow to $342,015.
Per Matt Knox, the median lease rates documented from the Department's Deer Management Assistance Program (DMAP) statewide average is $3.50 per acre. Assuming this statewide average lease rate, an additional annual value of $147,147 is defined by the 42,042 acres of hunt club lands within the watershed. Adding the combined hunter expenditures to the hunt club lease values, a total hunting value within the watershed is $309,432.
Fishing Values
Fishing values were again obtained from the 1996 Survey. Per Fred Leckie, Assistant Chief of Fisheries with the Department of Game & Inland Fisheries, there is a general display of 2500 miles of "fish-able" waters in Virginia. Per the Survey, there was $314 million in trip related expenses for fishing in Virginia in 1996. In Table 16, the Survey further indicates nearly $226 million in revenues associated with "food/lodging, transportation, and other trip costs".
The Survey also breaks down fishing into a ratio of 53% ponds/lakes and 47% rivers/streams. Therefore, 47% of the $225,926,000 in non-equipment related expenses for freshwater fishing in Virginia equates to $106,185,220. Assuming a total length of 2500 channel miles in Virginia, then an index of $42,474 per mile is defined. Spatial Analyst reveals a length of 38.72 miles of the main channel of Dragon Run. This translates to $1,644,593 in fishing related value on the Dragon.
Wildlife Observation Values
Again using a total of 25,396,480 acres in Virginia, the annual non-consumptive wildlife observer expenditure rate per acre is $7.76. This rate yields a total wildlife observation value of $108,807 covering only the areas classified as wetlands within the watershed. While wildlife observation is enjoyed throughout the watershed, areas defined as agriculture for example probably do not sustain the same level of interest as areas where there is less disturbance to the natural setting. Therefore the expenditure rate was assigned only to the 14,021 acres classified as wetlands within the watershed.
Again these figures relate to probable areas of the watershed utilized for these activities. The total figures for each are:
Hunting $147,147
Fishing 1,644,593
Wildlife Observation 108,807
Total $1,900,547
Timber Values
Timber values were obtained using indices provided by timber contacts of the PDC. Values for "mixed forests", "pine forests" and "hardwood forests" were assigned to each feature. There are a total of 58,101 acres of forested areas within the watershed. This figure includes 6843 acres of hardwoods, 14,084 acres of pine forests and 37,174 acres of mixed forests. Total forested values within the watershed at the date of imagery were:
Hardwood forests $6,500,810
Pine forests 24,421,765
Mixed forests 41,572,525
Total $68,495,100
While these values have been obtained using spatial analysis, it should be noted that they are based on statewide indices. Actual values are much more difficult to obtain short of extensive on-site surveying. However these do provide an indication of the potential value found within areas of the watershed. It is recognized that cypress forests are present in the watershed yet they were not assigned a unique feature in this phase of this project.
Agricultural Values
Agricultural values are important to the existing use of these lands within the watershed. Farming (crops and livestock) is an integral part of the economies of the counties comprising the region of the watershed. Statistics to identify the values of these agricultural lands are based on the 2000 Virginia Agricultural Statistics Bulletin and Resource Directory, 1997 Agricultural Census obtained from Kevin Harding, Agricultural Statistician with the US Department of Agriculture’s (USDA) Virginia Agricultural Statistics Service.
Total acreage in farms Total cash receipts
King and Queen County 50,823 $10,171,000
Middlesex County 18,263 5,189,000
Gloucester County 23,211 5,068,000
Essex County 61,538 10,287,000
153,835 $30,715,000
Average value per acre $ 199.66
There are 16,482 acres defined as Agriculture in the landcover dataset. This total acreage multiplied by the above average value per acre yields a total agricultural value of $3,290,796 within the watershed.
Synopsis
The GIS accompanying this report is intended to assist the Middle Peninsula Planning District Commission with it’s Special Area Management Plan (SAMP) by supporting the continued stewardship of the land to minimize the sometimes destructive elements associated with improper development of encroaching suburbanization. The GIS will allow for the spatial review of future decisions to ascertain their potential impact on the environment of this ecosystem. The Dragon Run Watershed GIS will also assist in the preservation of traditional land uses by outlining the damage inflicted if the watershed’s size or quality is reduced. It is also intended to serve as a planning tool for agencies within the surrounding municipalities of Essex, Gloucester, King & Queen, and Middlesex counties.
GIS Project Manager
GIS Project Manager
GIS Project Manager
GIS Manager
Anderson & Associates, INC.
Virginia - North Carolina - Tennessee
WEB:
www.andassoc.comProfessional Design Services
Engineering~Land Survey~Web~IT~GIS
GIS:
www.webgis.net______________________________________________
David Fuss
Director, Dragon Run Special Area Management Plan
Middle Peninsula Planning District Commission
Saluda Professional Center, Bowden Street
http://www.mppdc.com/projects/dragonSAMP.htm