Marcia Tucker
Systems Infrastructure Group Leader
Washington Suburban Sanitary Commission
Amymarie R. Corriveau
Systems Analyst
CDM
Abstract: The Washington Suburban Sanitary Commission (WSSC) has been tasked with an aggressive program for the replacement of aging water mains in a two-county region of Maryland. Beginning in fiscal year 2002, eight miles of water mains will be replaced. While this represents a 30% increase in the amount of mains replaced, it can only address less than 0.1% of the overall system. For this reason, the WSSC must be able to quickly analyze a large amount of information on pipe conditions, work histories, and geographic location in order to direct the replacement work to the highest priority needs. Making these decisions requires much more aggressive and effective use of WSSC's legacy Maintenance Management Information System (MMIS) data and Geographical Information System (GIS). To support this task, Camp Dresser & McKee (CDM) developed a MapObjects application for the WSSC Systems Infrastructure (SI) Group. The custom application allows WSSC to capitalize on its extensive historic and spatial data to make more prompt, educated, and efficient decisions regarding capital outlays to meet customer needs for reliable, clean water.
The Washing Suburban Sanitary Commission (WSSC) was established in 1918 and provides water and sewer services to two counties, Prince George's County and Montgomery County. The Systems Infrastructure (SI) Group is a department within the Engineering and Construction Team at WSSC and their core responsibilities are to investigate and analyze all existing water and sewer pipeline systems, plan and design contracts under the water replacement program, the water main cleaning and lining program, and the sewer rehabilitation program, develop and maintain design and construction standards and guidelines, and provide technical support to other Groups in disciplines such as structural, geotechnical hydraulic, corrosion and general civil engineering at WSSC. In 2001, the SI Group was tasked with developing an aggressive water main replacement program in coordination with sewer rehabilitation over the next six years. Current WSSC plans indicate that beginning in fiscal year 2002, eight miles of water mains will be replaced. This number will increase incrementally to twenty (20) miles of water mains by fiscal year 2007. In order to accomplish these objectives and efficiently manage the infrastructure replacement and rehabilitation programs, the SI Group must modify its current process for selecting replacement and rehabilitation candidates and employ more automated methods.
Historically, the water-main replacement program was driven largely by a manual process. Essentially, the SI Group printed out pertinent information from its Maintenance Management Information System (MMIS), manually reviewed and analyzed the information, and plotted the high maintenance areas by hand. The number and frequency of maintenance events were analyzed and based upon the review, mains were manually selected for replacement. The SI Group performed this process for both area-wide replacements and localized replacements (street-specific). WSSC's SI Group realized that if they were going to meet their goals for the main replacement program, they needed a much more efficient method for analyzing the maintenance records. They recognized that in order for them to efficiently manage their new main replacement program, the current manual method for identifying candidates for main replacement had to be abandoned and replaced with a more technology-focused solution. Ultimately, through work with Camp Dresser & McKee Inc. (CDM) and the development of the Utility Information Management Decision Support System (UIMDSS), the SI Group has been able to improve the efficiency of identifying main replacement candidates and fully capitalize on WSSC's extensive historic and spatial data to make more prompt, educated, and efficient decisions regarding capital outlays.
The Utility Information Management Decision Support System (UIMDSS) is a MapObjects application that assimilates GIS data, in Esri shapefile format, with maintenance history stored within an Access 2000 database. The database is also used to perform the replacement/rehabilitation algorithm WSSC's SI Group defined to identify candidates for immediate replacement, long-term candidates for replacement, and candidates for cleaning and lining.
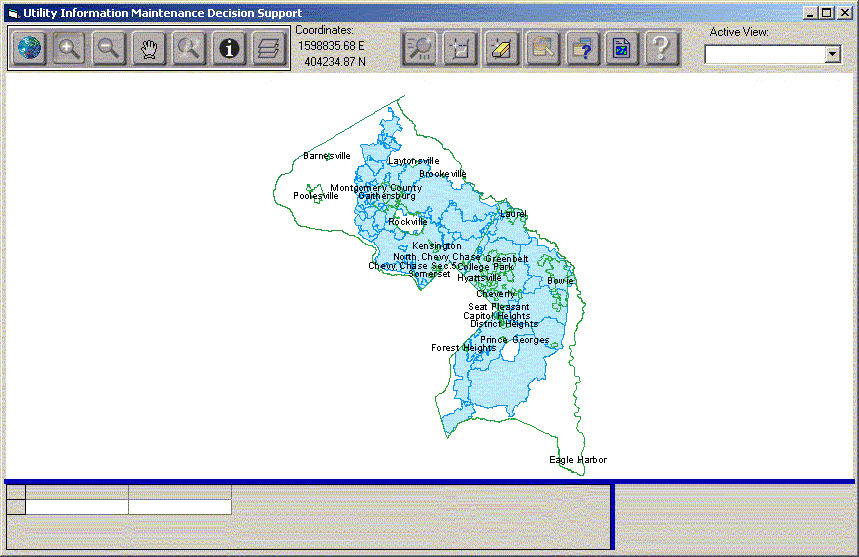
Figure 1 illustrates the application's main interface. From this interface, users can perform basic GIS mapping functions such as zoom, pan, and identify. Also from this interface, the users can initiate the replacement/rehabilitation analysis.

Figure 1: UIMDSS main interface.

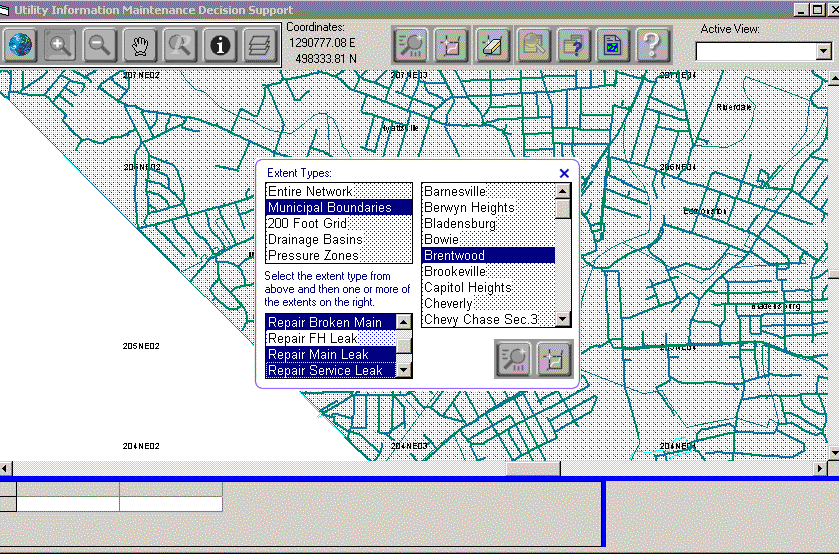
Figure 2: Initiation of replacement/rehabilitation analysis.
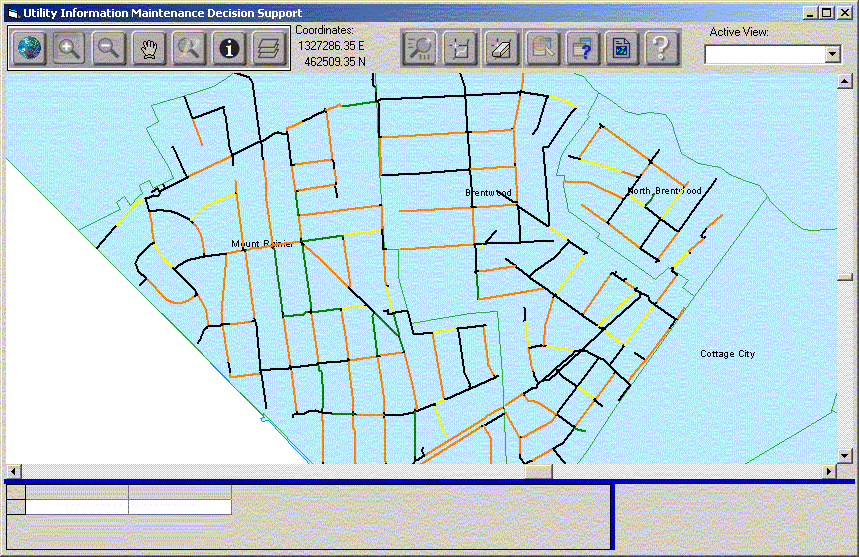
The extent and type of replacement/rehabilitation analysis performed within the application is driven by the user. As illustrated in Figure 2, the user selects the extent and the maintenance activities to include in the analysis. The analysis can be performed on WSSC's entire water system or within user-selected municipal boundaries, 200-foot grid boundaries, or pressure zones. After determining the extent of the analysis, the user must then specify the maintenance activities that should be included within the analysis. The SI Group identified eight major maintenance activity categories : 1) Discolored Water, 2) Performance, 3) Broken Main Repairs, 4) Fire Hydrant Leak Repairs, 5) Main Leak Repairs, 6) Service Leak Repairs, 7) Valve Leak Repairs, and 8) Routine Flushing. After the extent and the maintenance activities are selected, the application runs the analysis on the selected pipes, and displays the results thematically. Pipes in red represent immediate replacement candidates, pipes in green represent long-term replacement candidates, pipes in yellow represent cleaning and lining candidates, and pipes in black do not meet any of WSSC's replacement/rehabilitation criteria. Figure 3 illustrates the results of the replacement/rehabilitation analysis for three municipal boundaries within WSSC's service area. The user can print the results of this analysis, print a report containing the details of the pipes and their replacement/rehabilitation categorization, or they can clear the analysis and perform additional analyses using additional extents and/or maintenance activities.

Figure 3: Results from replacement/rehabilitation analysis.
As discussed previously, the UIMDSS relies upon maintenance information that is stored within an Access 2000 database. This information originated from WSSC's maintenance management information system (MMIS), which is housed on a mainframe. The MMIS system stores its data in an Integrated Database Management System (IDMS), which is a flat-file database that also resides on the mainframe. MMIS contains maintenance history that dates back to 1974 through the present. All maintenance activity that is performed on WSSC's infrastructure is tracked in the MMIS. To date, there are roughly 10, 000 miles of pipes and 425,000 customers with multiple records documenting maintenance activities relating to an asset in the MMIS. This includes corrective maintenance (e.g., clear sewer main), complaints (e.g., discolored water concerns), preventive maintenance (e.g., clean catch basin), and capital/construction work (e.g., water and sewer rehabilitation).
WSSC maintains its GIS data in SDE, yet the data is distributed to the users in shapefile format. WSSC has all of its water infrastructure (water mains and appurtenances), sewer infrastructure, and landbase (municipal boundaries, grids, pressure zones, etc.) in GIS. Prior to using this data within the UIMDSS, CDM performed a number of data cleanup procedures. These procedures were performed to ensure a one-to-many relationship could be established between the GIS data and the maintenance history from the MMIS.
The real benefit of the UIMDSS is the replacement/rehabilitation algorithm. The algorithm evaluates the type of the maintenance activity selected by the user, calculates the frequency of that maintenance event per unit pipe length, applies a weighting factor according to the type of maintenance activity, and generates an aggregate score for each pipe. The combination of these factors determines the replacement/rehabilitation category of the pipe. Engineering principals and statistical analyses defined the criteria and thresholds used for each of the categories. The algorithm categorizes the water mains selected for the analysis as follows:
Water mains defined as Replacement Candidates are the most critical pipes in the system. These pipes have the most significant maintenance history and were identified using the following logic:
Water mains defined as Long-Term Planning Replacement Candidates have had repairs, however, not significant enough to warrant immediate replacement. Water mains in this category may be upgraded to Replacement Candidates if WSSC is already performing work within the neighborhood or street paving is planned, thus saving extensive street restoration costs. However, most of these pipes are scheduled for future replacement. The following logic was used to identify these candidates:
The third category, Cleaning and Lining Candidates, represents pipes that are unlined, cast iron, are relatively young in age, and have less significant maintenance history. These mains were identified using the following logic:
The fourth classification, the No Action category, represents all other water mains that have performed well and with an acceptable level of maintenance history. These pipes do not meet any of the aforementioned criteria.
As the aforementioned logic indicates, the algorithm was designed to account for the frequency of maintenance activities, as well as factoring in the impact of the overall maintenance activities performed on the main - the "Overall Score". Because not all maintenance activities have equal bearing in the replacement/rehabilitation assessment, the full collection of maintenance activities to be used in the analysis, as well as their corresponding weight factor, had to be defined in order to quantify the "Overall Score". The information contained within Table 1 represents the maintenance activities and weight factors used in calculating the Overall Score.
Table 1: Maintenance activities and weighting factors to calculate the "Overall Score" within the replacement/rehabilitation algorithm.
| Maintenance Activity | Weight Factor Repair |
| Broken Main (within the last five years) | 1.0 |
| Repair Main Leak | 0.85 |
| Repair Broken Main (within 2 years of cleaning/lining) | 0.8 |
| Repair Broken Main (not in the last five years) | 0.75 |
| Repair Valve Leak | 0.5 |
| Routine Flushing | 0.25 |
| Repair Service Leak | 0.25 |
| Repair Fire Hydrant Leak | 0.25 |
| Discolored Water | 0.25 |
| Performance (e.g., Pressure Complaints) | 0.25 |
The Overall Score is based upon the sum of the individual maintenance activity counts (as selected by the user) for a pipe multiplied by the weight factor of the respective maintenance activity, and then divided by a unit pipe length ratio. The unit pipe length ratio was calculated by dividing the pipe length by 1,000 feet. If the pipe length was less than 1,000 feet, then the unit pipe length ratio was 1.
For example, a 1,500-ft. pipe had 10 "Repair Main Leak" records in the MMIS and four "Repair Broken Main" activities within the last five years, and no other maintenance events, then the score for this pipe would be:
(10 * 0.85) + (4 * 1.0) = 12.5 ==> This represents the maintenance subtotal.
1,500 ft pipe/1,000 ft = 1.5 ==> This represents the unit pipe length ratio.
The "Overall Score" is equal to the maintenance subtotal divided by the unit pipe length ratio:
12.5/1.5 = 8.3 ==> This represents the Overall Score.
Under this example, this pipe would have been assigned a "Replacement Candidate" priority. Even though the Overall Score was less than the defined threshold (greater or equal to 20), the pipe had a count of four Repair Broken Main events, which met the first criterion associated with the "Replacement Candidate" logic.
The System Infrastructure (SI) Group at the Washington Suburban Sanitary Commission (WSSC) has been tasked with implementing an aggressive program for the replacement of aging water mains in a bi-county region of Maryland. Beginning in fiscal year 2002, eight miles of water mains will be replaced. While this represents a 30% increase in the amount of mains replaced compared to previous years, it represents merely 0.1% of the overall system.
Historically, the SI Group has been forced to rely upon manual methods in order to manage its main replacement program. They recognized that to effectively implement the new replacement program, they had to capitalize on technology to assess their information on pipe conditions, work histories, and geographic location and successfully direct the replacement work to the highest priority needs.
Thus, the Utility Information Management and Decision Support System (UIMDSS) application was developed. This application enables the SI Group to aggressively and effectively access their legacy Maintenance Management Information System (MMIS) data and Geographical Information System (GIS) data, and make more prompt, educated, and efficient decisions regarding their infrastructure. Armed with this application, the SI Group will be fully capable of meeting the new goals of their new main replacement program, and ultimately, be better equipped to make decisions regarding capital outlays that meet their customers' needs for reliable, clean water.