Introduction
Esri’s MapObjects Professional technology has been around for several years and now is a fairly mature product at version 2.1.The product’s goal has always been to allow programmers to implement GIS functionality into their own application.
Our development started as an effort to create a viewer/editor for our commercially available redistricting product.The Commercial Redistricting product, autoBound was based on ArcView GIS and was to be used by more than half the states in the US and many County and Local agencies for the 2000 redistricting effort.The goal of the viewer product was to allow the public and non-technical staff to participate in the redistricting process.
As we started to build this application, phase by phase, it soon became clear that we were replicating large portions of ArcView GIS.The viewer application needed a map display interface, a data display interface, charting capability, map layout tools and report functions.Since wholesale distribution of ArcView GIS to the public was not practical, we started on the process of building a standalone GIS using the MapObjects technology.
Phase I. Basic Design
Based on our need to create a redistricting viewer, we had specific functional requirements.These included the following:
- Save and Restore Sessions.The user should be able to recall a previously saved session and continue his work.
- Display Maps.A display was needed to allow users to interact with the maps.The required functionality would be very similar to the ArcView’s view document.
- Display Spreadsheets.Our commercial redistricting product uses a spreadsheet for the display of summarized tabular data. This functionality was also required in this application.
- Data Tables.It was anticipated that the user would benefit from the ability to browse the attribute portion of the GIS data.
- Chart Data.Charting functionality was required as a visual display tool for spreadsheet data.
- Map Layout.The Layout functionality was needed for the creation of professional maps.
-
Data Output.The Data output or reporting functionality was
required in order to allow users to create hardcopy output of data analysis.
With the basic functionality developed, the design of application framework could begin.
Phase II. Required components.
From the start of the development process, our programmers preferred the use of existing Active X components where possible in order to shorten the development time.Once the general features of the software had been determined, components, which could potentially satisfy the required features, were selected.The following is a list of the primary COM components used in the application:
MapObjects 2.1
Map viewing and
analysis
True DB Grid
Data grid display
Formula One
Spreadsheets
VT Chart
Charting
MapCanvas
In house developed Map Layout control
Crystal Reports Data
Output
Dockit
Window docking
Active Toolsbars Docking menus and
tool bars
Active Listbar
Outlook style document manager
FTP
Internet Data Download
Zip Compression Data Extraction
The above group of components was selected after several weeks of testing during which it was discovered that some components couldn’t coexist with others. Moreover, the incompatibility only existed on certain Windows platforms and only in the complied version. Identification of these incompatibilities required extensive platform testing.
Phase III Development of the application framework.
Once the functionality and the selection of the required components of the application had been completed, the work on the overall design could begin.There are many approaches to the design of a user interface for a GIS application. However, the design team had one overriding rule. The audience for this application would be primarily Esri based.As such, it would be far more efficient for the user to interact with a familiar interface (e.g. ArcView, ArcGIS, ArcExplorer) rather than one conceived by our developers. Therefore, similar functionality should be accessed similarly.The Add Layer button in our application behaved similar to the ArcView Add Theme button. The following is the resulting interface:
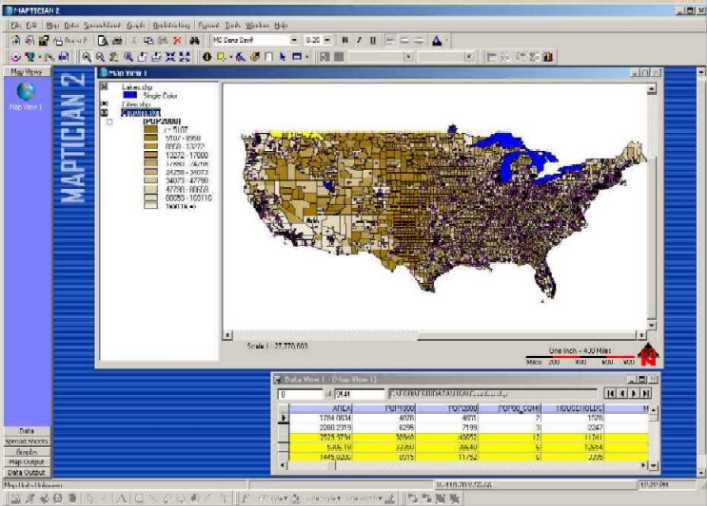
As shown, a document management bar on the left allows the user to navigate between MapView, Data Views, Spreadsheets, Graphs, Map Output and Data Output documents.Menus at the top become enabled or disabled depending on the active document.
Phase IV. Development of Required functionality
Once an application framework was developed, work on the specific application functionality or the “body” of the program was started.The following is an outline of some of the key aspects of this effort and technologies, which were created during the development effort.
Save and
Restore Sessions.
Most of the COM components used in the development process included save functions.However, it would be impractical to have dozens of
files associated with each save.The
development team experimented with converting the binary saved files to a single multi
section text file and creating a saved project similar to an ArcView .apr file.However, ultimately, the saved project was a
simple zip file containing the individual binary saved files.
Map Legend.
The MapObjects sample legend tool proved highly ineffective when used with multiple
renderers and a large number of layers.As
such, a “Treeview” legend was created. This legend tool is similar to the one
used in ArcGIS.For the first version of this
application, the standard Microsoft Treeview was used.
This control does not provide adequate functionality for check boxes (i.e. it is an
all or nothing option).The next version of
the software will incorporate a commercial Treeview with better functionality.
Legend Editor.
This portion of the application required substantial development effort. Our goal was to provide functionality for all
renderer functions in MapObjects, including: Single Color, Color by Value, Graduated
Color, Dot Density, Chart, Standard Labels and Advanced labels. Moreover, we wanted the user to have the ability
to add multiple renderers to the same layer and to save and recall legends to external
files.The latter option required the
development of a file format for storage of renderer information.
Finally, the renderer was to also include the ability to randomly disperse Interstate and other shields on road layers in order to create a pleasing display. This effort required extensive testing with a variety of data sets.
Data Display.
One of ArcView GIS’s most used functionality is the ability to display attributes of
themes and dynamically select either from the table or the map display. The replication of this functionality proved
extremely difficult.First, since our
application could open both Arc/Info and Shape files, we could not use a DBGrid to access
the dbase portion of the shape file.Further,
we could not fill in the grid by reading the shape file during the initiation of the grid
since this required a long time to complete.Rather
the visible portion of the grid was filled and as the user scrolled, more data was
dynamically loaded.
The aforementioned approach however created a problem when users would select features from the graphics display which had not yet been loaded into the grid.Multiple single arrays were used to overcome this.
The next problem was the need to highlight selected features when a large number of records were selected from the table.MapObjects does not include a way to select a particular record using the FeatureID, and there was no guarantee that the selection would be sequential. Our first approach was to go back to the beginning of the recordset for each record, then move forward until we find and highlight the needed feature based on the FeatureID.This approach resulted in long waits during the select process.
The solution to this problem was to store each shape object for the attribute record in the first column of the Grid.By doing this, we could highlight the shapes associated with the selected records without the need to go back to the recordset.Of course, the problem became even more complex by including the need to sort records and promote selected records.
Spatial Analysis.
In order to provide the user with the ability to perform spatial analysis, 17 Spatial
Wizards were created.These included
operations such as Clip, Union, Spider lines, etc.
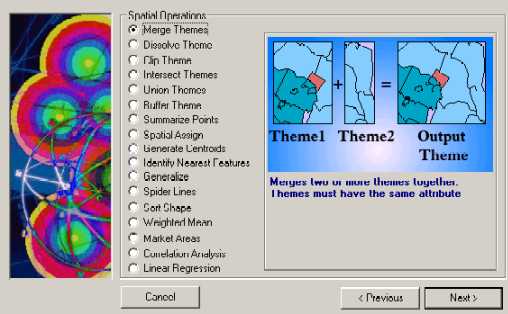
The primary problem encountered here was bugs in MapObjects Union, Subtract and spatial overlay routines.This is a result of internal MapObjects integer based operations.As a result, valid intersect operations can return Null shapes. The solution was a series of area checks to ensure the area of the intersected shape correctly matches the subtraction of the source shapes.
Map Output.
Creation of map layout tool was effectively accomplished by the use of DEC’s
MapCanvas product.MapCanvas is a
commercially available Active-X control designed to provide Map Layout functionality to
MapObjects applications. This product
was created during an earlier MapObjects development effort.
With the completion of the application’s functionality, a basic GIS foundation was created.The software at this point could be used to display redistricting databases created by DEC’s autoBound redistricting product.It could additionally be used as a standard off-the-shelf Simple GIS solution.The resulting product was named Maptician.
V. Development of Additional Extensions.
In order to make the product functional for specific end user applications, a host of additional extensions was required.The following is a list of extensions, which were created to work inside the Maptician product.
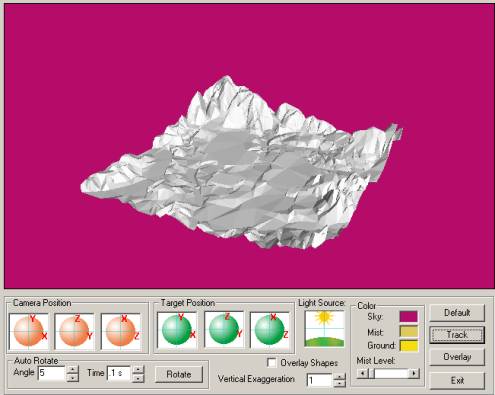
- 3D Analysis.The development of 3D analysis first requires the implementation of Terrain Modeling.Our approach was to use a modified Delaney Irregular Triangulated Network (TIN) model.Once the model was implemented, an existing visualization COM control called Active3D was used to display and rotate the resulting model.
- Automated and manual redistricting. Although the product already included functionality for display of autoBound redistricting databases, it lacked the ability to create and edit redistricting plans. This functionality was added in the form of an extension.
- Geocoding.A geocoding interface was created to allow the user to create various indices required for the different street addressing styles. Next, the ability to geocode both a single address and a table of addresses was added.
- Routing.The ability to determine point-to-point and multi-point routing was deemed essential for the commercial use of the product. As such, this functionality was added as a route analysis extension.
-
Precincting.The precincting
extension was an addition to the redistricting portion of the software.It was designed to allow local and county election
officials to modify existing precinct boundaries.The
software has the ability to automatically download and install the required datasets from
the Internet.The user can then make the
necessary adjustments to the precinct boundaries and optionally post the results to a
central state repository.
VI. Future Extensions.
DEC is currently working on several additional extensions to the Maptician software.These include a School Attendance area management and analysis extension, a US wide street map and a shape editing module.
Conclusion.
The development of the Maptician software along with its extensions has taken nearly 2 years and several programmers to complete.This has represented a significant investment both in costs and manpower.During this time the goal of the product has been to create the simplicity a desktop mapping application such as Microsoft’s MapPoint with the powerful GIS analysis tools of a product such as ArcView.
The goal has also been to create a low cost application with a small footprint, which can be implemented by any level user with modest computing power.
The process of creating this application has also resulted in some surprising benefits.Our programmers have made far more extensive use of the library of code developed for the product than had been anticipated.This has significantly improved our ability to rapidly develop other custom GIS applications.
As an example, rather than hard coding the symbolization parameters required for the display of several map layers in a custom MapObjects application, the layers were loaded in Maptician and rendered as needed.Next, the legend for each layer was saved to an external file and the routines for recalling saved legends were added to the custom application.Once the custom application was loaded, the layers were rendered according to the previously saved legends.
The approach resulted in saving of several days of programming time.But more importantly, it also allowed the end user to preview the symbolization of each layer prior to having it programmed into the software.It further enabled the user to implement symbolization changes without the need for additional programming.