Shawn M. Landry and Kyle N. Campbell
The quality of life in Florida is inseparably linked with its water resources and the availability of quality assured real-time water resource data is critical to sound decision-making. While several federal, state and local agencies collect real-time water resource data, rarely are these data made available to the public and other key stakeholders. The University of South Florida working with agencies within Florida has created a web-based application to (1) collect real-time data from multiple agencies, and (2) present these data in a meaningful context using such tools as ArcIMS-based real-time thematic maps.
According to the Florida Department of Environmental Protection, Florida has over 50,000 miles of rivers and streams, 7800 lakes, and 4000 square miles of estuaries (see http://www.dep.state.fl.us/water/surfacewater/index.htm). Under the federal Clean Water Act, state and local governments are responsible for establishing water quality standards and for monitoring water bodies to ensure compliance with these standards. Water quantity issues such as potable water supply, minimum flows and levels, and public safety related flooding concerns also require regulatory standards and extensive monitoring efforts. Unfortunately, the data concerning these resources are collected by widely disparate agencies at varying levels of federal, state, and local government. The result for an environmental professional working on these resources is often a costly data search and time intensive conversion process. For citizens and other less savvy stakeholders, access to quality-assured data along with interpretative educational materials is simply not available.
The need to establish a system that would bring together scientific data, educational information, and geographic information systems (GIS) maps related to water resources is not new to the environmental management community. Unfortunately, this need has gone largely unmet in Florida and throughout the United States. At the same time, the United States Environmental Protection Agency (US EPA) found through a telephone survey that, in general, people want more information about their community (Flynn 2000). While several attempts have been made to create tools to facilitate data sharing, these tools are often narrow in scope and not designed to provide information in an easily accessible and understandable format for citizens. For example, the EPA STORET website provides access to water quality data contained with the STORET database, but interpretation of these data is left to users of the system (see http://www.epa.gov/storet/index.html). In an effort to solve this problem, the University of South Florida, in conjunction with several government agencies within Florida, have developed an online Watershed Atlas that serves timely data from many sources in a citizen-friendly application. Currently, the application is only available in several counties in Florida (Citrus, Hernando, Hillsborough, Pasco, Pinellas, Polk, and Seminole). This paper will serve to document the development of the Atlas project, provide an overview of the functionality, and assess the benefits derived from the program.
Research for the Atlas began in 1998 with the development of the Hillsborough County (Florida) Lake Atlas. The Hillsborough Lake Atlas was developed as a static html-based website populated with data from a simple MS Access database. With the availability of improved technology, the Atlas was revised for Seminole County (Florida) in 2001 using entirely database-driven technology and ArcIMS mapping. Since that time, the same technology has been used to develop an Atlas for Polk County (Florida), portions of several counties within the Southwest Florida Water Management District, and a project is underway in Lake County (Lake County).
The development of each Atlas project was research intensive and required significant stakeholder involvement. To facilitate intergovernmental coordination an advisory committee was formed. Each Advisory Committee consisted of citizens, environmental management professionals, data providers, and other stakeholders. The advisory committee helped to identify data providers, provide input on data presentation, and ensured cooperation with the agencies they represented. Data sources were cataloged, and prioritized for inclusion on the Atlas. Currently, major datasets available from each Atlas include United States Geological Survey near-realtime and other data, Florida LAKEWATCH volunteer monitoring program data, Water Management District near-realtime and other data, local county and municipal data sources, and water quality data extracted from STORET. The Atlas projects currently include data from 16 different agencies, contain a total of over 2700 active sampling locations, and over 2.4 million individual samples.
An important component of the Atlas was to spatially enable all of the data so that it could be tied to a specific geographic feature such as a watershed, lake, river, or even a particular river segment. To accomplish this, a comprehensive hydrographic GIS data layer was developed based on the National Hydrography Dataset (NHD) and local data sources. Sample site locations from multiple agencies were compiled into a comprehensive layer and tagged to identify the appropriate waterbody or river segment (from the hydrography layer) that is sampled by the station. Due to the variation in method used to collect geographic coordinates by source agencies, these locations are often found to be inaccurate when overlaid on the hydrography base map. A quality control procedure was developed to assign these wayward sample sites to the appropriate water resource. The end result of these GIS efforts was to create a sample location dataset that was linked to a hydrographic base layer.
To deliver these relatively complex data to both citizens and scientists, a web application was developed that allowed browsing of spatial data such as aerial photographs, location of water resources, watershed delineations, and other important GIS datasets such as land use. In addition, key environmental and social data would need to be integrated with ample educational materials. From these parameters and from specific input from the various advisory committees on valid measures and benchmarks, the specifications for the web application were developed. The Atlas web interface was designed to be fast, reliable, and widely available to users that might have access to the Internet using only a dialup modem. Therefore, the principles of “thin-client” design and browser independent technology guided development. The web application uses Esri Internet Map Server (ArcIMS) technology and Microsoft’s Active Server Page technology (ASP) to serve the quality-assured data to the citizens through a user-friendly interface.
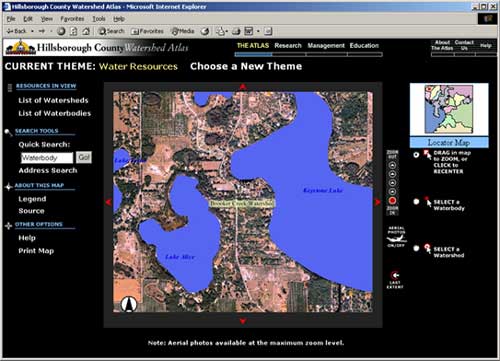
Figure 1. Example ArcIMS map interface as shown on the Hillsborough County Atlas.
The system architecture of the Atlas was designed to minimize maintenance, however, since the project serves as a comprehensive data store for many diverse types of data and educational materials maintenance is required for the long-term success of the project. Maintenance of each Atlas website involves updates to data and educational materials, hosting the website and managing all servers and software, and upgrading the application when necessary. As part of our educational mission, the decision was made to maintain the Atlas at the University of South Florida. Data updates require periodic loading of files provided be each data provider as well as monitoring scheduled automated data load tools (e.g., hourly USGS data). For example, most water quality data updates has been provided quarterly by each data provider and require manual load and quality assurance procedures performed to complete each update. In addition, educational documents and other resources require continuous cataloging and management in order to ensure that the Atlas is as current as possible.
The following section provides an overview of functionality available using the Atlas application. Since it is impossible to provide a true demonstration of Atlas functionality in this format, a visit to an Atlas website is encouraged. In order to provide a portal for users to access any Atlas website, the University has registered the domain www.WaterAtlas.org and has developed a preliminary website to serve this role. As additional Atlas projects are developed, access to each will be provided via the WaterAtlas.org website. The mapping interface is shown in figure 1 and allows users to view multiple themes such as hydrography, wetlands, political boundaries, watershed boundaries, and aerial photography. The user can navigate to a water resource of interest through an address search or by browsing the map. Once a resource is in view, the user can select the resource with a select tool or choose to bring up a hyperlinked table of the water resources in the view. Either choice directs the user to a series of watershed or waterbody specific data pages.
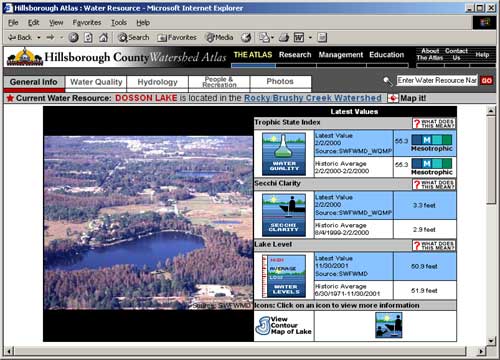
Figure 2. Lake-specific general Information page on the Hillsborough County Atlas.
The water resource data pages summarize data by topic and display key indices and parameters for determining the current conditions of a watershed, lake, river or stream. The data are organized by sections, including: general information, water quality, hydrology, people and recreation, and photographs. Figure 2 illustrates a typical general information view for a lake. The data are published in timely or near real-time intervals on the Atlas using automated protocols. In order to educate citizens and assist users in discerning meaning from the data presentation, each component of the Atlas is presented with a “What does this mean?” help page. For example, from the lake-specific general information page of the Atlas, Trophic State Index (TSI) is a parameter that is presented. As part of the TSI presentation, a “what does this mean” help page is linked which explains the difference between oligotrophic and eutrophic in terms designed to educate the average citizen. These educational help sections are included with each data component.
As it is not possible to highlight all Atlas functionality in this paper, the follow is an abbreviated list of major features included as part of an Atlas website:
One measure of success of web-based projects is the number of users visiting the website. Currently, three counties in Florida (Hillsborough, Polk, and Seminole) are being served by the Watershed Atlas through WaterAtlas.org as of February 2002. To make a general comparison of the success of WaterAtlas.org, a ratio of the users per day to the total population served by the website was generated and compared to the number of user sessions for the Southwest Florida Water Management District’s main website (see Table 1). While a statistical comparison is not feasible, it is reasonable to conclude that the Atlas websites are successful if measured by users alone. As a ratio to population served, the Atlas compares favorably with the main website for the Southwest Florida Water Management District. Another measure of the success of the Atlas program is the number of users requesting environmental information or expressing interest in becoming a volunteer. For the most recent quarter (December-March 2002), 47 users filled out comment forms and 11 users expressed a desire to become volunteers.
Table 1. Analysis of the Atlas projects in terms of the ratio of users per day to total population served.
| Website | Total Population Served | Average Users per Day | Ratio of Users/Day to Total Population Served |
|---|---|---|---|
| WaterAtlas.org | 1,848,068 | 665 | 1 : 2,779 |
| Southwest Florida Water Management District | 3,900,000 | 1,067 | 1 : 3,655 |
While currently no data exist to compare citizen response prior to the Atlas, environmental professionals surveyed who were working with the Atlas have qualitatively expressed improved communication with the public and at the same time reduced staff time spent gathering data to answer questions from the public. Furthermore, the inclusion of quality-assured data from multiple agencies into one data source was cited as a benefit to both environmental professionals and citizens. Overwhelmingly, the survey respondents stated that the Atlas was meeting or exceeding their expectations
The Watershed Atlas application is providing unprecedented access to water resources data and educational materials for the local citizenry and environmental professionals. The Atlas projects currently include data from 16 different agencies, contain a total of over 2700 active sampling locations, and over 2.4 million individual samples. Access to these data are provided via user-friendly water body specific web pages designed for citizen education as well as advanced data access tools designed for environmental professionals. Preliminary results indicate that the Atlas is being widely used by both citizens and environmental professionals and the amount of time spent by both user groups to access data has been reduced. Furthermore, in counties where the Atlas has been implemented, it has fostered communication between environmental professionals and the general public. Based on the current number of users per day, WaterAtlas.org will serve over 250,000 users in 2002. The number of users will continue to increase as additional geographic regions of the state are included and as the overall functionality is enhanced.
The University is committed to both improving the functionality of the Atlas and facilitating its development statewide. The Atlas program has been awarded funding from several additional agencies including an EMPACT grant from US EPA with Seminole County. Efforts underway to improve the Atlas include:
Through these efforts and with the assistance of our agency partners we will continue to refine and assess the effectiveness of the Atlas to meet the needs of environmental professionals and the general public.
Marty Kelly, Adam Munson, Jim Griffin, Steve Dicks and the staff at the Southwest Florida Water Management District
Mark Flomerfelt, Kim Ornberg and all the staff at Seminole County Public Works
Jack Merriam, Carlos Fernandes and all the staff at Hillsborough County Public Works
Jeff Spence, Robert Kollinger, and all the staff at Polk County Natural Resources Department
Allan Hewitt, Walter Wood, and all the staff at Lake County Dept. of Growth Management
Flynn, Mike. 2000. Getting Information to People In Forms They Can Use and Understand. Presented at the National Environmental Innovations Symposium: A Partnership Between the U.S. Environmental Protection Agency, the Environmental Council of the States, and the Council for Excellence in Government. Hyatt Regency Crown Center, Kansas City, Missouri: December 6, 2000.
Shawn M. Landry: Co-Author and Presenter
Senior Scientist
landry@arch.usf.edu
Kyle N. Campbell: Co-Author
Director
campbell@arch.usf.edu
Florida Center for Community Design and Research
University of South Florida
3702 Spectrum Boulevard, Suite 180
Tampa, Florida 33612
Phone: (813) 974-4042
Fax: (813) 974-6023
Website: www.fccdr.usf.edu