Hua Shi, Ashbindu Singh and Mark Ernste
This study focuses on assessing the world’s remaining closed forests (WRCF) distribution, the state of population distribution, and protected areas in global biodiversity hotspots using remote sensing and Geographic Information System (GIS). Conservation International has identified 25 ecoregions, called biodiversity hotspots that are especially rich in endemic species and particularly threatened by human activities. This study uses globally consistent and comprehensive geo-spatial data sets based on remote sensing and other sources, and the application of GIS layering methods and consistent data sets has made it possible to identify and quantify relationships between the WRCF, human population, and protected areas in biodiversity hotspots. It is expected that such information provide a scientific basis for biodiversity hotspots management and assist in policy formulations at the national and international levels.
Biodiversity,simply defined, is the total of all life on Earth, that wealth of species, said and done, still the only place in the entire universe where we know with certainty ecosystems, and ecological processes that makes our living planet what is it is – after all is that life exists. It is our living resources base, our biological capital in the global bank, and what distinguishes it perhaps more than anything else is the fact that its loss is an irreversible process (Mittermeier, R. A. and et al., 1999). The Global Biodiversity Assessment of the United Nations Environment Programme (UNEP) concluded that the adverse effects of human impacts on biodiversity are increasing dramatically and threatening the very foundation of sustainable development. The total number of species that inhabit the planet is unknown and it is believed that many extinctions will occur even before they have been named and described. It is estimated that 85-90 % of all species can be protected by setting aside areas of high biodiversity before they are further degraded, without having to inventory species individually. It is generally assumed that most terrestrial species are found in the tropics, only a relatively small portion of the total land area is likely to be devoted to biodiversity conservation; hence, it is critical to geographically identify areas rich in species diversity, unprotected species diversity and endemism (species native or confined to a particular area) as a first step toward the protection of remaining natural habitats before they are destroyed.
The next half-century could be called the “last chance decades”. These will be some of the most dangerous years ever for the Earth’s species and ecosystems. Yet this is also a time in which we still will have a chance to make a difference (Mittermeier, R. A. and et al., 1999). In the past, protected areas often have been set aside without regard to the biodiversity within their boundaries. As a result, many protected areas have little significance in terms of biodiversity, and conversely, many areas of habitat with significant biodiversity lack protection. This study seeks to identify relationships between the WRCF, human population, and protected areas by analyzing comprehensive and consistent spatial data sets of 1-km resolution to answer following questions:
What is distribution of the WRCF in biodiversity hotspots?
Are the world’s remaining closed forests with significant biodiversity adequately protected?
Is biodiversity within the WRCF threatened by human population pressure and land use?
What are the interconnections between people and the biodiversity hotspots? What should we do?
Data was processed using several Remote Sensing and Geographic Information System (GIS) software systems(Esri and ERDAS Imagine, 2000). Most of the work has been carried out in the GRID module of ARC/INFO. Raster and vector data layers were in an Interrupted Goode Homolosine Projection, which is an equal area projection. All raster data sets have a cell size of 1000 meters (1 km).
Fig. 1 Data analysis procedure
The data layers have been analyzed individually or combined with other data layers in order to see possible interrelations or possible spatial relationships among them. For example, “original extent of biodiversity hotspots layer”, “population density layer” and “country boundaries layer” is digitally overlaid in order to assess the population pressure on the each hotspot by countries.
Detailed analysis of forests cover for each original extent of the 25 biodiversity hotspots and three extensive tropical wilderness areas (Myers, N., and et al., 2000), derived from the National Oceanic Atmospheric Administration Advanced Very High Resolution Radiometer (NOAA AVHRR) for the period 1995 (Singh, A, and et al., 2000), was utilized to assess the actual extent and distribution of the remaining closed forests. Closed forest is defined as lands of forest cover with canopy density of 40% and greater. The definition of 40% coverage is appropriate because it can be estimated with ease: when the coverage of the trees is 40% the distance between two tree crowns equals the mean radius of a tree crown (UNESCO, 1973).
The closed forest cover distribution by biodiversity hotspots was estimated by combining original extent of hotspots boundary grids with the closed forests cover classes. In each hotspot, the total number of closed forest cover cells was summed and then divided by the original extent area thus resulting in the percent area covered by closed forests within each hotspot. Conservation International provided the original extent of biodiversity database.
The protected area status of the closed forests in 25 biodiversity hotspots and 3 wilderness was estimated by combining the protected area grid with the closed forests distribution grid, and biodiversity hotspots boundary grid. Within each protected area, the number of closed forests cover cells are counted and then summed by each hotspot for each closed forest area.
The number of people has been counted for closed forest area by each hotspot or countries. The resulting data has been exported as a spreadsheet and combined in one graph showing the population distribution of the closed forests in each hotspot. The following classification was used for the analysis of population pressure in closed forests: a) low population pressure: < 25 people km-2, b) medium population pressure: 25-100 people km-2, c) high population pressure: > 100 people km-2.
In this study the USGS land cover database (Loveland, T., and et al., 1996) was used as a base to update forest cover map for many parts of the world for the year 1995. This land cover database has been developed on characteristics of vegetation seasonality determined in terms of weekly composite of Normalized Difference Vegetation Index (NDVI) derived from NOAA AVHRR sensor for the period 1992-1993 (http://edcdaac.usgs.gov/). In the database, unique NDVI signatures and associated attributes, such as terrain and eco-regions, characterize large-area land cover patterns (Singh, A and et al., 2001). In this study area under forests classes, namely, closed forests (density > 40%), open and fragment forests (density 10–40%), and other woodlands have been taken from the 1995 forest cover database, whereas area under grassland, cultivation, and water have been taken from the USGS land cover database.
The geographically referenced population database has been provided by the UNEP/GRID (http://grid.cr.usgs.gov/). These data sets have been generated using a model incorporating many variables.
UNEP-World Conservation Monitoring Center (http://www.unep-wcmc.org/) has provided the protected areas database. The definition of a protected area as adopted by The World Conservation Union (IUCN) is "An area of land and/or sea especially dedicated to the protection and maintenance of biological diversity, and of natural and associated cultural resources, and managed through legal or other effective means" (UNEP-MCMC, 2001).
The Conservation International has provided the biodiversity hotspots database (Conservation International, 2001, http://www.conservation.org/). The hotspots are considered to be Earth’s biologically the richest and most endangered terrestrial eco-regions. The Conservation International have identified 25 hotspots which are listed below: Atlantic Forest region, Brazilian Cerrado, California Floristic Province, Cape Floristic Region Caribbean, Caucasus, Central Chile, Choco-Darien-Western Ecuador, Eastern Arc Mountains and Coastal For, Guinean Forests of West Africa, Indo-Burma, Madagascar and Indian Ocean Islands, Mediterranean basin, Mesoamerica, Mountains of South Central China, New Caledonia, New Zealand, Pilippines, Poynesia and Micronesia, Southwest Australia, Succulent Karoo, Sundaland, Tropical Anded, Wallacea, Western Ghats and Sri Lanka. The tree major tropical wilderness areas are Upper Amazonia and Guyana Shield, Congo River Basin, and New Guinea and Melanesian Islands (Mittermeier, R.A, and et al., 1999).
Political boundaries data has been taken from the US National Imagery and Mapping Agency's (NIMA) Vector Map Level 0 (VMAP0) series CD-ROM. From this data set, year 1995 version of the political boundaries of the world at 1:1 million nominal scale has been taken. Attribute assignments have been verified and corrected as needed for the resulting polygon coverage and subsequently these coverages have been joined to generate an updated map.
The forests cover and population data sets have been the best available that covered the entire world. Local errors are known to exist in the mapped distribution of forests cover type.
The population distribution data set is generated using a spatial modally technique incorporating many variables.
The protected areas database is not current for all countries. Some of the smaller protected areas may not have been accounted for due to the coarse resolution of data. Where information is not available for the exact extent of a protected area, a point has been inserted representing the center of the site. Polygons have been made for such locations by using the information in textual databases and drawing a circular polygon of the relevant area around the point location of the site. None of these data sets have been rigorously validated, so local relationships and distributions should be viewed with caution. Availability of high-quality, current global data remains a stubborn barrier in such analyses, highlighting the need to support development and updating of such databases.
The extent of the World's Remaining Closed Forests (WRCF) in 1995 is estimated at approximately 2.87 billion hectares which occupies about 21.4% of land area of the world (Tab. 1). The WRCF occupies about land area 9.25% in Africa, 16.8% in Australia and Pacific, 21.1% in Europe and Asia, 29% in North and Central America and 35.44% in South America. Percentage of WRCF to total land area is the highest in South America and the lowest in Africa.
|
Biodiversity Hotspots |
OE1 |
WRCF |
|||
|
Area |
% PT2 |
Area |
% of Area |
% PT |
|
|
Atlantic Forest |
1480400 |
0.83 |
106599 |
7.20 |
5.07 |
|
Brazilian Cerrado |
1830910 |
6.18 |
253820 |
13.86 |
14.47 |
|
California Floristic Province |
351568 |
38.63 |
134730 |
38.32 |
65.84 |
|
Cape Floristic Region |
74771 |
0.98 |
2601 |
3.48 |
0.00 |
|
Caribbean |
247423 |
8.77 |
74274 |
30.02 |
16.24 |
|
Caucasus |
556246 |
2.92 |
73448 |
13.20 |
7.01 |
|
Central Chile |
289627 |
6.21 |
60983 |
21.06 |
17.94 |
|
Choco-Darien-Western Ecuador |
223984 |
10.69 |
78354 |
34.98 |
14.76 |
|
Eastern Arc Mountains and Coastal Forests |
191828 |
15.85 |
20170 |
10.51 |
7.65 |
|
Guinean Forests of West Africa |
879511 |
4.06 |
280258 |
31.87 |
5.34 |
|
Indo-Burma |
2273303 |
9.08 |
777654 |
34.21 |
14.05 |
|
Madagascar and Indian Ocean Islands |
597673 |
1.12 |
84454 |
14.13 |
3.13 |
|
Mediterranean Basin |
520177 |
1.83 |
25892 |
4.98 |
4.07 |
|
Mesoamerica |
1144270 |
9.72 |
581703 |
50.84 |
14.07 |
|
Mountains of S. Central China |
557260 |
5.36 |
187918 |
33.72 |
7.36 |
|
New Caledonia |
17301 |
1.53 |
3687 |
21.31 |
4.53 |
|
New Zealand |
257698 |
11.13 |
71332 |
27.68 |
19.77 |
|
Philippines |
280545 |
3.86 |
69285 |
24.70 |
4.49 |
|
Polynesia and Micronesia |
1404 |
0.37 |
0 |
0.00 |
0.00 |
|
Southwest Australia |
306903 |
7.04 |
21822 |
7.11 |
11.56 |
|
Succulent Karoo |
102840 |
1.71 |
0 |
0.00 |
0.00 |
|
Sundaland |
1475121 |
13.10 |
628141 |
42.58 |
18.50 |
|
Tropical Andes |
1396569 |
14.46 |
236975 |
16.97 |
25.75 |
|
Wallacea |
317927 |
13.49 |
162988 |
51.27 |
18.07 |
|
Western Ghats and Sri Lanka |
254730 |
9.09 |
43785 |
17.19 |
22.90 |
|
Total |
15629989 |
8.29 |
4E+06 |
25.47 |
15.88 |
|
Upper Amazonia and Guiyana Shield |
5738567 |
21.66 |
4802966 |
83.70 |
21.25 |
|
Congo River basin |
2050680 |
9.68 |
1474946 |
71.92 |
10.79 |
|
New Guinea and Melanesian Islands |
914016 |
15.44 |
638242 |
69.83 |
14.40 |
|
Total |
8703263 |
18.18 |
6916154 |
79.50 |
18.39 |
|
World |
24333252 |
11.83 |
28723638 |
21.43 |
9.4 |
Note: 1. OE- Original extend of primary vegetation; PT-Designated protected areas
We estimate, based on this analysis, the WRCF occupied 25.5% of the land area in the 25 hotspots and 79.5% three wilderness areas in 1995 (See the Fig. 2).
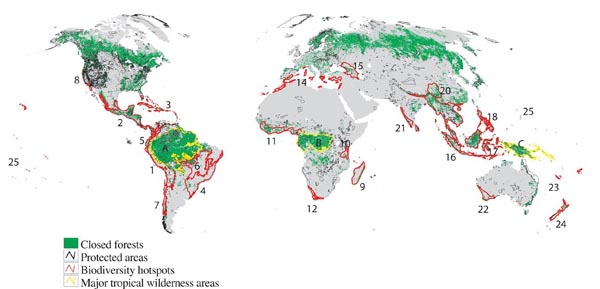
Fig. 2 The WRCF cover with designated protected areas in the biodiversity hotspots and three major tropical wilderness areas. Hotspots: (1) Tropical Andes; (2) Mesoamerica; (3) Caribbean; (4) Atlantic Forest region; (5) Choco-Darien-Western Ecuador; (6) Brazilian Cerrado; (7) Central Chile: (8) California Floristic Province; (9) Madagascar; (10) Eastern Arc Mountains and Coastal Forests of Tanzania and Kenya; (11) West Africa Forests; (12) Cape Floristic Region; (13) Succulent Karoo; (14) Mediterranean Basin; (15) Caucasus; (16) Sundaland; (17) Wallacea; (18) Philippines; (19) Indo-Burma; (20) Mountains of South-central China; (21) Western Gats and Sri Lanka; (22) Southwest Australia; (23) New Caledonia; (24) New Zealand; and (25) Polynesia and Micronesia. Maj reopical wildeness areas: (A) Upper Amazonia and Guyana Shield; (B) Congo River Basin; (C) New Guinea and Melanesian Islands.
The WRCF patterns with protected status in 25 hotspots and three major wilderness areas are apparent in Fig. 2. The broadest areas of the WRCF (>30%) can be seen in Wallacea, Mesoamerica, Sundland, California Floristic Province, Chaco-Darien-Western Ecuador, Indo-Burma, Mountains of South-Central China, Guinean Forests of West Africa, and the Caribbean. No closed forests existed in Polynesia, Micronesia, and the Succulent Karoo. The Mediterranean Basin had the greatest extent of non-vegetated land, approximately 60%. The WRCF cover the most areas in the three wildness areas (all of them > 69%).
Global protected areas occupy slight ly over 10 million sq km or 7.9% of the global land area (exclude Antarctic) 134 million sq km. About 9.4% of the WRCF have been accorded some sort of formal protection status, the highest being in the South America (19.5%) and the lowest being in the Eurasia (3.9%). Designated protected areas occupy approximately 8.3% of the hotspots including 15.9% of the WRCF. The percentage of protection status for each hotspot and wilderness area is shown in Tab. 1. The lack of designated protected areas within the hotspots is alarming. The protection status for most of the 25 hotspots is less than 10% of the total land and 20% of the WRCF. The hotspot with the most protection was the California Floristic Province with 38.6% of the total land and 65.8% of the WRCF. The WRCF under protection status in Upper Amazonia and Guiyana Shield occupy about 1020849 km2 or 21.3% of the total the WRCF. These areas maintains vast areas of intact tropical forests and the forests with the Earth’s biologically richest areas. The WRCF under protection status in New Guinea and Melanesian Islands occupy slightly over 14.4% of the total WRCF. Papua New Guinea (PNG) still possesses large areas of the WRCF. About 85% of the WRCF in PNG are under moderate or high threat, primarily from logging, agricultural clearing, and mining.
In the year 1995, about 22.7% of the world’s population lived in and around the original extent of hotspots and wilderness areas, 0.35% in and around the WRCF of 25 hotspots and 0.7% in and around the WRCF of 3 wildness areas. We found 18 of the 25 hotspots have population percent at or higher than the average of world (12%) in WRCF, and all of three wilderness areas have low population pressure (the area of low population pressure in WRCF is great than 94% (Fig. 3).
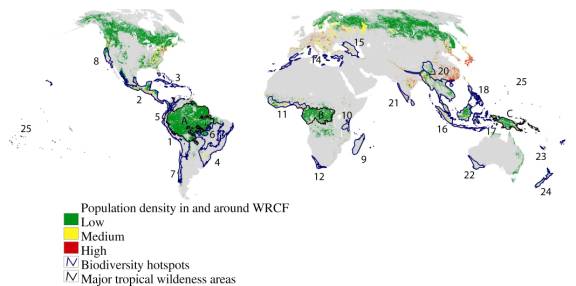
Fig. 3 Population pressure in and around WRCF in 25 hotspots and three major tropical wilderness areas (1-25 and A-B; see map for names and locations Fig. 2)
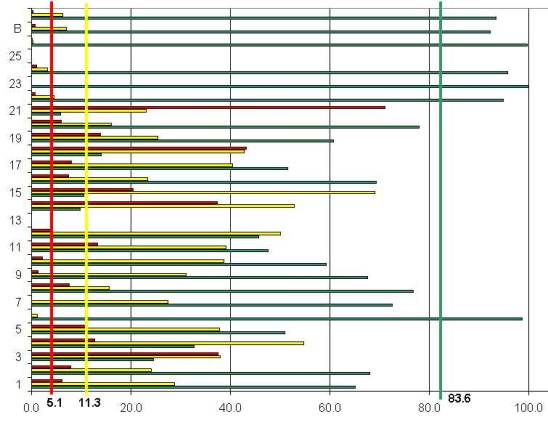
Fig. 4 Human population live in and around WRCF in 25 hotspots and three tropical wilderness areas (1-25 and A-B; see map for names and locations Fig. 2). Green: percentage of low population pressure; Yellow: percentage of medium population pressure; and Red: percent of high population pressure. World average: 5.1%, 11.3% and 83.6%.
We analyzed the population pressure in the WRCF of the 25 hotspots and three wilderness areas (Fig.4). In the year 1995, high human population pressure in the 25 hotspots exists in 10.7% of the WRCF.
If population pressure in and around the WRCF are examined in isolation of the other factors, the four hotspots with the most elevated risks, as assessed by high human population pressure, are the Western Ghats/Sri Lanka, Polynesia & Micronesia (no closed forests), Philippines and Caribbean hotspots, while almost all vegetation cover and closed forest areas in New Caledonia, Southwest Australia and Brazilian Cerrado are free from high population pressure. Some recent hotspots analysis conclude that the hottest hotspots appear to be the hightest-priority of these ecoregions on the basis of their extreme endemism and the intense packing of species into a much reduced area of original vegetation. Human activities in the biodiversity hotspots areas indicate a high risk that habitats will continue to degrade as ecosystems dominated by humans expand and species become extinct in the world’s most biologically diverse terrestrial regions.
After investigating three topics and resolving some of issues, our final step was to determine what are the interconnections between people and hotspots. Fig. 5 showing an abstract summary framework of this study.
Fig. 5. An overall framework for interconnection between people and biodiversity hotspots
Human impact on biodiversity hotspots increases forests ecosystem vulnerability, which also increases human awareness and stimulates human efforts to protect the forests ecosystem. This increased awareness hopefully decreases future human impacts. In future studies we hope to explore and investigate the processes that interconnect the human impact on biodiversity hotspots, forests ecosystem vulnerability, and ecosystem protection.
The geographic analysis of relationships between protected areas and distribution of the WRCF and population density clearly revealed the following facts:
We are grateful to the United Nations Environmental Programme (UNEP), National Aeronautics and Space Administration (NASA) and United States Geological Survey (USGS) for financial support. We are grateful to Dr. Tom Loveland, Dr. Zhiliang Zhu and his team for generating and providing the land cover distribution data set. Also we appreciate Dr. Forsnight, E. A., Dr. Singh, R., Mr. Auch, R., Reker, R., Mr. Ernste, M. and Ms. Giese. K. for their valuable comments and contributions. The views express in this study are not necessarily those of the UNEP/GRID. The designations employed and the presentations do not imply the expression of any opinion whatsoever on the part of the operating agencies concerning the legal status of any country, territory, city, or area or of its authorities, or of the delineation of its frontiers or boundaries.
International. Biodiversity hotspots database (Washington D. C., http://www.conservation.org/.
Esri and ERDAS Imagine. IMAGINE -Version 8.3 (ERDAS) for stratification and digitizing of vector polygons; ENVI (Research Systems, Inc) for image interpretation, graphical analysis and determining models; and Land Analysis System (public domain) for modeling. GIS analysis was performed using software donated by the Environmental Systems Research Institute (Esri), Inc.
Loveland, T. and et al. Developments of a global land cover characteristics database and IGBP DISCover from 1-km AVHRR data. International Journal of Remote Sensing Vol.21 (6&7):1303-1330 (2000)
Mittermeier, R. A., Myers, N., Robles Gil, P. & Mittermeier, C.G. Hotspots: Earth’s Biodiversity Richest and Most Threatened Ecosystems (CEMEX, Mexico, D.F., 1999.).
Myers, N. and et al. Biodiversity hotspots for conservation priorities. Nature 403, 24 (2000).
Singh, A., Shi, H., Fosnight, E. A. and Foresman, T. An assessment of the world remaining closed forests. Ambio 30, 1 (2001).
UNESCO. International Classification and Mapping of Vegetation, 23 (Paris, France, 1973).
World Conservation Monitoring Centre (WCMC). Protected Areas Database. CD-ROM, Cambridge, United Kingdom: WCMC (2001).
Hua Shi
Scientist, UNEP/GRID-Sioux Falls, USGS/EROS Data Center.
Ashbindu Singh
Regional Coordinator, Division of Early Warning and Assessment & North
America, USGS/EROS Data Center, Sioux Falls.
Mark Ernste
Scientist, UNEP/GRID-Sioux Falls, USGS/EROS Data Center.