The effect of Hilti/Salahi Recharge Dam in Batineh Area, Sultanate of Oman on the Quality of Groundwater Using GIS
William Bajjali, Ph.D
University of Wisconsin � Superior
Department of Biology & Earth Sciences
Superior, WI, 54880
http://frontpage.uwsuper.edu/bajjali
Twenty-Second Annual Esri International User Conference
July 8 � 12, 2002
San Diego, California
wbajjali@facstaff.uwsuper.edu
Abstract
Hilti / Salahi dam was built in the Batineh region of Oman to store the runoff caused by rains and floods during the wet season. The dam is designed to facilitate down gradient infiltration to the subsurface in order to increase the storage capacity of the aquifer and improve its water quality.
The Spatial Analyst extension of ArcGIS was used for this study. Various hydrogeological features such as groundwater wells, Hilti catchmnet area, Hilti/Salahi dam and the chemical analysis of the groundwater wells were integrated into the GIS system.
The GIS was used to analyze and interpret the quality of groundwater and characterize the most susceptible locations for recharge along the groundwater flow path downstream of the Hilti/Salahi Dam.
Two major parameters, Total Dissolved Solids (TDS) and nitrate (NO3-) were used as an input function to characterize the hydrochemistry and quality of the groundwater along the flow path from the recharge dam to the coast of Oman. The TDS and nitrate concentrations in the groundwater wells were taken as indicators to verify if the Hilti/Salahi dam plays a role in replenishing the groundwater and improving its quality.
Two color-coded maps represented the TDS (salinity) and NO3- were created. Each map illustrates and demonstrates the distribution level of each parameter downstream of the dam.
The maps show that significant variations occur in groundwater chemistry for the TDS and NO3- concentrations. The elevated salinity values at various well locations along the coast of Oman are attributed mainly to salt intrusion. The high salinity of the wells located far from the coast is due to re-irrigation. The high nitrate concentration in all the wells are attributed to anthropogenic sources mainly septic tanks and inorganic fertilizers.
A third map was produced by converting the salinity attribute of each groundwater well downstream of the dam into a continuous surface. The output result of the analysis showed that groundwater quality in the majority of the wells downstream of the dam significantly improved in terms of salinity and nitrate concentrations. Little improvement of the groundwater quality was observed for the groundwater wells located further from the dam and close to the seacoast.
The GIS techniques demonstrate how the recharge dam in arid conditions is an excellent structure for capturing the runoff water to recharge the groundwater. GIS provides significant environmental information that could be used to manage the groundwater resources and enhance its recovery from the floodwater stored in the dam during rainy season. The produced GIS color-coded map could also be a useful tool to enhance the public awareness and to promote an understanding the value of groundwater.
I. Introduction
Recharge dams in Oman have been designed and built to catch and store the rain and runoff in the wet season in order to facilitate its infiltration to the subsurface, expand the storage capacity of the aquifer, and improve the quality of groundwater.
The study area is extremely arid with very little rain during wintertime. Water resources are very scarce in this part of the world and groundwater is practically the only source available for water supply, irrigation and development.
During the 1970s and 1980s, several shallow wells and hand dug bore holes along the coast of Oman in Batineh area were used extensively for irrigation. This led to a lowering of the water table, causing the seawater to invade the usable part of the aquifer. This caused the quality of groundwater to deteriorate and to become unusable for human use, consumption, and even for irrigation.
In the area there are many streams (wadi) running from west to east, but all of them are desert wadi and are dry most of the time. The wadi carries water only in response to specific episodes of rainfall. A typical wadi might flow only a few days or perhaps just a few hours during the year. In some years the channel may carry no water at all. Eventually, the running water will discharge into the sea and some of it will evaporate. Only small amounts of water will infiltrate into the subsurface and recharge the groundwater.
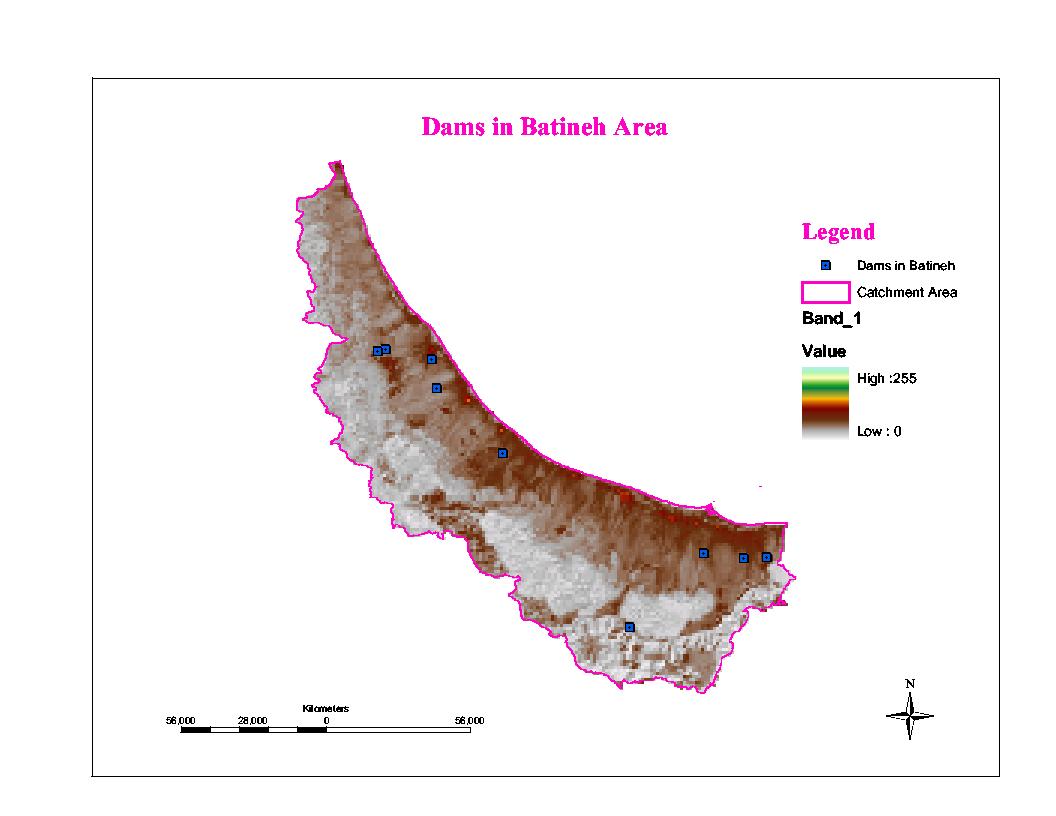
Water resources are of great concern to the head of the state, his Majesty Sulatan Qaboos. His government is doing what they can to keep the precious water resources away from contamination and overexploitation. Therefore, the government of Oman decided to build 17 dams at various locations in order to capture and store the floodwaters, using them to replenish the shallow groundwater that had been affected by the salt intrusion and re-irrigation. The majority of the dams were built in Batineh area (Fig.1)
Hilti/Salahi dam (Fig.2) is one of the dams built in the Batina area for this purpose. The dam is one of oldest and longest dams that have been built. The effective capacity and length of the dam are 0.55 million cubic meter (MCM) and 9 km respectively.
The dam had been planned to recharge the groundwater and improve its quality in Batineh area, which has thousands of wells that have been drilled for various purposes, mainly for agricultural use. In Hilti catchment, there are 634 production wells that have been drilled and used for a number of years, 630 wells of them are located downstream of the Hilti/Salahi dam.
In this study, the TDS and the nitrate were the primary factors evaluated.
A GIS system was used to characterize the quality of groundwater down gradient of the Hilti/Salahi Dam.
Fig.1 Dams in Batineh area
The Hilti dam, the groundwater wells and the groundwater chemistry have been integrated into ArcGIS in order to carry out the study.
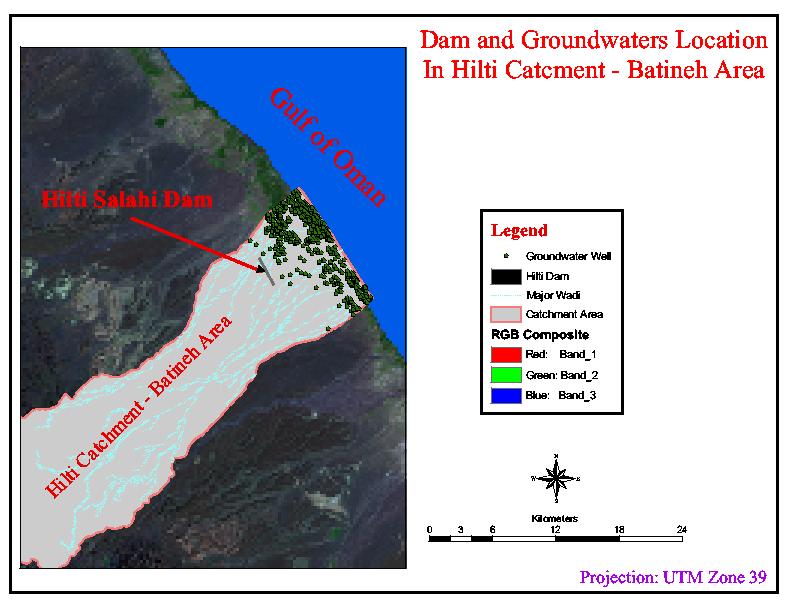
Fig.2 Hilti/Salahi Dam in Batineh Area, Sultanate of Oman
II. GIS approach
GIS analysis provides meaning to the database. After integrating the chemical database and the digital data files into the GIS system, three steps were taken to perform the spatial analysis:
II.1 Step one: Joining Tables
The groundwater analysis was saved in a table with a database format. It contained an identifying number for each well and the results of water quality tests. Parameters tested were salinity as represented by total dissolved solids (TDS), chloride, sulphate, sodium, potassium and nitrate concentrations. Results were expressed in mg/l. In order to use this nonspatial data for analysis in GIS it was integrated into the GIS and joined to the layer attribute table of the groundwater wells, which contained the well number and plane coordinate (UTM zone 39) of each well. The well number field was used as the common field to perform the joining. The TDS and the nitrate information was then classified and symbolized for display on maps.
II.2 Step two: Data Classification
Because the TDS and nitrate are quantitative attributes (numeric), it is easy to symbolize them. The main purpose of the classification is to see where both TDS and nitrate values of the groundwater lie in relation to one another on a continuous scale in the study area.
Classification methods can have a strong effect on how the chemical data will be presented on the map. To give more depth and meaning to the TDS and nitrate value, these two variables were classified manually using the Graduated Symbols approach. The Graduated Symbol legend works well with numerical attributes of point features such as the chemical concentrations in groundwater samples. Four symbol sizes were selected to cover the ranges of both TDS and nitrate concentrations. The symbol sizes from smallest to largest are associated with corresponding attribute values from lower to higher. The range of values for each symbol size was coordinated manually to match value ranges in the Omani water quality guide lines. Each symbol was assigned a different color and the same colors and symbol sizes were used for both TDS and nitrate concentrations.
II.3 Step three: Create Potential Mapping
Analysis with an advanced GIS system can be carried out by various operations such as measurements, statistical, mathematical computations and fitting models.
One of the most popular GIS analyses is to transform the sample points into a plane surface, or in other words, converting points to area. An interpolative mathematical method is applied in this study. This means that attributes of the TDS and nitrate measured at each groundwater well are spatially continuous variables and mappable as a single-valued surface. Interpolation method is appropriate for converting each TDS and nitrate value to an area representation.
The interpolation process involves estimating the TDS and nitrate values at a series of well locations using the Spline method. The Spline method is one of the most wide used methods of surface modeling. The Spline method estimates values using a mathematical function that minimizes overall surface curvature, resulting in a smooth surface that passes exactly through the input groundwater wells.
Conceptually, it is like bending a sheet of rubber to pass through the wells while minimizing the total curvature of the surface. It fits a mathematical function to a specified number of nearest input wells while passing through an individual groundwater well. This method has proved to the most useful for various applications such as water table fluctuation and groundwater contaminations.
III. Geochemistry of Groundwater
There are various factors contributing to the major constituents of the groundwater. The most important factors are the type of the water bearing formations, the hydrogeological condition of the recharge area, the potential mixing of different types of water, geochemical reactions in groundwater and the effects of human activity on the recycling capability of the aquifer.
III.1 Groundwater Salinity
The salinity of the groundwater wells in wadi Hilti is extremely heterogeneous, ranging between 304 mg/l and 11,088 mg/l. The inhomogeneity of the aquifer water salinity indicates that factors other than the water-rock interaction have influenced the make up of the water chemistry. In order to have better picture about the salinity distribution of the groundwater along the flow system between the dam and the coast of Oman, the salinity has been classified into 4 groups (Fig.2). This classification is based on a combination of the Omani Guideline for drinking purposes and the hydrochemical makeup of the groundwater.
Group one is groundwater that has salinity less than 500 mg/l and group and two has salinity more than 500 mg/l and less than 1000 mg/l. Group one and two groundwater is considered fresh and suitable for drinking in the Sultanate of Oman. Group three has salinity more than 1000 mg/l and less than 2000 mg/l. This type of water can be used only for agriculture. Group four has salinity more than 2000 mg/l and less than 11,088 mg/l (Table 1). The table shows that 57% of the groundwater wells is considered brackish water (salinity higher than 1000 mg/l), which means group 3. This phenomena demonstrates that, as a result of overpumping and extensive use of groundwater for irrigation, the quality of groundwater shifted from fresh water to brackish and saline type of water.
Figure three shows that the salinity of the groundwater wells are increasing as we move far from the dam. The low salinity is observed for the groundwater wells located directly downstream of the dam. The high salinity is observed in the wells located far from the dam and mainly in the wells drilled along the coast. More than 90 % of the wells located within a radius of 5 km of the Hilt/Salahi dam have fresh water (salinity less than 1000 mg/l). This indicates that the Hilti/Salahi dam water may be improving the groundwater quality.
Table 1 Groundwater salinity down stream of Hilti|Salahi Dam
|
TDS (mg/l) |
Number of Wells |
% of Wells |
|
300 � 500 |
53 |
8.0 |
|
500 � 1,000 |
218 |
35.0 |
|
1,001 � 2,000 |
228 |
36.0 |
|
2,001 � 11,088 |
132 |
21.0 |
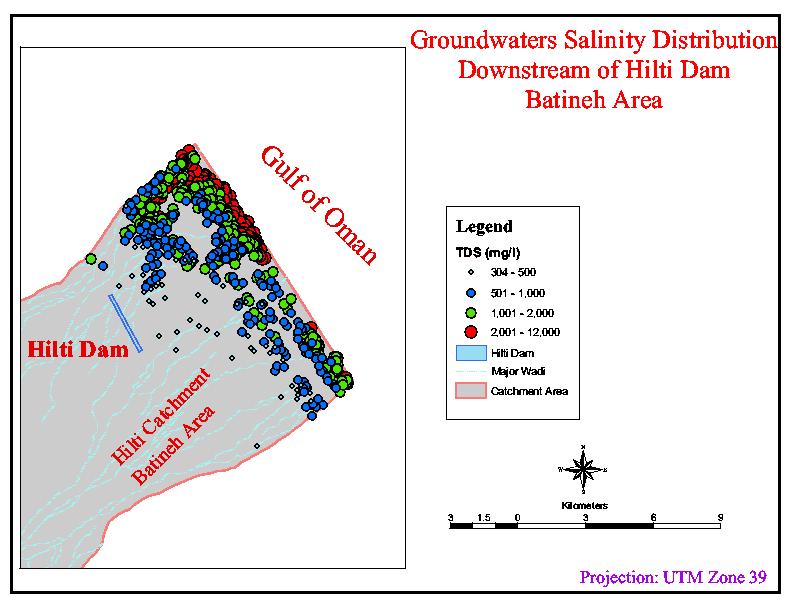
Fig.3 Salinity Distribution in Groundwater
III.2 Nitrate in Groundwater
The other chemical parameter that has been taken in consideration to verify the influence of the Hilti/Salahi dam on the quality of groundwater is nitrate (NO3-). In general, the natural abundance of nitrate in groundwater is very low (less than 10 mg/l). Nitrate values in groundwater higher than 10 mg/l indicate that groundwater has been contaminated. The sources of nitrate in groundwater in the study area are of both organic (sewage) and inorganic (agricultural) sources.
An elevated concentration of nitrate in the groundwater has been observed in the wells (Table 2). Almost 50 % of the groundwater has a source of contamination. Low concentrations of nitrate have been found in the wells in the east south direction from the dam. They have also been in the wells located mainly along the coast, with exception of three wells (Fig.4).
Table 2 Nitrate concentration downstream of Hilti/Salahi Dam
|
NO3 (mg/l) |
Number of Wells |
% of wells |
|
1 � 10 |
341 |
54.0 |
|
10 � 45 |
253 |
42.0 |
|
45 - 65 |
23 |
4.0 |
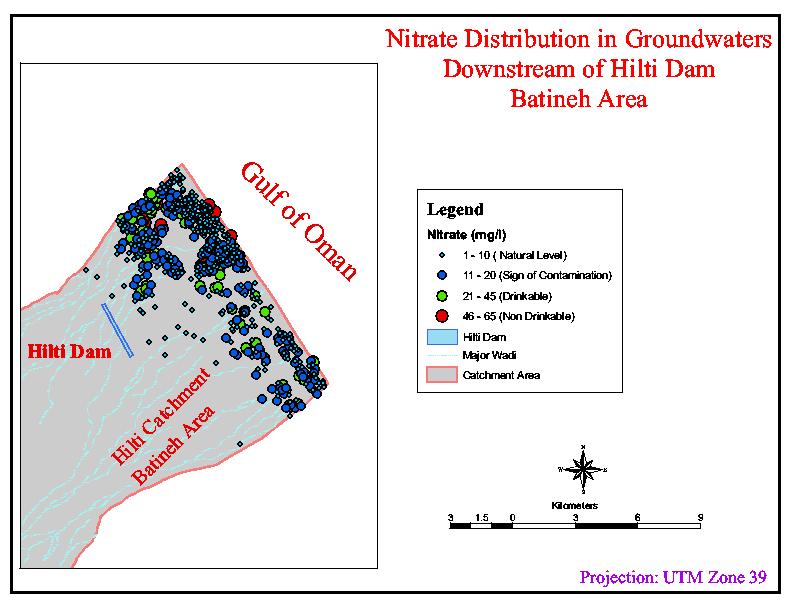
Fig.4 Nitrate Distribution in Groundwater
IV. Discussion
A comparison between Fig.3 (TDS distribution) and Fig.4 (nitrate distribution) shows that there are three groups of wells (Fig.5): Group one is wells with high salinity and low nitrate concentration. This group of wells is found in the wells located along the coast. The reason behind the elevated salinity and low nitrate concentration in this group of wells is due to salt intrusion. This phenomenon occurs due to over pumping and subsequent lowering of the water table, which permit the seawater to intrude the usable part of the aquifer.
There are three hydrochemical factors, which indicate that the salt intrusion is the main mechanism that affected the quality of the shallow groundwater along the coast. First, the high salinity in some groundwater wells is due to high concentration of chloride, which is considered the main component of seawater. In addition, the majority of the groundwater located in proximity to the coast has high TDS classified as magnesium chloride (Mg-Cl2) type of water. Factor two, 99 % of the groundwater has a magnesium : calcium moloal ratio higher than 1. This is because magnesium is present in seawater at a greater concentration than is calcium. This ratio is reflected in the groundwater invaded by seawater. Factor three is the low concentration of nitrate in the groundwater wells. This is because the nitrate concentration in seawater is completely negligible, less than 0.5 mg/l.
The second group of wells has high salinity and high nitrate. This group of wells is located far from both the coast and the dam. The contributing factors of both TDS and nitrate are the re-irrigation water and the excessive use of fertilizers.
The third group of groundwater has low salinity and low concentration of nitrate. This groundwater has been found in the wells that are located directly downstream of the dam. This is an indication that the infiltrated water from the Hilti/Salahi dam is replenishing the groundwater and improving its quality.

Fig. 5 Potential mapping representing the salinity distribution
The TDS and Nitrate concentrations in the groundwater wells have been taken as indicators to verify that the Hilti/Salahi dam is playing a role in replenishing the groundwater and improving its quality. The result shows that the majority of the wells located downstream the dam is considered of good quality water that could be used for drinking purposes based on the Oman Guideline or for nonrestricted irrigation. The wells located far from the dams show either high concentration of nitrate and high salinity or high salinity and low nitrate concentration. The reasons are due to salt intrusion caused by overpumping from the wells located along the coast and re-irrigation in the area far from the dam and the coast.