This study considers fleet routing and scheduling in urban sites of the Brasilia City. The aim of this work is find out cheaper paths considering truck loads and delivering time restrictions. The paper explores the integration of a saving heuristic to the ArcView 3.2 and a software written in FORTRAN 4.0 was created to allow this heuristic to be used in GIS Arc View in order to facilitate the creation of clusters when many clients are analysed at the same time. The results obtained with the use of this heuristic, route definitions and fleet scheduling, were considered very accurate. Because of its low need for operator's interventions, this software is a helpful tool for managers to formulate daily fleet operations.
The structuring of an operational delivery plan involves such variables as the service-providing area, customer distribution in geographic space, number of customers, delivery schedule and road system features. Within this context, the problem of combined characteristics (Goldbarg, 2000) is clearly defined the great difficulty in finding a solution is described as the Vehicle Routing Problem (VRP).
Ever since Dantzig and Ramser first studied the VRP in 1959, innumerable researchers have developed various methods to solve this problem. This is due to the fact that the VRP plays an important role in distribution management. The basic idea of the routing problem is that through the use of vehicles, visiting a set of customers at least possible cost, either starting or ending at the depot, guarantees that each point be visited exactly once. The objective is to minimize total costs without exceeding vehicle capacity.
Fisher (1995) describes the history of the development of VRP solution strategies. The first generation of researchers in the 60s and 70s developed simple heuristics based upon saving and insertion methods. In the mid 70s the second generation started to emerge. Although the latter developed approximate approaches, they managed to solve the VRP problem with a certain optimization. The third and current generation has two main approaches: heuristics based upon Artificial Intelligence and Exact Optimization.
Many categories are derived from the classic VRP. These include time restrictions, multiple capacity, heterogeneous fleet and multiple depots. Some of the solution methods for classic VRP can be adapted to deal with additional restraints. This is much easier to be carried out through simple heuristics than through sophisticated optimization methods. In this sense, simple Saving and Insertion heuristics are much more flexible in dealing with real distribution problems.
The vehicle routing problems belong to the category called NP-hard. This means that the computational time necessary for reaching the best solution is an exponential function corresponding to the problem's size. Thus, up to today, even for the simplest formulations, exact algorithms are used to solve average size problems (with no more than 50 points), and for the great majority of practical applications heuristics methods are used. These produce good quality approximate solutions in less time.
Considering the difficulty to solve in practical terms real routing problems, it can be affirmed that the solution methods from all commercial softwares and applications for vehicle routing found on the market are heuristic in nature.
The Geographic Information Systems (GIS) cover a new class of systems for management, analysis and handling geographic data. This class makes use of an excellent link between Digital Cartography and Database. In recent years, these have become an important tool in the solving of transport problems. For, the use of precise geographic information has become a main point in developing information systems in planning, managing, operating and analyzing transportation systems.
One of the potentials of Geographic Information System when coupled with the optimization algorithm is to provide solutions in real time for big and complex spatial localization problems (Esri, 1996). The creation of routes using GIS allows for highly reliable results in the calculating of distances extracted from a road system.
The development of optimization algorithms for the solving of these types of problems, was restricted for a long time to the use of tools incapable of visualizing the problem's data and its solutions, particularly, when iterative search techniques are used, in which the appropriate visualization of the data problem together with the initial solutions would allow for making the various adjustments required for these solution techniques to be successful.
However, before using GIS as the final help tool in decision-making, some factors must be considered, such as accuracy of the geographical data. The information from this data must reflect the real space being worked, as well as the possibility to update this space. Another point to consider is that commercial GIS keep their algorithms (or internal routines) tight-lipped and this does not allow for an internal analysis of their potential. Moreover, they do not make use of features that give more appropriate support to users when they need to deal with more complex problems. Thus they are left only to trust in manufacturers' information regarding the quality of response.
The physical distribution problem of food products to retail customers by a medium delivery company, with its own fleet, operating in the city of Brasilia was the logistic system studied. This type of company serves two kinds of markets: the regional market (the Center-West Region that includes the states of Tocantins, Goiás and the Federal District), and the local market (Brasilia and surrounding cities). These markets are made up of two types of customers: the wholesale customer and the retail customer.
In general, the wholesale customer presents less difficulty in solving problems concerning meeting company demands, because this type of customer makes requests for larger batches of products. Thus, there are vehicles used exclusively in the transport of such orders, in the so-called one to one system, usually operating at high occupational rates.
At the same time, the retail customer covers an extensive distribution region. Retail customers are spread over a geographic space, and so this represents a serious difficulty when companies are planning their service providing. This is so mainly because the volume of orders made by these customers is low and so, the total vehicle capacity is not used. In addition, customers who do not always form part of neighboring service-providing zones are placed on the same route itinerary and so delivery times go beyond the workday defined by the company.
Thus, it can be observed that delivery services are carried out in an empirical form. This leads to a series of problems of an operational and economic nature, such as:
due to the fact that the company does not have a delivery operation plan for retail customers, the vehicle fleet operates at occupational rates below the level necessary to cover transport costs;
due to the lack of delivery planning, customers normally wait more time to receive merchandise than the time stipulated by the delivery company. This therefore increases the waiting period for the customer as well as the delivery time for the next customer;
this delay in the delivery times produces different levels of services, bringing about new distribution costs and the consequent returning of merchandise;
salespersons and driver teams operate in empirically defined zones based upon their own experience and knowledge of the region.
Physical distribution operational procedures start at a fixed time with the consolidation of the customers' orders. Then, these orders are sent to the dispatching area, where they are separated according to zone, and later on they are delivered to each vehicle operator with their respective invoices. Based upon the customer lists received, each driver traces the routes and delivery sequence.
The operational problems cited above are common in small and medium Brazilian companies where the lack of technicians and specialists in the logistic area is evident. The lack of development of softwares and accessible methods for management's knowledge base in these companies is also apparent. Nevertheless, it is important to point out that the prices of logistic softwares on the market are high when compared to the liquid income of these companies. However, the problem does not lie in this area. It lies in the need for specialists to implement and operate these systems. Training specialized human resources in this area of knowledge is a long-term process, which also requires changes in organizational culture and an enterprising vision from senior executives, managing these companies.
In light of this context and this study's aim to contribute towards the development of an agile, practical, simple system, accessible technologically and economically, that supports small and medium companies in the strategic and operational planning of the physical distribution of products, this work was developed. Its main objective is to develop a computational program that integrates a network mathematical model with GIS software. The program has a user friendly interface system so that the latter will not have to intervene in the procedures carried out by the algorithm.
Based upon this proposal, this study seeks to provide a decision-making model for developing a fleet routing and scheduling plan according to vehicle capacity restraints, customer work cycle, travel time, the city's spatial features and traffic circulation norms.
In order to achieve the objective set out in this work, the potentials of the different GIS softwares available on the national market were analyzed. The ones considered were those that possess extensions which take into account VRP and that allow for integrating their database with the programming language used in applying the mathematical model for fleet routing and scheduling. Their technical comprehensibility and acquisitional costs were also taken into account.
From this study, the most accessible software both in technological and economic aspects, in addition to being very popular at the institutional and academic levels was the ArcView 3.2, created by the Environmental Systems Research Institute (Esri). Another aspect that justified the use of ArcView 3.2 in this research is its easy in reading databases proceeding from Excel, Access and archives in format dBASE III and dBASE IV for being softwares widely used in small and medium companies. This would facilitate the implementation of this type of tool as an aide in the decision-making process relative to Operational Planning of the Physical Distribution of merchandise.
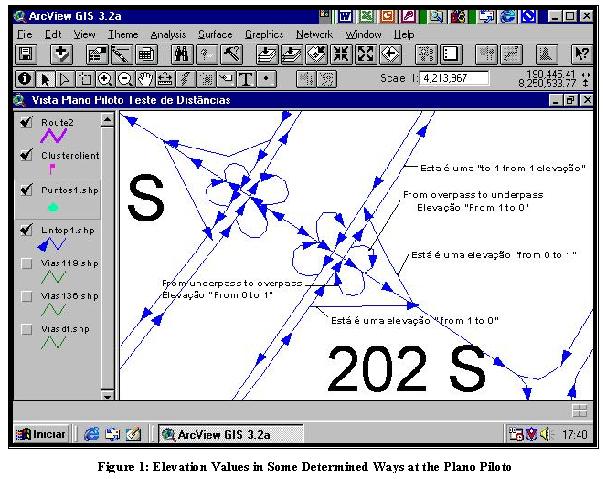
Once the GIS was defined, the next step in the research was to collect data in locus, relative to road system impedances in Brasilia, such as returns, typical conversions in the city commonly known as " tesourinhas " ("figure eights"), elevation of ways and direction signs, in order to get a true image of the city's road system (Figure 1).
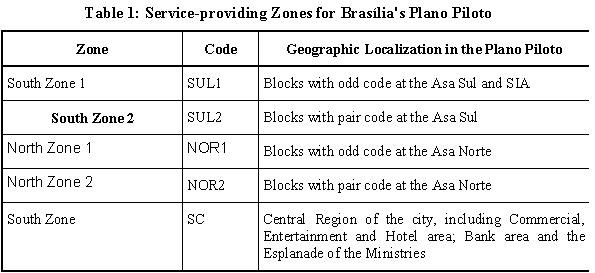
After the data collection, we started to detail the road system in the GIS. Following the methodology adopted by Pallavicine (2001), relative to zone distribution, the Plano Piloto was divided into 5 deliveries zones (SOUTH 1, SOUTH 2, NOR 1, NOR 2 and SC), as is shown in Table 1 and represented in Figure 2, considering for this division the city's spatial features.
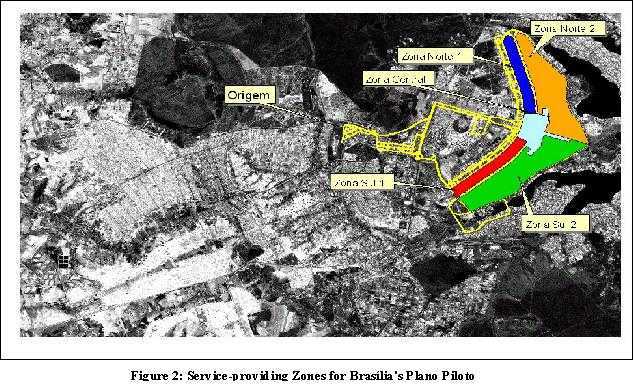
What was also studied as well the collection of data regarding batch size delivery to retail customers, as well as their geographic location (addresses) as can be observed in Figure 3.
The analysis of the impedance factors allowed for determining the efficiency of the Network Analyst (NA) application inserted in the ArcView 3.2, to calculate the best transport route for a vehicle in a previously selected network. It must be pointed out that NA is a GIS application that allows for discovering the best path between two points in a specific region, covering the least possible time and less cost, by considering impedance factors as previously mentioned, through the Dijkstra algorithm in order to make this calculation.
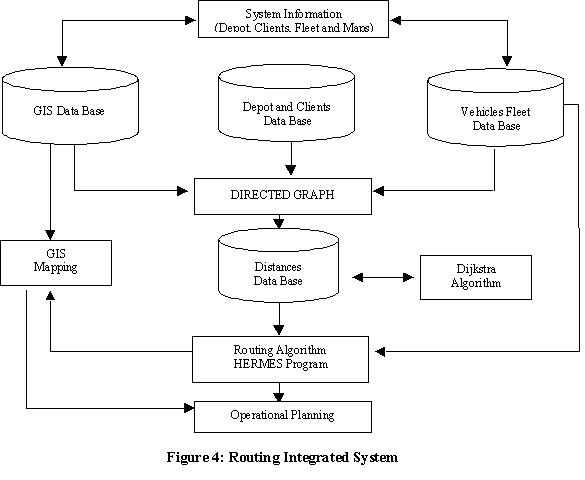
In Figure 4, it is summarized the final configuration of the Related Data Bases, described above, that will serve for the simulation of the routes to be created by using Network Analyst. With these routes we will make the comparative analysis of those gotten with the application of the program HERMES developed with this objective.
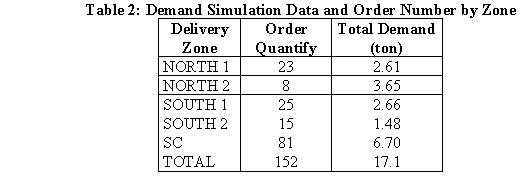
In order to study Network Analyst potentials, given that the system offers a plan of economically, viable routes, a simulated delivery program for a food distributor was conducted. The data used corresponded to a typical day in November 2000, on which 152 requests for food products were made by customers previously selected for the development of this work.
The simulation counts on a delivery fleet made up of 5 trucks, belonging to the company, (the fleet is not outsourced) and having three types of load capacity. Two of these vehicles have a load capacity of 2.1 ton; one vehicle of 1.1 ton and the two remaining vehicles have a 3.8 ton load capacity and a maximum restricted distance of 100 kilometers per route. In relation to the average speed of the vehicles, the constant value of 40km/h was adopted in this first phase of the work. The depot or point of origin is located in the Load Transport Sector in the "Plano Piloto" and is identified through the customer code 9999999.
In Table 2, the number of orders carried out is summarized according to service-providing zone as well as according to order volume.
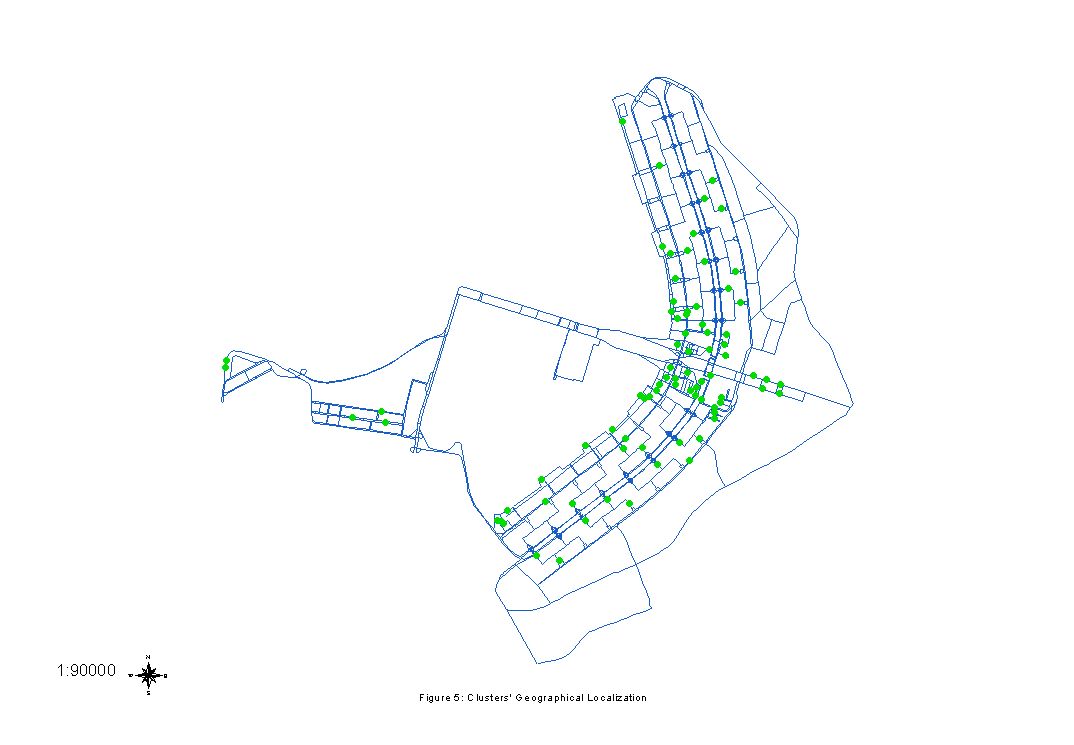
In order to develop delivery routes, the procedure of group first - route later was adopted. Thus, the grouping of 152 customers was carried out by considering the criterion of spatial proximity. For this, groups of customers located in the same square were taken (for example, a customer located in SCLN 406 was grouped with a customer from SCLN 407 because they are neighbors). Thus a new line of routes was created, representing 81 new service-providing points/depots (Figure 5). Each one of these customer groupings was identified as a "CLUSTER", thus changing their identification in this new listing.
In this new archive of delivery points, the Distribution Center is identified as point "1" and a new identification of all customers is conducted. These 81 points were used for the creating of 10 delivery routes, which take into account vehicle capacity and service-providing time restrictions per route.
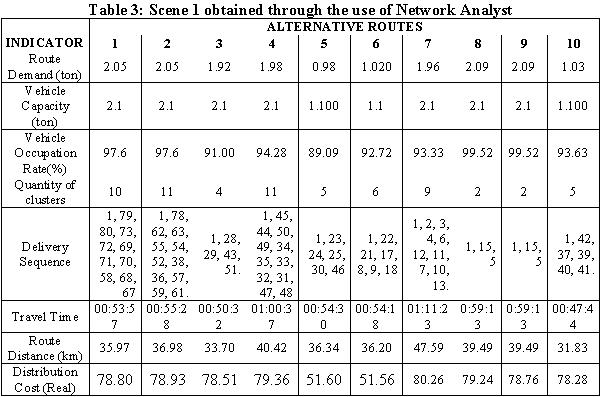
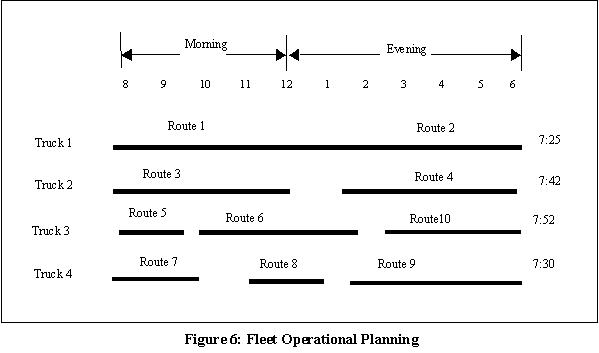
Given the fact that ArcView is a great route definer and once the clusters were created, a long route was created by using the features of "Find Best Order " and " Return to the Origin " to find out the best sequencing among these clusters. After that, smaller routes were developed by considering vehicle capacity and workday restraints. The results obtained through NA are shown in Table 3, and in Figure 6 is shown the operational planning derived from the routes gotten by the use of Network Analyst.
The distribution company studied considers as its main variables for the calculation of its transportation costs: drivers' wages, vehicle maintenance, tire wear and tear and cost per km.
Regarding fleet operational programming, the company does not have a definition of the route for drivers, normally allocated to the same zones, visited by sales persons. This explains the option for knowledge of the area both by drivers and sale persons since this leads them to always cover the same route and to carry out the same sequence of deliveries.
The use of the same delivery routes reflects the total non-existence of daily delivery operational planning. This makes it difficult to optimize transport costs, especially given the lack of control over the main variables, forming the basis of this study. These variables are:
a)kilometers covered;
b)delivery cycle times;
c)order of deliveries;
d)service time for each customer.
Considering this lack of information in the real distribution process, it is assumed that the results achieved through the simulation of the delivery routes for different customers by using NA, can serve for initial parameters in the application of a methodology that helps in the decision-making process in order to provide greater control in physical distribution of and rationalizing resources. This would represent a significant gain in relation to current practices. In light of the above, once the clusters are selected and the routes formed, they will obtain, in theory, the best sequencing of deliveries, the least total distance covered, less travel time, as well as less transport costs for this scene. In theory, due to the lack of information regarding the company’s operational planning that supplied this data, it became possible to compare all of these variables in the evaluation.
A limiting factor in obtaining the best possible route, is the fact that in the GIS used, only one travel speed value was stored for each road network stretch. This did not include the time of day and so it was not possible to consider average speeds or travel times that varied according to the time of day and which could reflect congestion periods.
Another point of evaluation of the extension NA in relation to travel time is the impossibility to register times of service-providing for each customer, so that for the routes calculated in this scene, the time of service-providing for customers was considered as zero. In practice, this criterion does not reflect the real travel time for the routes, meaning that a greater number of routes would need to be planned to meet deliveries.
Restricting delivery volume was considered as one of the main criteria in grouping customers by proximity in diverse clusters created for routing, and for route creating. Clusters both pertaining or not to the same service-providing zone were considered.
One of the disadvantages to the use of NA as an additional tool in the routing activity of a fleet is the lack of a function that carries out the fleet's operational programming. Thus, this activity occurs in an empirical way. That is, once the customers are grouped in clusters, they are placed in vehicles in accordance with the order size and, for each route generated, a map with a graphic representation of the route is also generated.
In order to mitigate the deficiency in the NA regarding the inclusion of customers in stipulated paths, the development of a computational program is proposed. This will use geographical databases constructed for the application of the NA and will seek to integrate a routing algorithm to the GIS ArcView 3.2, thus perfecting results obtained.
The network analysis algorithm selected in this work was the Clarke and Wright’s economies algorithm (Clarke and Wright, 1964), because it is a practical, simple algorithm and allows for incorporating various types of constraints efficiently. The application of the algorithm was conducted through the development of a program in language FORTRAN (version 4.0) for Windows, called HERMES.
Considering that one of the basic requirements of CW algorithm is the use of origin-destiny matrix, that contains the distances between customer i to customer j, from which are developed future procedures, the calculation of these values was made by the Network Analyst application for each pair of existing points in the customers' archive constructed in ArcView 3.2.
As was previously mentioned, the algorithm inserted in the NA to calculate the minimum path is the Dijkstra algorithm. Based upon this algorithm, the calculation of the existing distances between pairs of customers was carried out for a selected delivery zone. The matrix of distances obtained was an asymmetrical type, therefore, both values were considered within the program, thus obtaining a full 80x80 matrix. Once the distances between points were calculated, these values were stored in the Database MATRIX to be used immediately by the HERMES program.
The data relative to the fleet were the same ones. There were the same constraints, that is, the average speed used in the program was 40 km/h, the cycle time restricted to 8 hours and service time equal to 8 minutes. Maintaining the same input constraints was geared towards comparing in the future the results of the route plans by the NA with those provided by the CW algorithm with constraints. However, this does not mean that the developed program is not apt to accept alterations in the input data.
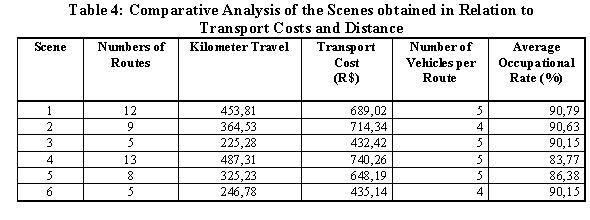
The HERMES program allowed for creating different Alternative Scenes by using the database with 152 customers grouped in 81 clusters. From all the scenes obtained, 6 were chosen to be presented in this work. The first three are the result of the application of the traditional CW algorithm with restrictions. The other three were generated by using the parameter in the form equal to 4, since it presented better savings results in the iterations conducted in order to analyze possible differences in profits, cluster groupings, travel times distance and evidently, in transportation costs.
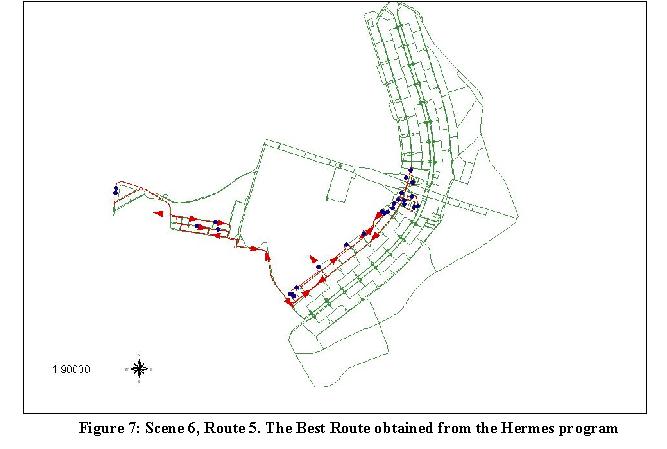
Once analysis of each Scene was carried out, the choice of the best alternative Scene was made by considering all the variables studied. Thus, we concluded that the best scene was Scene 6 because it presented the best responses regarding total transport costs, vehicle occupation rate, cycle time and the fleet's operational programming, as can be observed in Table 4. An example of a route created in the Scene selected as the most efficient is shown in Figure 7.
It is important to mention that the decision to select one set scene for the Operational Programming of a physical distribution system is a complex decision-making process, which considers many variables. Moreover, the results are extremely sensitive to changes in the company's operational conditions.
The integration of the algorithm of economies to the Arc View serves to strengthen the NA application performance given that the creation of paths through the NA is based upon the calculation of the minimum path and does not consider time or vehicle capacity constraints. In this condition the analyst's intervention is important. For, the creation of routes will depend on the analyst's sensitivity and experience in determining the best customer combination that provides a grouping that leads to the developing of the best route at the least possible cost. This situation can be attained through the integration of the economy algorithm, for which an analyst's intervention is not necessary. Moreover, the analyst does not need to be a specialist in the field to operate the system developed.
In essence, the great advantages of integrating CW algorithm to ArcView, allowing for more efficient use of these features can be affirmed. Ultimately, this integration makes possible, the representation of the results obtained through the HERMES program. At the same time, it offers a new operational system applicable to the strategic and operational systems of small and medium Brazilian distribution companies.
Clarke, G.; Wright, J. (1964) Scheduling of Vehicles from a Central Depot to a Number of Delivery Points. Operations. Research 12, 568-581.
Pallavicine,G. M. C. (2001) Contribuiçăo ao Estudo da Distribuiçăo Física de Produtos em Áreas Urbanas: Integraçăo de Modelos Matemáticos de Roteamento com Sistemas de Informaçăo Geográfica (SIG). Dissertaçăo de Mestrado, Publicaçăo T. DM-10A/01, Departamento de Engenharia Civil e Ambiental, Universidade de Brasília, Brasília, DF. 124p.
Cunha, C. B.; Gualda, N. D. (1999) Heurísticas Baseadas Na Relaxaçăo Lagrangiana Para O Problema De Roteirizaçăo De Veículos Com Restriçőes Operacionais. Transporte Em Transformaçăo II: Trabalhos Vencedores Do Pręmio CNT Produçăo Acadęmica 1997. pp. 81-95.
Dantzig, G. B.; Ramser, J. H. (1959) The Truck Dispatching Problem. Management Science, 6, 80-91.
Enviromental Systems Research Institute (1996) Getting to Know Arc View GIS: The Geographic Information System for Everyone. Esri Press, Redlands.
Fisher, M. (1995) Vehicle Routing. In: Ball, M.; Magnanti, T.; Monma, C.; Nemhauser, G. (eds.) Handbooks in Operations Research and Management Science 8: Network Routing. Elsevier Science, Amsterdam.
Fisher, M.; Jaikumar, R. A. (1981) Generalized Assignment Heuristic for Vehicle Routing, Networks, 11, 109-124.
Goldbarg, M. C. (2000) Otimizaçăo Combinatória e Programaçăo Linear: Modelos e Algoritmos. Campus, Rio de Janeiro.