With an increased public awareness of flooding and flood-related issues, many municipalities and regulatory authorities are requiring a higher degree of accuracy in flood studies and modeling. In this background, the runoff management is an essential question specially for the new constructions as public buildings which must be preserved from flooding. To obtain a realistic estimation for the new infrastructures, a full 2D modeling can be used. The efficient modeling approach is based on a hydraulic model implemented in a GIS interface which allows to produce high definition DEM and video animations for the flood dynamic. This approach, applied in very sensitive urban areas, allows to obtain a realistic description of the flooding processes.
With an increased public awareness of flooding and flood-related issues, many municipalities and regulatory authorities are requiring a higher degree of accuracy in flood studies and modeling. Today, this approach is needed specially in the urban areas where the risks are the highest for the population and the infrastructures. To meet the increased requirements in modeling accuracy, a possible strategy is to introduce full 2D modeling free surface flows to analyze the runoff which is not accepted by the sewage networks. This new approach must be associated to the traditional 1D sewer modeling.
In some particular urban areas as the French Riviera, floods can occurred due to the intensity of the rainfalls and to limited storage capacity of the sewage network. If an economic approach demonstrates that a design for these networks for an event associated to a return period of 100 years is unrealistic, it is clear that the process and the dynamic of this extreme flood must be known to be integrated into the new public infrastructures. Today, few approaches have been made to simulate the floods in the urban areas. Flood impact assessment has traditionally relied on the use of fully-dynamic branched one-dimensional (1D) models. These models are able to accurately predict flood levels and discharges in applications where the basic assumptions of 1D flow remain valid. Difficulties can arise, however, in urban areas where the flow paths on the "floodplain" - streets - can become complex to define due to the incidence of man made structures such as houses, buildings, roadways, bridges, embankments and levee banks, etc. In particular, problems arise where the analysis is required at a level of detail involving flows around individual buildings and structures where a branched 1D model is limited in its capacity to accurately represent the resulting complex flow paths.
In addition to the above, a number of recent flood events - 1999, 2000 and 2001 in France - has increased public awareness to flooding in the majority of the European countries. Further, in some high-profile flood affected areas, there has been the introduction of the concept of "zero-flooding impact" for any new infrastructure (McCowan, 1999). At the same time, municipalities wish to obtain an accurate overview about extreme urban floods and promote safe buildings. These last requirements have resulted in the need for assessment of effects in the new infrastructures, in terms of water level changes - down to 1cm or less in accuracy - and in terms of velocity. To assess impacts to such precision, particularly on large projects, requires consideration of localized effects on a very fine scale. This level of precision can only be achieved through the use of a fully two-dimensional (2D) depth averaged flow model, such as MIKE 21(DHI, 1999).
The aim of 2D modeling is to model the excess of runoff which is not integrated in the sewage network and where detailed analysis of the flow conditions is required as for a new public building. The boundary conditions for the 2D model are extracted from the sewage network modeling and introduced in the Digital Elevation Model (DEM) which covers the streets.
The traditional sewage network analysis is based on 1D modeling. However, if this approach is efficient to obtain an good evaluation of the discharges which can flow in the network, any information could be produced if an excessive runoff and a flood occurred into the streets over the sewage network. For the flood analysis in the urban area, there are a number of advantages in full 2D modeling, relative to the more conventional approach of using branched 1D models, such as MIKE 11 (DHI) or Hydroworks (HR Wallingford). Some of the main advantages can be summarized as:
Many examples can be presented to illustrate all the interests of the 2D approach: Hervouet (1994), Testa (1998), Secretan (1998), McCowan (1999), … The major difficulty in the 2D approach is located during the data integration. Accurate results could be obtained only if the input data are representative. The most important step is how to produce, from the topographical data generally established by the technical services, an efficient DEM for flood modeling. To be realistic, the final DEM must be able to represent the altitude variations due to urban furniture as sidewalk or bus-stop. So the DEM must represent variations less than 0.1m to obtain a good presentation of the overflows in the streets. The interpolation method in the GIS environment - or the modeling system - must be carefully chosen. A special procedure is needed to evaluate and compare the real world and the world in the model. A efficient strategy consists in several comparisons between longitudinal profiles created from the topographical data end from the DEM. A limited gap between profiles is acceptable if the position of water in the street and on the sidewalk is well described.
Intensive impermeabilisation of urban catchments in Mediterranean coastal areas and specially in the French Riviera, often driven by the booming tourist industry, imposes ever-growing storm water loads on usually under-dimensioned and/or outdated drainage systems. This is equally the case in traditional urban areas, as in newer tourist resorts. This deficit in drainage capacity is usually a consequence of underestimating the extent of storm water loads caused by high-intensity storms, which occur more or less regularly in most parts of the European Mediterranean coast. The table 1 presents the evaluation of the rainfall intensities calculated from the data of Cannes-Mandelieu and for different return periods.
Table 1 - Rainfall intensities for several return periods 1975-96 Cannes-Mandelieu.
|
Rainfall
|
Return period
|
|||
|
duration
|
10 years
|
20 years
|
50 years
|
100 years
|
|
6 min
|
12.5 mm
|
13.8 mm
|
15.4 mm
|
16.5 mm
|
|
15 min
|
25.8 mm
|
29.2 mm
|
33.7 mm
|
37.0 mm
|
|
30 min
|
37.6 mm
|
43.0 mm
|
50.2 mm
|
55.2 mm
|
|
1 h
|
46.5 mm
|
52.9 mm
|
61.1 mm
|
67.3 mm
|
|
2 h
|
52.7 mm
|
60.3 mm
|
70.0 mm
|
77.2 mm
|
|
4 h
|
66.8 mm
|
74.8 mm
|
85.5 mm
|
93.6 mm
|
|
6 h
|
79.9 mm
|
90.1 mm
|
103.6 mm
|
114.0 mm
|
|
12 h
|
88.7 mm
|
99.4 mm
|
113.3 mm
|
123.7 mm
|
In this hydrological background, the majority of the sewage networks could not support events over the 10 year return period and major overflows can submerged a large part of the urban areas. In several cities of the French Riviera, an interest for the impact assessment of an extreme storm associated to a returned period of 100 years progressively, appears.
A first analysis has been applied to an urban area where a new public building must be implanted. The results for the 2D modeling will be used to propose alleviation measures. The study area is located downstream two urban catchments which are largely urbanized.
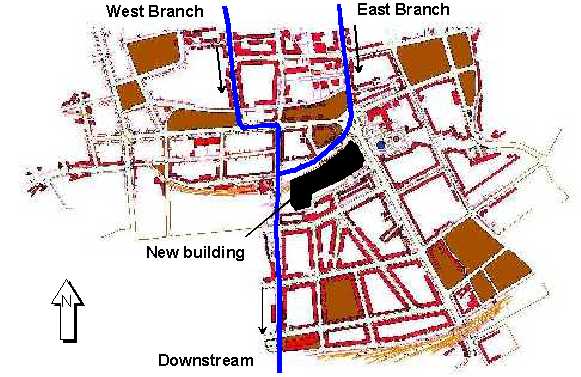
Figure 1 - Location of the sewage network and the new building.
The sewage network is organized with two main branches which are connected in the study area. The sewage network has been introduced in Mouse (DHI, 1999). The sewage network is composed with large collectors which are 2 meters by 2 meters in the upstream area, move progressively to 2 meters width and 3 meters depth and are concluded by a large collector of 4 meters by 4 meters. This last structure goes directly to sea without any new incomes in the downstream part of the city. This organization was made more than 60 years ago to preserve the downstream area from the floods which could start in the upstream hills. However, this system is associated today with a limited action because the urbanization is so high in the catchments that the network is rapidly full and overflows in the streets every year. The Mouse model has been used to evaluate the capacity of each part of the sewage network. In the study area, the east branch is saturated with a discharge of 28m3/s and the west branch is full with only 5m3/s. This limited capacity is due to reduction of the slope in the network in the study area. Even with an impressive geometry, the collectors have a limited capacity. An hydrological analysis performed with the previous rainfall data demonstrates that the network capacity is too low to assure a good runoff collection. The table 2 presents the peak values for several storms associated with several return periods.
With these hydrograhs, large overflows occur in the streets. To obtain an evaluation of the flows in the streets, 2D approach has been applied through a Mike 21 model (DHI, 1999). So, the first task was to create a DEM from the topographical data collected by the technical services and integrated in Cad environment destined to the urban management. Topographical data have been exported from these layers and integrated in the GIS ArcView. In this environment, additional points have been introduced to obtain a representative set of data to perform a coherent interpolation.
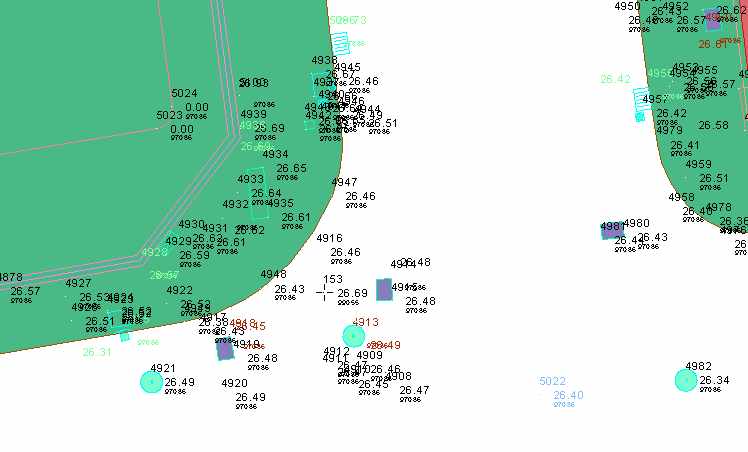
Figure 2 - Urban topographical database.
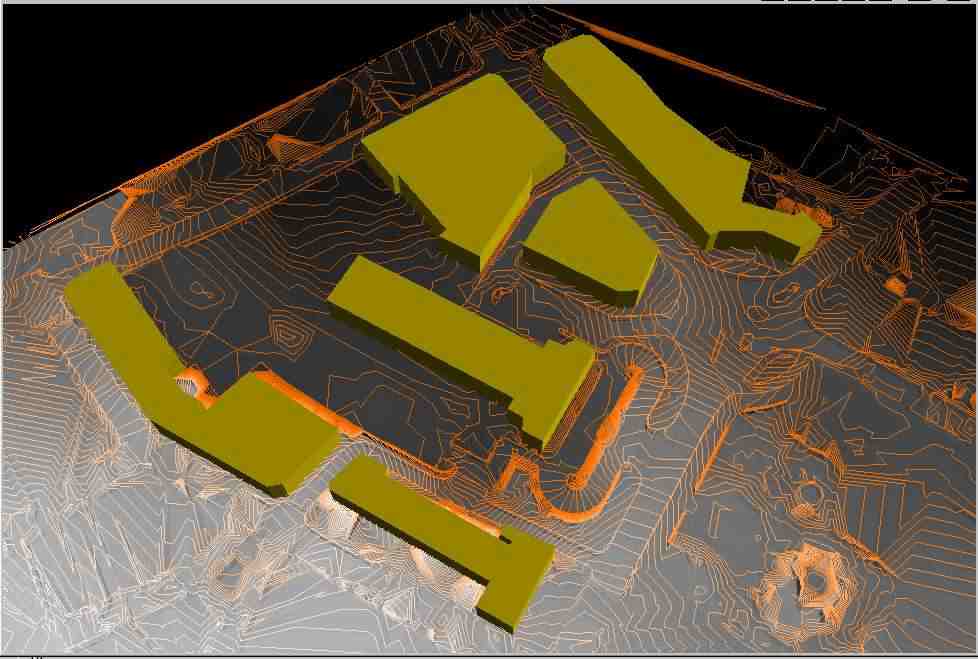
Figure 3 - 3D visualization.
The sewage network is organized with two main branches which are connected in the study area. The sewage network has been introduced in Mouse (DHI, 1999). The sewage network is composed with large collectors which are 2 meters by 2 meters in the upstream area, move progressively to 2 meters width and 3 meters depth and are concluded by a large collector of 4 meters by 4 meters. This last structure goes directly to sea without any new incomes in the downstream part of the city. This organization was made more than 60 years ago to preserve the downstream area from the floods which could start in the upstream hills. However, this system is associated today with a limited action because the urbanization is so high in the catchments that the network is rapidly full and overflows in the streets every year. The Mouse model has been used to evaluate the capacity of each part of the sewage network. In the study area, the east branch is saturated with a discharge of 28m3/s and the west branch is full with only 5m3/s. This limited capacity is due to reduction of the slope in the network in the study area. Even with an impressive geometry, the collectors have a limited capacity. An hydrological analysis performed with the previous rainfall data demonstrates that the network capacity is too low to assure a good runoff collection. The table 2 presents the peak values for several storms associated with several return periods.
Table 2: Peak discharges for several storm events.
| Return period |
10 years
|
50 years
|
100 years
|
| Peak discharges |
W.branch 52.62 m3/s
E.branch 50.14 m3/s |
W.branch 77.25 m3/s
E.Branch 75.25 m3/s |
W.branch 88.19 m3/s
E.branch 83.21 m3/s |
With these hydrograhs, large overflows occur in the streets. To obtain an evaluation of the flows in the streets, 2D approach has been applied through a Mike 21 model (DHI, 1999). So, the first task was to create a DEM from the topographical data collected by the technical services and integrated in Cad environment destined to the urban management. Topographical data have been exported from these layers and integrated in the GIS ArcView. In this environment, additional points have been introduced to obtain a representative set of data to perform a coherent interpolation.
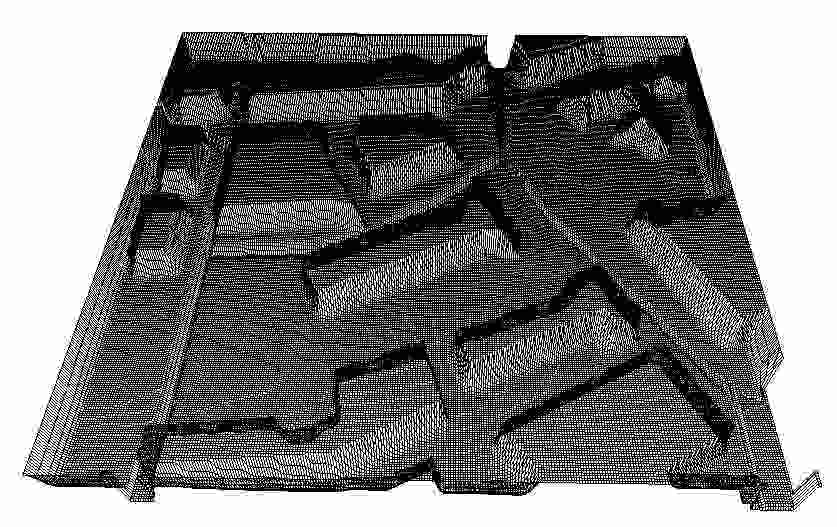
Figure 4 - DEM and grid used in the numerical model.
In order to carry out the simulation in the 2D model, it is necessary to have: - the initial conditions when the flow is contained within the sewage network and the surrounding streets are dry; - an hydrograph of the flow at the two inlets of the model (upstream boundary conditions); - the relationship between levels and discharges for the downstream conditions. The initial conditions were taken as two flow of 5m3/s and 10m3/s in the west and east branches. These values are less that the capacity of the sewage network. But, due to the low value of the roughness coefficient used (M Manning = 40), these discharges were sufficient to fill the network. The Manning coefficient has been extend with the same value to all the study area. The two hydrographs of inlet discharges were taken from the hydrologic simulations made for the two parts of the catchment and for different rainfall events. The maximum of discharge for the used hydrographs was 83m3/s. The downstream boundary condition was defined in the south part of the model as a water level chronology. The simulations have been run for 5 hours which are the total duration for the flood. From the first simulations, some difficulties appeared. To be stable, the model must be run with a very small time step (less than 0.5s). In fact, the model presents numerical instability when the overflowing starts from the sewage network into the streets and when the surfaces get wet rapidly. Due to the intensity of the slopes in all the area, the flows in the streets are very fast (speed over 3 to 4m/s). The instability is also increased by the morphology of the DEM which included some strong variations of elevation as the vertical plans between the sewage network and the surface of the streets. A possible strategy consists to modified the DEM and to "smooth" the geometry or the applied a spatial distribution in the model of the Manning parameter. However, these approach are really difficult to applied and time consuming. If one of them is applied, the results analysis appears as a complex exercise due to the bad representation of the physical processes. Another difficulty was linked to the downstream condition. To obtain a good representation of the flows, the water level chronology must be close to the real one. If this information is complex to produce, a solution consists to extent the DEM with a deep, smooth and wide domain where a flow condition equivalent to the inflows is defined. This approach permits to largely extend the stability of the model.
The different simulations demonstrate that all the overflows progressively move to the south of the model with high velocities - over 0.5 m - and with important water depths - frequently more than 0.5 m for the extreme events associated to a return period of 50 and 100 years. Despite the difficulties to run and to stabilise the model, the results obtained from the model allows to evaluate the water levels and the velocities evolution in all the study area. Outputs of the model are completely coherent with the field observations which have been done since several years. The good quality of the simulations is largely due to the quality of the DEM which has been created from the topographical data. This step in the procedure must be underlined and carefully applied. The simulated situations represent real risks which must be taken into account by the technical services and the decisions makers. From all these data, news rules can be defined for the new public buildings and infrastructures: level of floor, flood protection at the entrance of parking lots, …
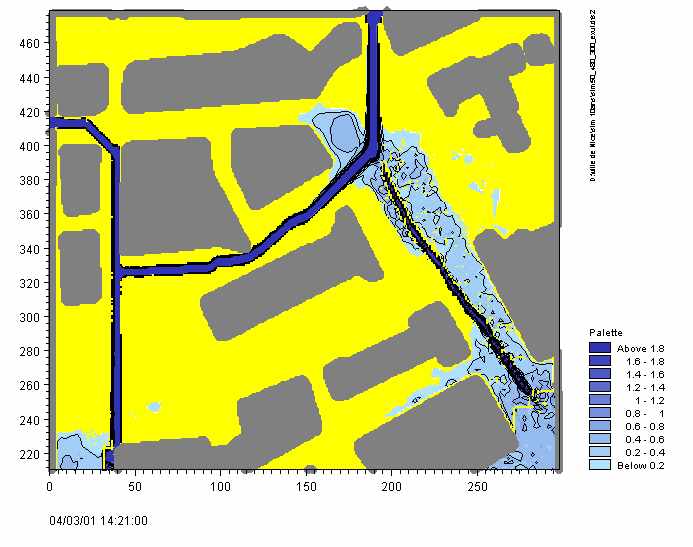
Figure 5 - Extension of overflows (water depth m).
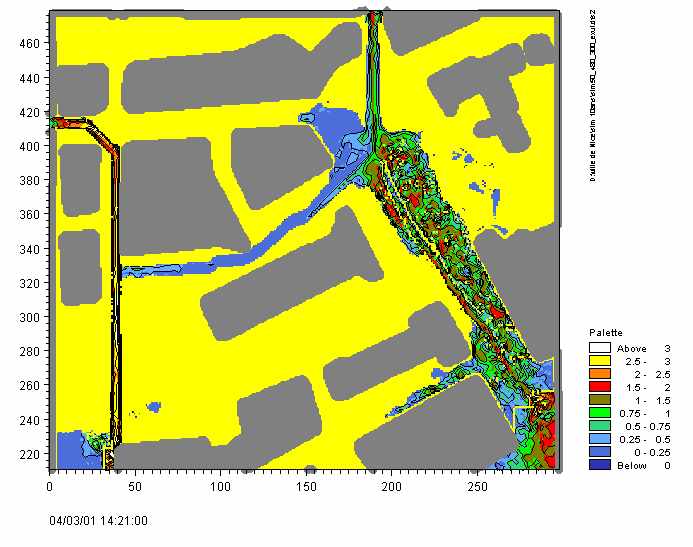
Figure 6 - Velocity fields (m/s).
The effectiveness of using MIKE 21 for full 2D flood impact assessment has been illustrated through a recent application in a city of the French Riviera. The extreme conditions used for this example demonstrate all the interest of the2D approach and the quality of the results. However, it's also clear hat this methodology is strongly dependant to the quality of the topographical data and the way they are used in the DEM. With a carefully procedure, the 2D model can be used to investigate extreme hydrological situations which could be included in different urbanization masterplans. However, some new developments (numerical analysis) are necessary to improve the stability of the numerical tools which are actually not completely oriented for this type of analysis.
Danish Hydraulic Institute (1999) 'MIKE 21 User Guide and Reference Manual,
Hřrsholm, Denmark.
Danish Hydraulic Institute, (1999) 'MOUSE User Guide and Reference Manual, Hřrsholm,
Denmark.
Hervouet, J.M., Hubert, J.L., Janin, J.L., Lepeintre, F. & Peltier, E. (1994),
The computation of free surface flows with TELEMAC: an example of evolution
towards hydroinformatics. Journal of Hydraulic Research 32, Extra issue, 45-64.
McCowan, A.D. & Collins, N. (1999), The use of Mike 21 for full two-dimensional
flood impact assessment, Users Conference DHI, Horsholm, 8p.
Secretan, Y. & Leclerc, M. (1998), MODELEUR: a 2D hydrodynamic GIS and simulation
software, Hydroinformatics'98, Babovic & Larsen (eds), Balkema, Rotterdam, 425-432.
Testa, G., Di Filippo, A., Ferrari, F., Gatti D. & Pacheco, R. (1998), Two-dimensional
model for flood simulation over flat dry areas with infrastructures, Hydroinformatics'98,
Babovic & Larsen (eds), Balkema, Rotterdam, 231-238.