Author: Elizabeth K. O'Dea
This paper offers one approach for teachers to more easily incorporate GIS and community mapping into secondary science curriculum with minimal training. ArcIMS was used to create Tahoma Virtual Atlas, a physical geographic atlas of local data compiled from various organizations. The atlas will be incorporated into secondary integrated science curriculum in the Tahoma School District, Washington, and serve as a base on which students and teachers can add their own data. The simple Internet interface will allow teachers to focus less on teaching GIS technology and more on using GIS as a tool that complements their curriculum.
In his plenary address to the Environmental Systems Research Institute (Esri) Education User Conference, Dr. Robert Downs stated that geographic information systems (GISs) needed to become as ubiquitous in the educational system as the yellow pencil (Downs 2001). The benefits that GISs can bring to education are numerous, enhancing curricula with spatial reasoning, problem solving, data analysis, and interdisciplinary real-world subject matter (Audet and Paris 1997, Kerski 2001, Meyer et al. 1999). The interactive and visual nature of a GIS is generally more interesting to students and has been shown to increase students’ learning in comparison to traditional methods, especially among average and below-average students (Kerski 2001, Linn 1997). A GIS has a lot to offer secondary science education, particularly in more student-centered classes where students are active participants (Audet and Paris 1997).
In comparison to its rapid growth in the professional sector, however, the use of GISs in K-12 schools has moved at a very slow pace. GISs offer a useful tool for educators to teach students about local and global communities in various subjects, particularly the sciences, but the growth in its usage is hindered by many teachers’ limited time and access to resources necessary to adequately learn the complexities of a GIS software package such as ArcView. It has been estimated that less than 2% of high schools in the United States have adopted GISs, and approximately only half of those high schools actually use it (Kerski 2001). The limited success stories are largely due to highly motivated teachers who devote much of their spare time to learning the software and designing lesson plans, as well as to GIS professionals and organizations from the community who offer their assistance. The reality is that most teachers cannot take the time needed to adequately learn the software and create lessons on top of their regular teaching duties. For teachers wishing to use local data in their lessons, the challenges can be even greater.
Many of the GIS data sets currently being used in schools are of global communities because those layers accompany the software and are easily accessible, but experience shows that students are more motivated to learn when the data pertain to their local community (Meyer et al. 1999, Alibrandi 1998). By analyzing various GIS layers from their surrounding community, students find the information more pertinent to their lives and are more likely to be interested in the curriculum. Through learning about local scientific and geographic issues, students can then use this knowledge to better understand broader global issues. Many teachers also prefer using local data sets because they open the door for more teaching possibilities, particularly in combining interactive mapping and spatial analysis with community field trips. For the inexperienced teacher learning to use a GIS, however, acquiring local data is a challenging and often frustrating task if there is no GIS professional to offer assistance. The problem is exacerbated when the data come from various sources that use different data formats and projections.
Due to its complexities, many educators who teach with a GIS as an aid must devote much of their time to teaching the technology of the GIS, when the focus should instead be on using the GIS as an educational tool that enhances their curriculum (Audet and Paris 1997, Meyer et al. 1999, White and Simms 1993). While using computer technology in education is vital for keeping students current with its rapid growth in society, educational standards restrict the amount of time teachers can devote to teaching a single software package such as ArcView. The importance of GIS use in education is not so much the technology but its ability to help students to better understand geographic concepts and spatial interactions within a community. Less complex options need to be explored and developed in order for GISs to be more easily accessible to more teachers and students. Only then will the K-12 educational system see a significant increase in GIS use.
The recent development of Arc Internet Map Server (ArcIMS) provides one potential solution to some of these challenges. An integration of GIS capabilities with Internet technology, this web GIS provides an application with which standard GIS operations can be performed over the Internet without the need for local software (Longley et al. 2001, Xue et al. 2002). This new technology offers schools a way to incorporate GISs into curricula by providing some of the basic functionality of a full GIS, as well as the appropriate data sets, in a way that is accessible via the Internet without the need for GIS software or data on local computers (Green 2001a). ArcIMS can be accessed from most Internet-accessible computers, allowing students and teachers the ability to access a GIS from inside and outside of the classroom. The interface of ArcIMS is less complex than the multiple windows and menus of a full GIS such as ArcView, thus making it easier for novices to use. It is hypothesized here that the user-friendly nature of ArcIMS potentially makes it simpler for both teachers and students to learn to use a GIS, and therefore is less intimidating and time consuming for educators to teach. This opens up the world of GISs to teachers who otherwise would not have the time or resources to learn and teach using a full GIS such as ArcView, and thus has the potential to bring GIS one step closer to becoming an integral pedagogic tool used in secondary education.
To study the feasibility of ArcIMS as a pedagogic tool, the program was used to create The Tahoma Virtual Atlas, a model virtual physical geographic community atlas. The atlas will be integrated into secondary science curriculum in the Tahoma School District in Washington.
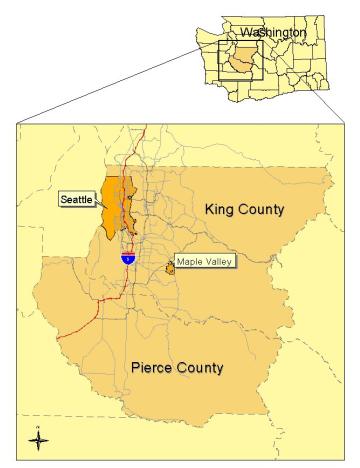
Secondary science educators in the Tahoma School District, located around Maple Valley, Washington (Figure 1), were very interested in incorporating a GIS into their integrated science curriculum. Like many teachers, however, they were limited by time and resources needed to properly learn the software and develop lessons using it. While the school district acquired ArcView GIS in 1999, implementation into the curriculum has been slow. One teacher was selected to attend a short ArcView training, and in return was expected to develop a GIS program for the district’s secondary science program and train the other teachers in how to use it, on top of his regular teaching duties. It took significant time for the teacher to develop a lesson about earthquakes using global data sets that accompanied the ArcView software. While the global and national data sets are useful for some purposes, teachers said that they would prefer to use local data sets that they could incorporate into their science courses and field trips. The challenge for them lay in not knowing where to begin in finding local data sets and what to do with them once they were found.
Figure 1. Locator map of King and Pierce Counties, Washington, and the town of Maple Valley.
As a way to investigate the use of ArcIMS as a simpler GIS option for secondary education, an online physical geographic atlas of their community was proposed to serve as a single source for exploring local data and GIS technology. The Tahoma Virtual Atlas was designed to fit some of the spatial data needs of secondary integrated science teachers in the Tahoma School District who wished to incorporate a GIS into their curriculum. The atlas covers Pierce and King Counties in Washington (Figure 1) and contains a variety of spatial data sets, primarily base data (such as roads and political boundaries) and physical geographic data (such as geology and wetlands). Physical geography was chosen as the theme of the atlas because of its collaborative nature for studying community interrelationships, blending biological, environmental, and earth system sciences with the spatial aspect of geography (Walsh 1988). The teachers’ desire was to have a GIS tool that could be used in combination with their local field studies in order to enhance their analyses, incorporate geographic concepts, and encourage improvement of students’ problem solving skills, as well as provide an option for data set expansion. The atlas was designed with the intent of meeting those needs.
After developing an initial plan, a meeting was held with ninth and tenth grade science teachers from Tahoma High School to introduce the concept of ArcIMS and the possibility of an online atlas. A demonstration was given using an existing ArcIMS site to show the functionality and ease of use that a web GIS could provide, and the concept of the Tahoma Virtual Atlas was proposed. Discussion included the benefits and drawbacks of ArcIMS versus ArcView, and what geographic areas were most critical to cover. A list of ideal layers to place in the atlas was presented, discussed and modified (see table). The layers were then ranked by priority based on which data sets would be most useful for the teachers’ intended purposes for the atlas. Pierce and King Counties were chosen as the coverage area in order to incorporate most of the areas where science field trips were taken.
Table: The initial list of layers for the Tahoma Virtual Atlas. Starred layers were designated as priority by the teachers.
| Base Data Layers | Physical Geographic Layers |
|---|---|
| * Roads | * Vegetation/Land Cover |
| * Streams | * Geology (surface, fault lines, earthquakes, landforms, landslides) |
| * Digital Elevation Models (DEMs) | * Climate (precipitation, temperature) |
| * Contour Lines | * Land Use |
| * Political Boundaries | Slope and Aspect |
| * Cities | Forest Harvest Units |
| * Watersheds | Wetlands |
| PLSS (township/section/range grid) | |
| Quad Boundaries | |
| Trails |
Significant time was spent collecting and compiling GIS datasets and their metadata from federal, state, county, and city governments, as well as from local nonprofit organizations and universities via data CDs and Internet downloads. Internet downloadable data sets were the easiest to acquire and most were free, while CDs required a fee. It was important to acquire metadata for each data set, as well as record information on how and where the data sets were acquired for future reference. Quality of the data, such as scale, resolution, and age, had to be considered when selecting layers that would be appropriate for the goals of the atlas.
When processing the data using ArcView 3.2 and ArcInfo 8.1, several issues had to be considered. Data sets came in various file formats that had to be converted to Shapefiles in order to be compatible with ArcIMS. The data came from numerous sources using different projections, so much of the data had to be converted from its original to a matching projection in order to correctly overlay. Issues of scale and resolution were also considered when designing the atlas. Some data sets were not detailed enough to meet the needs of teachers wishing to study small local areas. Finally, combining neighboring layers of the same theme, such as King and Pierce County streams, were sometimes not possible or too time consuming to fix due to various reasons such as feature misalignment or data table differences.
Once data collection and processing was completed, ArcIMS and its required components were installed. Installation of ArcIMS was a long and frustrating process, as there were a number of programs from different sources that had to be installed and working correctly prior to the installation of ArcIMS itself, such as Apache Web Server, Jakarta Tomcat Servlet Engine, and Java 2 SDK with Java Runtime Environment. Once everything was installed and running correctly, the Tahoma Virtual Atlas was created, which was a much simpler process than the software installation. ArcIMS Manager, which walked through all the steps needed to create a site, was easy to follow with the help of the Using ArcIMS guide that accompanied the software (Esri 2001). Data sets were added (Figure 2), their properties selected, and the tools to be available in the atlas were chosen. Special consideration had to be taken when adding layers and selecting their properties. It was important to place the layers in the proper drawing order to avoid hiding layers. Deciding feature properties were the most challenging because of the large number of layers in the atlas. Thought had to be given to which layers would most likely be viewed together and how best to display those layers.
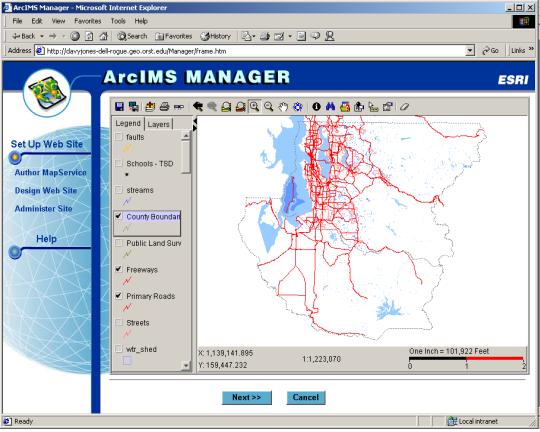
Figure 2: Authoring a MapService using ArcIMS Manager.
The next step was site customization, which required manually editing the ArcIMS site’s HTML and JavaScript files. This was also a time-consuming process, particularly for someone not familiar with the programming languages. Changes were made to the site colors and page frames. Hyperlinks to supplemental pages were also added. An introduction page was created to give an overview of the atlas. A help page was created, consisting of a tour of the main atlas page and descriptions of the available tools and their functions. A metadata index page was also created in order to provide easy access to information associated with the layers in the atlas (Figure 3). Finally, a disclaimer page was created to emphasize the purpose of the atlas as being solely educational.
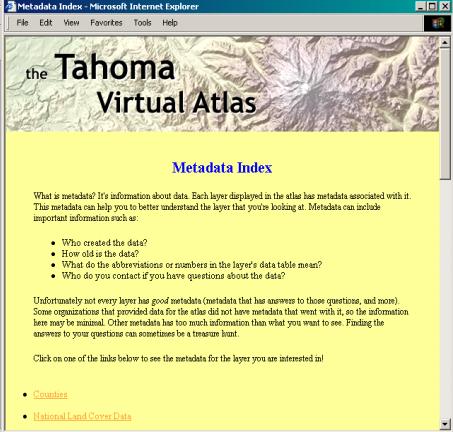
Figure 3: Metadata Index page, containing an explanation of metadata and links to atlas layers' metadata (O'Dea 2002).
The final product consists of one main web page where all of the GIS functions and information can be easily accessed (Figure 4; see end of document for URL). Students can select which layers they wish to display, zoom in and out to an area they wish to investigate, view the data table belonging to selected features, query for specific features, and perform simple data analysis. From the main page they can access metadata for many layers in the atlas in order to view information about the data source, age, and definitions of table abbreviations.
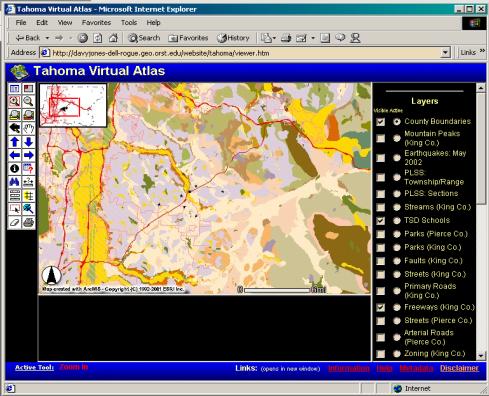
Figure 4: The main page of the Tahoma Virtual Atlas (O'Dea 2002).
Once completed, the Tahoma Virtual Atlas was introduced to the teachers. A demonstration was given, followed by a short lesson for teachers to do as an opportunity to get to know the atlas. While there were some frustrations with things such as site speed, occasional technical glitches, and some tool functions, the overall response was very positive. Those who had used ArcView before stated that the atlas was much easier to use and understand, and “more fun to play around with.” Three days after the training, one teacher was already using the atlas in his classes. During the training, use of the atlas began with some frustration and impatience on the teachers’ part, which decreased as they became more comfortable with the site. When asked to predict how their students will react to the Tahoma Virtual Atlas, one teacher responded, “They will be impatient and bored at first, until they understand how powerful it is.” The teachers were excited to be able to access local data so easily, and to have control of what layers were displayed as well as the area itself to study. The supplemental help and metadata pages were important in providing answers for questions about how to use the atlas and information behind the data sets themselves.
With the Tahoma Virtual Atlas, teachers will be able to utilize the atlas to enhance their science lessons by combining inquiry-based learning with spatial data pertaining to their local community. In exploring the local physical geography, the Tahoma Virtual Atlas can be incorporated into a variety of potential lesson plans that will integrate scientific studies with technology, as well as connect youth with their community (Alibrandi 1998). For example, in lessons about water quality where students collect data from various points along a river, those points and the corresponding data can be created as a layer, added to the atlas, and analyzed by comparing the data to other layers such as land use, vegetation, or geology in order to develop hypotheses and conclusions. Students can learn about local plate tectonics by analyzing layers such as earthquake points and fault lines, and use the buffering tool on a selected fault or earthquake site to study potential impacts on their community. Using existing animal siting information from Washington’s Nature Mapping Program (University of Washington: http://www.fish.Washington.edu/naturemapping), animal habitats can also be studied by comparing species location with types of vegetation or terrain. Other intended uses include watershed studies, mapping, local affects of global warming, and local geology.
In the future, students and teachers can build onto the base atlas by adding their own layers via various methods: acquisition of already existing data (GIS, tables, or images), creation of their own field-collected data using Global Positioning System receivers, digitizing from paper maps, or scanning and georeferencing aerial photos. To do so requires the use of ArcView at a minimum to prepare the data prior to incorporating new layers into the atlas. This provides a perfect opportunity for more ambitious teachers and students who wish to delve deeper into the world of GIS.
While some teachers have found desktop GIS programs and lessons to be useful in learning and teaching about GISs and geographic concepts, web GISs provide a new and potentially easier opportunity for incorporating GISs in education. Until now teachers wanting to use a GIS in lessons have had to devote much class time to teaching the technology (Audet and Paris 1997). While the fundamental educational objectives remain relatively consistent over time, the reality is that educational needs are constantly changing as well as the technology to support them (Mackaness 1994). That is why it is important to focus on the needs of the students in order to meet educational standards, and find ways to expose students to new technologies while supporting those fundamental objectives.
While a web GIS such as ArcIMS offers a somewhat simpler way of incorporating a GIS into the classroom, there is still inevitably much room for improvement in its technology. In creating the Tahoma Virtual Atlas it was evident that, as with other GIS programs, ArcIMS does not provide a solution to every teacher’s GIS woes. Drawbacks include various glitches that come with the territory of new software development, such as errors encountered by viewers when accessing the site. Software installation, maintenance, and site customization were the greatest challenges, particularly because there was minimal technical support during the development process. The time that it can take to access a web GIS site is also a drawback, particularly when dealing with the short attention span of students. These should become lesser issues as technology and Internet connections improve over time. Success also depends on the interest of teachers and their attitudes about the technology. There will most likely continue to be teachers who will not incorporate a GIS into their lessons, no matter how simple it is to use. For schools that develop their own web GIS, the initial expense of the software, site license, and data acquisition can also be a factor of success. Based on the increasing popularity of web GISs among GIS professionals as well as the public, combined with ever-improving technology, it is hoped that web GISs will become easier to develop and incorporate into secondary education.
ArcIMS can be an appropriate solution for some teachers, particularly if there is a GIS professional that can help with its development, or an existing web GIS site fits their needs. ArcIMS addresses some time issues for educators. The simple interface and pre-collected data of an ArcIMS site require less training for teachers to learn to use, as well as less expertise for them to teach in their classrooms. It also requires less time to present lessons to students in the classroom, therefore taking less time away from teaching a core curriculum. With the fast-growing pool of diverse web GIS sites being created, lessons involving GIS can be easily expanded to incorporate a variety of themes from different sources.
ArcIMS also addresses some of the issues regarding resources. Less software is required on the computers that students use because a web GIS simply requires a web browser to access the functionality. Computers still need to be powerful enough to effectively handle processing time, but do not require the necessary space to store GIS software and data sets. Facilities used for teaching with a GIS can be more flexible, because lessons aren’t restricted to computers that have GIS software and data installed. GIS functionality can even be accessed from students’ homes if they have access to Internet-accessible computers. Funding could also potentially be less, particularly if teachers use web GIS sites that have been created by other organizations. Currently ArcIMS offers limited capability compared to ArcView, but for some who just wish to use a GIS as an educational tool and not devote precious time to learning the technology of a GIS, the benefits of an easily accessible local atlas with a simple interface are more appealing.
In studying the development of the Tahoma Virtual Atlas, a number of benefits can be seen. By being online, the Tahoma Virtual Atlas will be accessible from almost any computer with an Internet connection and not be limited to only computers loaded with GIS software and data sets. Secondly, the ArcIMS web site offers basic GIS functionality in one interface, therefore simplifying the GIS as a tool and making it easier for teachers to center more on the subject that they are teaching and less on training students in how to use the GIS. This allows teachers more time to focus on teaching material that meets educational standards. Thirdly, more teachers will be able to incorporate the atlas into their courses because less training is needed to comfortably use the ArcIMS web site than is needed with a full GIS such as ArcView. Those who find ArcIMS too limiting in its GIS capabilities can use ArcView for more in-depth analysis using the same data sets that are displayed in the atlas. Finally, the atlas can be continually expanded by further collection of already existing data sets or student-created data sets collected from hands-on fieldwork. In addition, the atlas can be expanded to other subjects such as history or social studies. When combined with curriculum and hands-on fieldwork, this ArcIMS atlas will provide a unique opportunity for students to learn about the complex interrelationships within their own community from a new perspective.
In order to successfully create and integrate a web GIS and community mapping into secondary science education, several things are necessary:
Alibrandi, M. 1998. GIS as a Tool in Interdisciplinary Environmental Studies: Student, Teacher, and Community Perspectives. Meridian. http://www.ncsu.edu/meridian/jun98/feat2-3/feat2-3.htm (February 2002)
Audet, R. H., and J. Paris. 1997. GIS Implementation Model for Schools: Assessing the Critical Concerns. Journal of Geography 96(6):293-300.
Downs, R. M. 2001. Plenary address. Presented at Esri Education User Conference, San Diego, California. July 6.
Environmental Systems Research Institute, Inc. 2001. Using ArcIMS. Redlands, CA: Esri.
Green, D. R. 2001. Preface. In GIS: A Sourcebook for Schools, D. R. Green, ed., xvi-xx. London: Taylor & Francis.
Kerski, J. J. 2001. The Implementation and Effectiveness of Geographic Information Systems Technology and Methods in Secondary Education. In Proceedings, 21st Annual Esri User Conference. San Diego, California. http://www.Esri.com/library/userconf/proc01/professional/papers/pap191/p191.htm (November 2001)
Linn, S. E. 1997. The Effectiveness of Interactive Maps in the Classroom: A Selected Example in Studying Africa. Journal of Geography 96(3):164-170.
Longley, P. A., M. F. Goodchild, D. J. Maguire, and D. W. Rhind. 2001. Geographic Information Systems and Science. Chichester: John Wiley & Sons, Ltd.
Mackaness, W. A. 1994. Curriculum Issues in K-12. GIS/LIS ’94, 560-568. http:// www.odyssey.maine.edu/gisweb/spatdb/gis-lis/gi94070.html (May 2002)
Meyer, J. W., J. Butterick, M. Olkin, and G. Zack. 1999. GIS in the K-12 Curriculum: A Cautionary Note. Professional Geographer 51(4):571-578.
O’Dea, E. K. 2002. The Tahoma Virtual Atlas. http://davyjones-dell-rogue.geo.orst.edu/website/Tahoma/viewer.htm(May 2002)
University of Washington. The NatureMapping Program.http://www.fish.washington.edu/naturemapping/onek12.html (March 2002)
Walsh, S. J. 1988. Geographic Information Systems: An Instructional Tool for Earth Science Educators. Journal of Geography 87(1):17-25.
White, K. L. and M. Simms. 1993. Geographic Information Systems as an Educational Tool. Journal of Geography 92(2): 80-85.
Xue, Y., A. P. Cracknell, and H. D. Guo. 2002. Telegeoprocessing: the Integration of Remote Sensing, Geographic Information System (GIS), Global Positioning System (GPS) and Telecommunication. International Journal of Remote Sensing 23(9):1851-1893.
The Tahoma Virtual Atlas is accessible from a link located at
http://www.geocities.com/gisliz2002/.
The atlas is temporarily located at
http://davyjones-dell-rogue.geo.orst.edu/website/Tahoma/viewer.htm until Fall 2002.
For more information, the thesis from which this paper was taken can also be accessed from a link located at
http://www.geocities.com/gisliz2002/.
Elizabeth K. O'Dea
Master's Student in Geography
Department of Geosciences
Oregon State University
gisliz@hotmail.com
http://www.geocities.com/gisliz2002/