Currently, EPA's Watershed Assessment, Tracking & Environmental Results (WATERS) system is integrating various EPA Office of Water programs with surface waters georeferenced (reach indexed) to the 1:100K National Hydrography Dataset (NHD). As progress is made to implement higher resolution versions (1:24K) of the NHD, geographic representations of water databases will become more detailed and accurate. Examples of states moving to represent their Water Quality Standards(WQS), assessed waters, and 303(d)/TMDL impaired waters at the 1:24K scale will be examined. NHD-based GIS tools will be highlighted showing technical approaches to facilitate the transition to higher resolution georeferencing.
The U.S. Environmental Protection Agency (EPA) Office of Water, Office of Wetlands, Oceans and Watersheds and Office of Science and Technology (OST) are mapping the nation's impaired waters, assessed waters, and the designated uses of waters to the National Hydrography Dataset (NHD). Assessed waters are submitted to EPA by states in accordance with section 305(b) of the Clean Water Act. Impaired waters, which do not meet the designated uses defined in state water quality standards (WQS), are listed by states as required under section 303(d) of the Clean Water Act. The EPA OST coordinates the mapping of the WQS-designated uses from the various jurisdictions of states, tribes, and U.S. territories. This coordination is facilitated by use of the National Water Quality Standards Data Base (WQSDB), which ties together the designated uses of different states into a consistent, national format.
EPA is integrating its databases into one common geographic platform. The integration project, known as WATERS (Watershed Assessment, Tracking & Environmental Results), unites water quality information previously available on individual state agency home pages and several EPA Web sites. State and federal water quality managers, as well as interested citizens, can use WATERS to quickly identify the status of individual waterbodies of interest to them. WATERS can also be used to generate summary reports on all waters in a given state. Currently, WATERS can display program information that includes impaired waters from the 303(d) list and the designated uses from the WQSDB. EPA will update WATERS as new information becomes available. For a detailed description and future releases of WATERS (currently available on the Internet at http://www.epa.gov/waters), see Dewald (2001). The Internet repository of state and tribal water quality standards is also available on EPA's Web site at http://www.epa.gov/ost/wqs. This Web site can be used to obtain the full text of water quality standards that are in effect under the Clean Water Act for each State and for each Tribe authorized to develop standards.
NHD is currently available in the 1:100,000 (1:100K) scale from the U.S. Geological Survey (USGS) for the continental U.S. Some states are moving to higher resolution representations of their waters, such as 1:24,000 (1:24K) scale. USGS is currently developing a higher resolution NHD to facilitate this transition. The 1:100K and high resolution NHD, available on the Internet at http://nhd.usgs.gov, provide a consistent hydrography layer to which data (such as the State-designated uses) can be attached (USGS and EPA, 2000).
RTI compared the 1:100K NHD to some of the available higher resolution NHD (1:24K) and some of the available 303(d), 305(b), and WQS indexing work. This comparison was performed to highlight the differences in the coverages and to determine the effects that these differences have on indexing these three programs. Geographic information systems (GIS) tools created by RTI were used to facilitate this process. These tools include the National Hydrography Dataset Reach Indexing Tool (NHD-RIT) and an automated process for indexing general or default use waters.
The NHD-RIT is an interactive GIS application that allows users to georeference surface water data using the NHD. The process of identifying and assigning entity IDs or attributes to portions of the NHD data set is referred to as reach indexing. The NHD-RIT assigns entity IDs or attributes to user-selected portions of the NHD through the creation of event tables that can be displayed as themes in ArcView using the Environmental Systems Research Institute (Esri) dynamic segmentation model. This not only protects the integrity of the nationally consistent NHD dataset; it also gives the user more flexibility (in comparison to other methods) to delineate entities. Event tables allow for the creation of event "reaches," which can represent an entire reach in NHD or only a portion of a reach. This allows the user to delineate any desired surface water entity, even if it is not coincident with the start and endpoint of reach segments in the NHD. More information about the NHD-RIT is available at the EPA georeferencing Web site: http://www.epa.gov/owow/monitoring/georef/.
Comparing the 1:24K NHD to the 1:100K NHD
A general comparison of the 1:24K NHD and the 1:100K NHD was performed using ArcView GIS. The comparison was based on the 94 1:24K NHD subbasins that were available for download from USGS as of April 26, 2002. Subbasins were not randomly selected, but were instead chosen to approximate the different hydrologic areas within the U.S. The 20 selected subbasins covered 18 states. Alaska was intentionally not included because it lacks the 1:100K NHD.
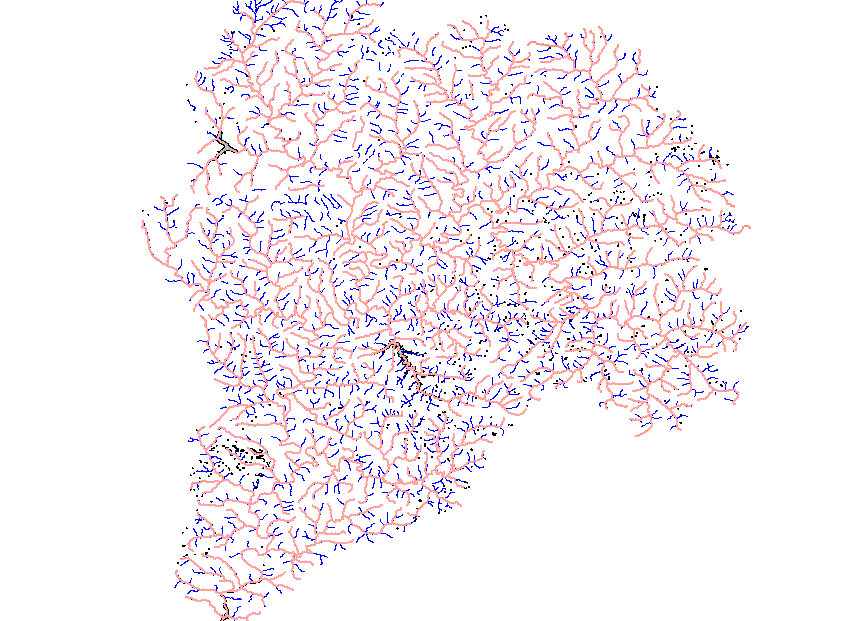
As one would expect, the 1:24K NHD contains approximately three times more linear reaches than the 1:100K NHD contains. Averaging the reach lengths, one finds that 1:24K reaches are about one-half the length of 1:100K reaches. This is due to the addition of approximately 2,000 linear reaches (on average) per subbasin, most of which are small tributaries that would not show up at the 1:100K scale. Figure 1 shows a comparison of the 1:24K NHD and the 1:100K NHD for a Kentucky subbasin. There were also a greater number of named reaches in the 1:24K NHD, although the percentage of named reaches decreased. This increase in the number of named reaches was due to some larger rivers having additional reaches named in the 1:24K NHD and the addition of some smaller named rivers. Table 1 summarizes the comparison of the linear 1:100K NHD and the 1:24K NHD.
Figure 1. Comparison of the 1:24K NHD (blue) to the 1:100K NHD (pink) for KY subbasin 05130102.
Table 1. Summary of the 1:100K and the 1:24K Linear Comparison
| Type | Average number of linear reaches per subbasin | Average length of linear reach in meters | Percent linear reaches named |
|---|---|---|---|
| 1:100K NHD | 1,129 | 2,342 | 37.43 |
| 1:24K NHD | 3,482 | 1,279 | 16.92 |
Waterbody reaches are aerial features of the NHD that allow the user to link data about lakes and ponds to the coverage. The average 1:24K NHD subbasin contained an order of magnitude (i.e., ten times) more waterbody reaches than its 1:100K counterpart. There was also a marked decrease in the average area of waterbody reaches in the 1:24K NHD. As with the linear reach comparison, the number of named waterbody reaches increased from the 1:100K NHD to the 1:24K NHD, but the percentage of named reaches decreased. Table 2 outlines the comparison of the 1:24K NHD and the 1:100K NHD waterbody reaches.
Table 2. Summary of the 1:100K NHD and the 1:24K NHD Waterbody Reach Comparison
| Type | Average number of waterbody reaches per subbasin | Average area of waterbody reaches in km2 | Percent waterbody reaches named |
|---|---|---|---|
| 1:100K NHD | 100 | 0.222 | 23.45 |
| 1:24K NHD | 1,291 | 0.026 | 2.54 |
Five cases were selected to compare the number of linear reaches and length of reaches for specific named rivers. The results of this limited comparison were variable. More often, the number and length of reaches increased from the 1:100K NHD to the 1:24K NHD. This was not the case, however, for the Mississippi River or Teagle Wash reaches, which seemed to have the opposite trend. Table 3 compares 5 rivers in different subbasins.
Table 3. Comparison of the Number of Reaches and Lengths of Reaches for Rivers in the 1:100K NHD and the 1:24K NHD
| Subbasin/State | Name | 1:100K length in meters (# reaches) | 1:24K length in meters (# reaches) | Percent difference |
|---|---|---|---|---|
| 03130001/GA | Chattahoochee River | 392,735 (70) | 483,942 (129) | 19 |
| 01080105/VT | White River | 94,878 (46) | 96,749 (47) | 2 |
| 14040103/WY | Green River | 112,330 (64) | 112,709 (148) | <1 |
| 18090205/CA | Teagle Wash | 46,415 (23) | 42,035 (23) | -9 |
| 07010206/MN | Mississippi River | 130,126 (32) | 112,522 (25) | -14 |
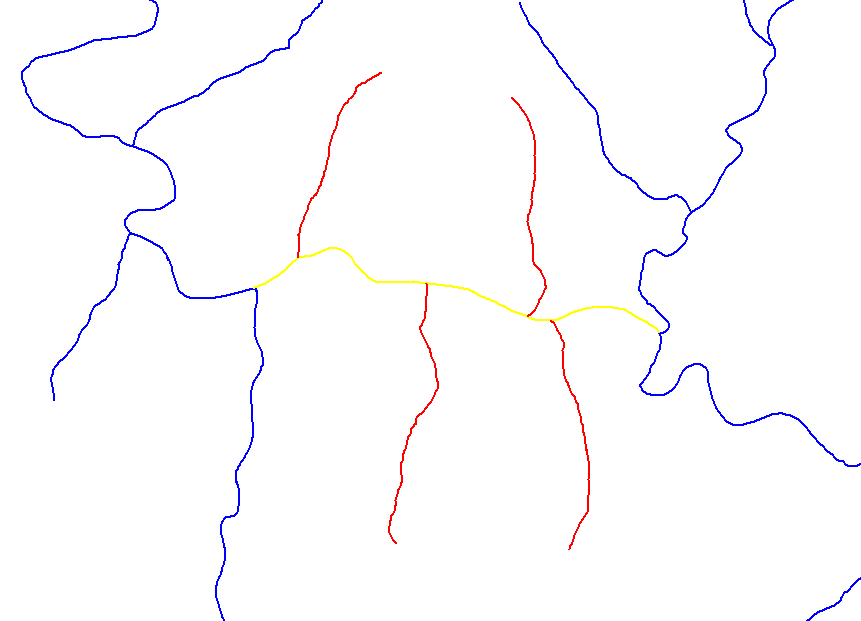
The NHD at the 1:24K scale contains much greater detail than the 1:100K NHD contains. This is seen in the number of reaches and the increased sinuosity of the 1:24K reaches. Typically, reaches found at the 1:24K scale were added to the NHD coverage without destroying the original 1:100K NHD measures. The original 1:100K reaches have measures of 0 to 100, with tributaries generally branching at 0 and/or 100. The 1:24K NHD has generally preserved the 1:100K reaches with this pattern, but has added additional reaches that do not necessarily branch at the measures 0 or 100, but branch instead at various measures along that reach. Figures 2 and 3 show an example of this found in KY subbasin 05130102 in the Upper Cumberland Basin.
Figure 2. Portion of the 1:100K NHD from KY subbasin 05130102. The yellow reach extends from measure 0 to measure 100.
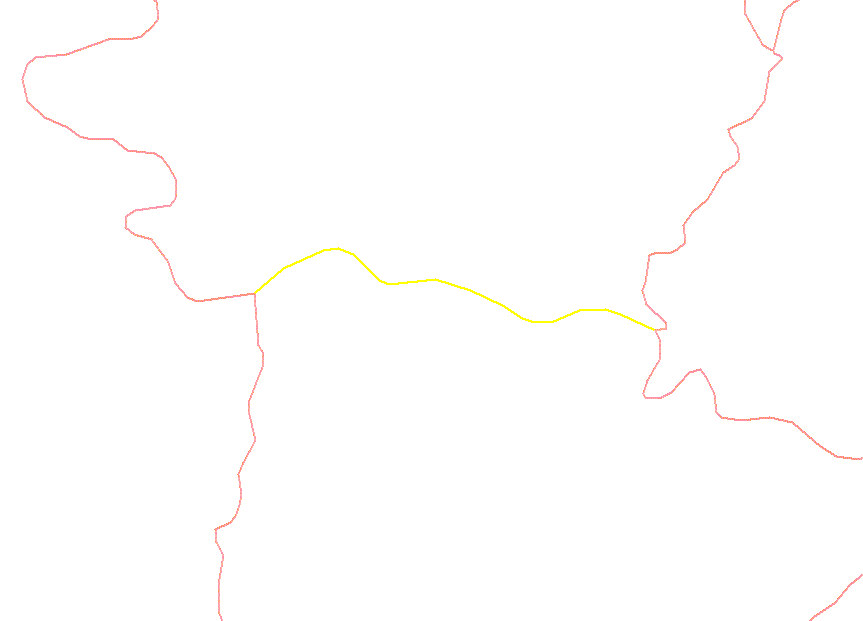
Figure 3. The original 1:100K NHD reach (yellow) retains the measures of 0 to 100 when it is migrated to the 1:24K NHD; however, additional reaches (red) now have confluences at various points along that reach.
Indexing 303(d) Waters to the 1:24K NHD
Indexing of 303(d) waters was performed for selected subbasins in WV, KY, and CA on the 1:24K NHD using RTI's NHD-RIT. The subbasins that were selected include 05020003 (WV), 05130102 (KY), and 18050003 (CA). Specific waters were selected from each of these subbasins and examined for length and surface area.
For all the rivers that were chosen, the total length of reaches making up a given river was longer when indexed to the 1:24K NHD than when indexed to the 1:100K NHD. The differences ranged from 1 to 27 percent; most were less than 5 percent. This is most likely due to the level of detail in the 1:24K NHD and the resulting change in sinuosity. Table 4 shows a comparison of 1:100K NHD and 1:24K NHD river lengths.
Table 4. Comparison of 303(d) Total Reach Length for the 1:100K NHD and the 1:24K NHD
| Subbasin/State | Name | Entity ID | 1:100K length in meters(# reaches) | 1:24K length in meters (# reaches) | Percent difference |
|---|---|---|---|---|---|
| 05130102/KY | Crooked Creek | KY21006801-02 | 7,860 (3) | 7,965 (3) | 1 |
| 05130102/KY | Brush Creek | KY21003577 | 8,676 (5) | 8,836 (5) | 2 |
| 05130102/KY | Wood Creek Lake | KY21030426 | 17,979 (1) | 24,572 (1) | 27 |
| 05020003/WV | Monongahela River | WV_M | 60,143 (20) | 60,935 (20) | 1 |
| 05020003/WV | Owl Creek | WV_M-10-D | 6,580 (3) | 6,815 (3) | 3 |
| 05020003/WV | Laurel Run | WV_M-8-H | 5,425 (4) | 5,643 (4) | 4 |
| 18050003/CA | Saratoga Creek | CAR2000000 Saratoga Creek | 28,806 (4) | 30,154(6) | 4 |
| 18050003/CA | Los Gatos Creek | CAR205.400Los Gatos Creek | 42,327 (14) | 45,170 (14) | 6 |
| 18050003/CA | Coyote Creek | CAR205.300 Coyote Creek (R) | 100,278 (38) | 113,565 (46) | 12 |
Waterbody reaches were compared, in area units of square kilometers, for the same subbasins as the linear reaches. In most cases, the waterbody reaches lost area when migrated to the 1:24K NHD from the 1:100K NHD. There was one exception: the waterbody reaches in the California subbasin gained area. These differences are probably due to the reshaping of the coastlines of waterbody reaches that is caused by moving to higher resolution NHD. Figure 4 shows the shape of a KY waterbody reach at both the 1:100K and 1:24K scales. Table 5 shows a comparison of waterbody reach sizes for various impaired waters.
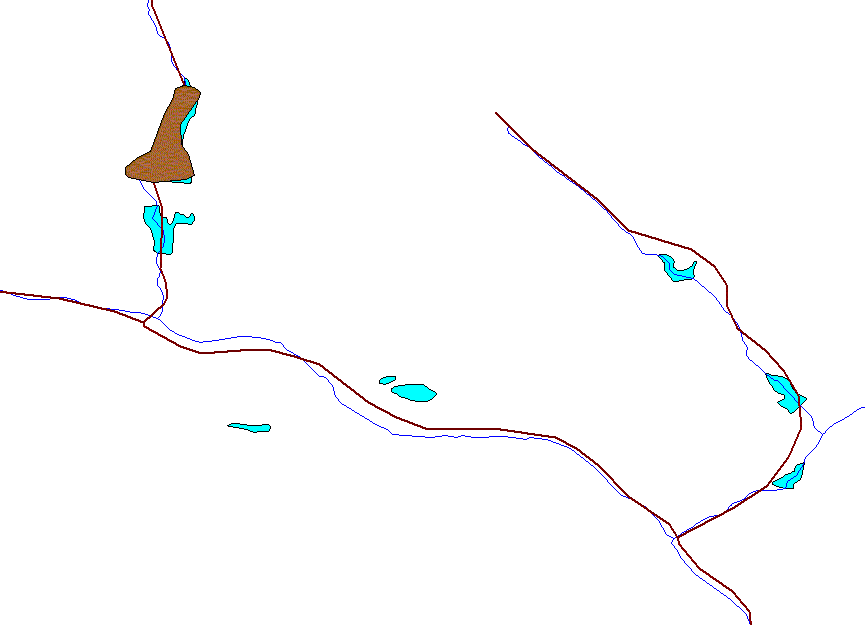
Figure 4. Shape comparison of a waterbody reach in KY in both 1:100K indexing (brown) and 1:24K indexing (green).
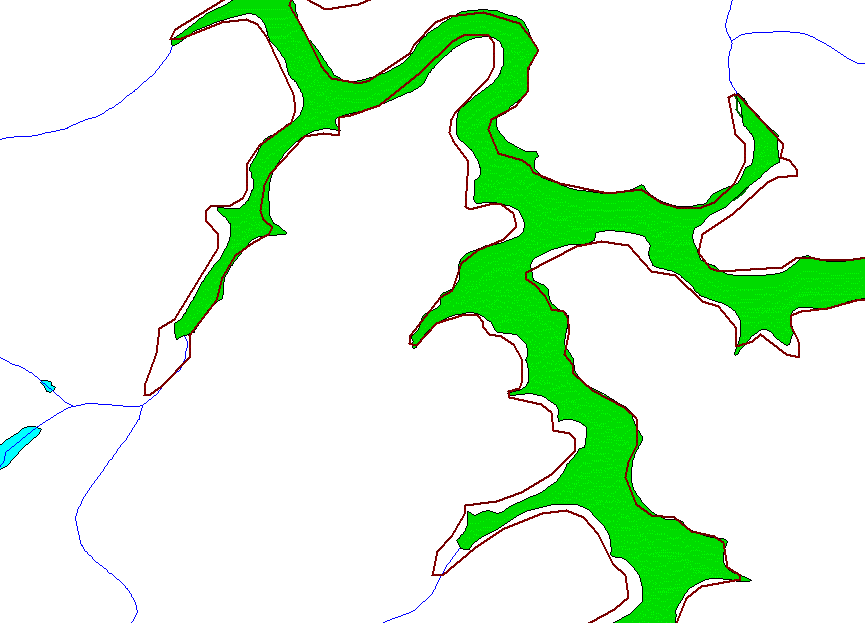
Table 5. Comparison of 303(d) Waterbody Reach Areas
| Subbasin/State | Name | Entity ID | 100K area in km2(# polygons) | 24K area in km2(# polygons) | Percent difference |
|---|---|---|---|---|---|
| 05130102/KY | Wood Creek Lake | KY21030426 | 2.985 (1) | 2.530 (1) | -15 |
| 05020003/WV | Deckers Creek Reservoirs | WV_M-8 | 0.132 (2) | 0.130 (4) | -2 |
| 05020003/WV | Laurel Run Reservoirs | WV_M-8-H | 0.095 (2) | 0.071 (2) | -25 |
| 18050003/CA | Los Gatos Creek Reservoirs | CAR205.400 Los Gatos Creek | 1.882 (3) | 1.972 (5) | 5 |
| 18050003/CA | Coyote Creek Reservoirs | CAR205.300 Coyote Creek (R) | 5.922 (4) | 6.704 (14) | 12 |
These differences in the shape and length of 303(d) waters will impact estimates of the total length or area of impaired waters. Totals will not only be different between the 1:100K NHD and the 1:24K NHD; until all states have the 1:24K NHD available, comparisons will be difficult and inaccurate.
Indexing 305(b) Waters to the 1:24K NHD
Reach indexing was completed for KY subbasin 05130102 and for WV subbasin 05020003 at both the 1:100K and 1:24K scales using RTI's NHD-RIT. In addition, a comparison of the number and total length of linear reaches indexed, as well as the number of waterbody reaches and total area of waterbody reaches, was performed for the KY subbasin 05130102. The results show that the number of linear and waterbody reaches increased in the migration from the 1:100K NHD to the 1:24K NHD. An increase in the length of linear reaches also occurred; however, the total area of the waterbody reaches showed a slight decrease in area. Table 6 compares the 1:24K NHD and the 1:100K NHD scale reach sizes and the number used to represent 305(b) waters.
Table 6. Comparison of 1:24K and 1:100K Scale Reaches Used to Represent 305(b) Waters in KY subbasin 05130102
| 1:100K NHD indexing | 1:24K NHD indexing | Change | Percent difference | |
|---|---|---|---|---|
| Total Reach Length | 332,790 m | 354,793 m | 22,003 m | 6 |
| Total Waterbody Area | 4.354 (km2) | 4.019 (km2) | -0.335 (km2) | 8 |
Indexing of 305(b) waters was also performed on WV subbasin 05020003. This work also showed a similar result in the addition of waterbody reaches that did not exist in the 1:100K NHD along linear reaches. For the small reservoirs and lakes that an assessed reach passes through, it is generally assumed that the lakes are included in the assessment. Figure 5 shows the original 1:100K scale indexing work superimposed on top of the 1:24K NHD. One can see that not only does more detail exist in the linear reaches, but a greater number of waterbody reaches are found along the indexed linear reaches. This will change the lake area for the total number of square kilometers of waterbodies assessed.
Figure 5. Original 1:100K 305(b) indexing (brown) overlain on 1:24K NHD (blue).
Indexing WQS-Designated Uses to the 1:24K NHD
WQS reach indexing was performed on the 1:100K NHD and the 1:24K NHD using RTI's NHD-RIT and automated process for indexing general and default use waters. The selected subbasins were WV 05020003, KY 05130102, KY 05130103, and NE 10220004.
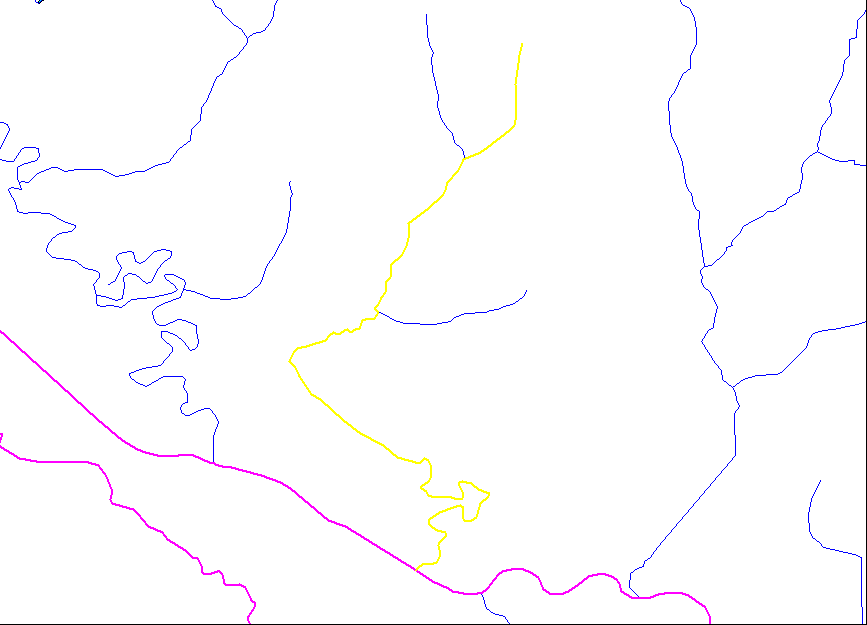
The NE example subbasin 10220004 was selected to demonstrate that the 1:24K NHD allows the user to locate waters that were not available in the 1:100K NHD. Point events are often used in 1:100K indexing to represent the confluence of a stream or lake that does not exist in the 1:100K NHD coverage. This allows the user to locate a waterbody and convey information about it when it is not part of a coverage because of scale issues. In the case shown in Figures 6 and 7, the point event could be deleted because the 1:24K NHD contained the necessary reach to properly index the river in question.
Figure 6. The original 1:100K WQS reach indexing (purple) is shown. The point event (red) marks the location of the confluence of a stream that should be indexed. NHD (blue) is shown at the 1:100K scale.
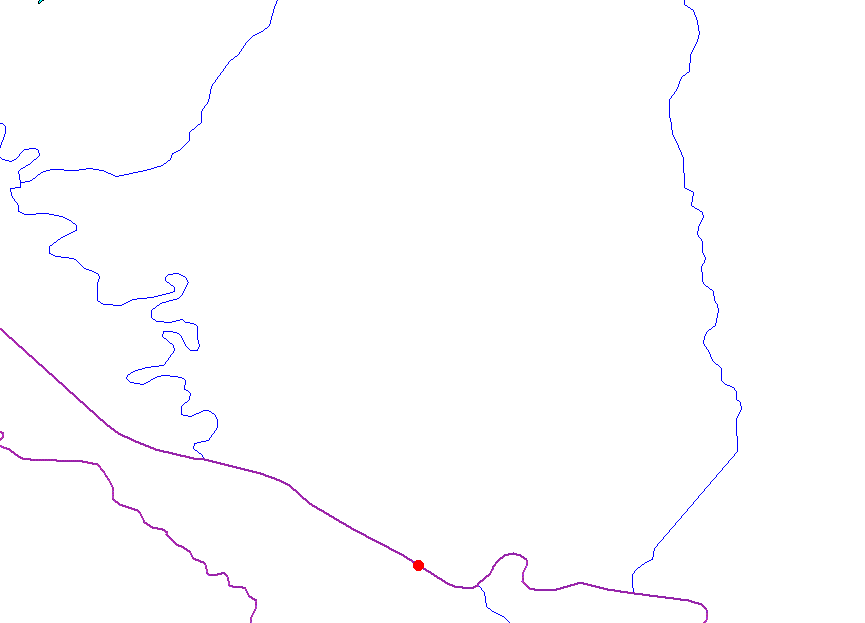
Figure 7. The point event was able to be deleted because the reach now exists in the 1:24K NHD (blue). The newly placed linear event is shown in yellow.
WV subbasin 05020003 was chosen to demonstrate the automated addition of waters that are classified as general or default use. General uses assigned to waters by default are defined by different states in various ways. West Virginia defines as general use all waters that are not otherwise designated. The designated uses of general use waters in WV are the propagation and maintenance of fish and other aquatic life and water contact recreation. Some states have general use provisions that define all waters of the state as having certain uses; other uses are specified for individual waters in addition to these default uses. Still other states have tributary rules, which coordinate the uses of tributaries with the waterbodies into which they flow. States' regulations are available in the WQS repository at http://www.epa.gov/ost/wqs.
Once the waters that have specified designated uses are manually indexed, an automated process that adds general uses can be run. This tool adds all un-indexed waters in that subbasin and gives them a general entity ID. This entity ID associates the waters with a general set of uses that applies to all waters of the state that are not otherwise designated. Since the 1:24K NHD is extremely detailed, this automated process can save significant time. Figure 8 shows the waters with specified uses, as well as the general use waters for WV subbasin 05020003.
Figure 8. Results of the automated process used to add general use, showing waters with specified uses (multicolor) and general use waters (green) indexed to the 1:24K NHD for WV CU 05020003.
Designated uses for KY subbasins 05130102 and 05140103 were indexed to the 1:100K NHD and the 1:24K NHD and analyzed for differences. Because KY classifies as waters of the state all waterbodies that are not otherwise specifically designated, there were large differences in the number of linear and waterbody reaches indexed between the two scales. The length and area of linear reaches and waterbody reaches, respectively, increased as well, simply because there were many more reaches in the 1:24K NHD. Table 7 compares the 1:24K and 1:100K scale WQS indexing for the KY subbasins 05130102 and 05140103. As with the WV example subbasin, these subbasins were indexed using RTI's automated process for adding general use.
Table 7. Comparison of WQS Reach Indexing for KY CUs 05130102 and 05140103 Based on the 1:24K NHD and the 1:100K NHD
| Water Quality Standards Comparison for Subbasin 05130102 | ||||
|---|---|---|---|---|
| 1:100K NHD indexing | 1:24K NHD indexing | Change | Percent difference | |
| Total Reach Length | 1,742,874 m | 2,871,371 m | 1,128,497 m | 39 |
| Total Waterbody Area | 4.527 (km2) | 9.724 (km2) | 5.197 (km2) | 53 | Water Quality Standards Comparison for Subbasin 05140103 |
| 1:100K NHD indexing | 1:24K NHD indexing | Change | Percent difference | |
| Total Reach Length | 3,268,677 m | 5,870,179 m | 2,601,502 m | 44 |
| Total Waterbody Area | 5.026 (km2) | 21.066 (km2) | 16.04 (km2) | 76 |
In Closing
As higher resolution NHD becomes available, states will be able to more accurately represent their 303(d) waters, 305(b) waters, and WQS-designated uses. Though these 1:24K coverages are much denser than the current 1:100K NHD coverages, tools such as the NHD-RIT and an automated process for the indexing of general use waters can be used to expedite the representation of these waters.
Acknowledgments
The work described in this paper was funded by the U.S. Environmental Protection Agency under Contract 68-C-01-001 with RTI. RTI gratefully acknowledges this support.
Disclaimer: Although the research described has been funded wholly or in part by the U.S. Environmental Protection Agency Contract 68-C-01-001 to RTI, it has not been subject to the Agency's review and therefore does not necessarily reflect the views of the Agency, and no official endorsement should be inferred. Mention of trade names or commercial products does not constitute endorsement or recommendation for use.
References
Dewald, T. 2001. Water Assessment and Tracking Environmental Results System (WATERS). In: Esri User Conference 2001, San Diego, CA, July 9-13.
Ilieve P.I., J.M. McCarthy, A.M. Miller, K.L. Sparks, W.S. Cooter, E.C. Barrett, and Jeffrey Bryan. 2000. Displaying Water Quality Standards Information Using Web-based GIS: A Foundation for Water Quality Management. In: WEF Watershed 2000, Vancouver, BC, July 8-12.
Ilieve P. I., A.M. Miller, W.H. Kramer, and Jeffry Bryan. 2001. Mapping of Water Quality Standards to the National Hydrography Dataset. In: Esri User Conference 2001, San Diego, CA, July 9-13.
Miller A.M., and P.I. Ilieve. 2000. Water Quality Standards GIS Review Implementation: Moving from a Static Website to a Web-based GIS. In: Esri User Conference 2000, San Diego, CA, June 26-30.
Spoerri, C., A.M. Miller, and T. Dabolt. 2000. The Reach Indexing Tool for the National Hydrography Dataset: Functionality and Impacts on State Water Programs. In: Esri User Conference 2000, San Diego, CA, June 26-30.
U.S. Geological Survey (USGS) and U.S. Environmental Protection Agency (U.S. EPA). February 2000. The National Hydrography Dataset: Concepts and Content. Available at: http://nhd.usgs.gov/chapter1/index.html.
Author Information
Paul Andrews
Environmental Scientist
RTI
P. O. Box 12194
Research Triangle Park, NC 27709-2194
Phone: (919)316-3718
Fax: (919)541-7155
andrewsp@rti.org (To whom inquiries should be directed)
Peter I. Ilieve
Research Environmental Engineer
RTI
P. O. Box 12194
Research Triangle Park, NC 27709-2194
Phone: (919)316-3727
Fax: (919)541-7155
pii@rti.org
Kenneth R. Gilland
Research Geologist
RTI
P. O. Box 12194
Research Triangle Park, NC 27709-2194
Phone: (919)485-2601
Fax: (919)541-7155
krg@rti.org
William S. Cooter, Ph.D.
Research Environmental Scientist
RTI
P. O. Box 12194
Research Triangle Park, NC 27709-2194
Phone: (919)316-3728
Fax: (919)541-7155
sid@rti.org
Bill Kramer
Manager, Water Quality Standards Data Base
U.S. EPA Office of Science and Technology
EPA West
1200 Pennsylvania Ave. NW
Room 5233T
Mail Code 4305T
Washington DC 20460
Phone: (202)566-0385
Fax: (202)566-0409
Kramer.Bill@epamail.epa.gov
Thomas Dewald
EPA NHD Manager
U.S. EPA Office of Water
1200 Pennsylvania Ave NW (4503T)
Washington, DC 20460
Phone: (202)566-1178
Fax: (202)566-1437
Dewald.Tommy@epamail.epa.gov