GIS For Valuation Modeling
Callista J. Broome
GIS Programmer/Analyst; ITD Department
and
Susan G. Sterrett
Mass Appraisal Analyst; Assessor's Office
Jefferson County
Golden, Colorado
Needs Assessment
The process of integrating Geographic Information Systems (GIS) into the re-appraisal/protest process in Jefferson County began back in the early part of the 1990's. Assessor's Office staff was exposed to GIS technology through conferences, contact with other governmental agencies, and the Jefferson County Mapping Department that was already implementing GIS during this time frame. In August 1994, assessor personnel visited neighboring Boulder County to see what GIS database and application development had been accomplished. A demonstration using Environmental Systems Research Institute (Esri) Arc/Info and ArcView software to display graphical and tabular parcel information sufficiently impressed the staff into thinking how the Assessor's Office might use GIS technology.
Traditionally, the Assessor's Office has looked at assessment information in tabular format stored on an IBM AS400 computer system with an interface developed by the county Management Information Systems (MIS) Department. In order to properly estimate property assessment, each of the 35 appraisers on staff had to query 20 to 30 separate tables and view them on an IBM dumb terminal stationed at their desks. Affectionately named the "Green Screen" query process, each appraiser would eventually complete their re-appraisal property assessments by viewing different screens of information, in addition to reviewing tons of green bar printouts. However the process had been cumbersome and had not allowed the staff to easily see the spatial relationship to adjacent properties or within neighborhood areas. The staff's exposure to GIS technology opened the door to changing the way property re-appraisal information could be viewed.
During the latter part of 1994 and the beginning of 1995 the Assessor's Office began to work with the Mapping Department. The objective was to come up with the hardware/software/data requirements that the Assessor's Office would need to begin the process of conversion from traditional computer operations to the type that would allow the implementation of GIS technology. Each department recognized that the first process to be completed was the conversion of the Assessor's Office mylar maps, depicting platting and legal conveyance, into digital format. Coincidentally, US West Communications had approached county entities within the State of Colorado with a proposal to obtain free hard copy parcel maps from each county. The maps would be scanned and vectorized by a subcontractor and each county would receive free GIS digital files of the information in exchange. After months of negotiations, US West delivered over 1,000 hard copy maps to Baymont Technologies (Clearwater, Florida) for scanning, vectorization, and/or digitization. Implementation of GIS in the Assessor's Office was now underway.
In the spring of 1995, the Mapping Department was re-organized into the Geographic Information Systems Department and and a subsequent leadership change brought fresh ideas to the table. Based on recommendations given from the GIS Department, the Assessor's Office bought workstations, desktop computers and GIS software that would allow the staff to view, edit, query, and analyze parcel assessment information using GIS technology. All that was needed now was the data and the ability of the staff to view that data from their desktops.
Delivery of the digital parcel information from Baymont began arriving in November 1995 and continued into 1996. By March, virtually all the information had been delivered. The GIS department implemented the Parcel Project. The data received from Baymont Technologies contained numerous digital files for any given area broken out by theme. For example, a given line in an area might represent a parcel line, a subdivision boundary, and a road right-of-way (R-O-W). In such a case, each of the individual themes parcel, subdivision, and road R-O-W would contain the same piece of geometry.
GIS developed a set of Arc/Info Arc Macro Language (AML)-based programs to perform the intensive geo-processing required to generate composite data sets for an area consisting of all unique geometry where all line segments were attributed by theme as defined by Baymont Technologies. Random checks of this geo-processing showed approximately 99.8% of the attribution as received from Baymont was preserved in the composite generated by GIS. Unfortunately up to 25% of the initial line work was not layered correctly, necessitating edit work by the Assessor's Office Mapping staff. The Parcel Project is on-going to this day.
At the same time, development of a GIS application that would utilize the parcel database and other GIS data had been thought about and tossed around. Originating from other sources and meetings that the Assessor's Office staff had attended, lists emerged that would get the actual application off the ground.
A development team within the Assessor's Office came up with a list of ideas that they felt could be put into practice using GIS technology. Among these were:
- Ability to separate neighborhoods
- By classification (i.e., retail, office, etc.)
- By income
- Ability to tie all of the Assessor's tabular data to any given GIS parcel yet control where the data goes so the public does not receive access to the complete database.
- Sales Tracking
- Land sales
- Land sizes
- Location of sales to subject property
- Taxing Districts
- Show neighborhood maps
- Show influences
- Flood plains
- Contamination sites
- Demographics (i.e., areas of growth)
- Zoning
- Traffic Counts
Interaction within the Assessor's Office staff continued, evolving into additional uses of GIS. Other GIS data layers that would be needed in the development of the application were added. The wish list that was developed contained the following:
Uses
- Display sales
- Show neighborhood boundaries
- Access demographic data, determine social forces on value
- Influence of zoning on property value
- Identify properties with obvious slope problems
- Determine the accuracy of the current data base
- Locate all traffic coded on system and see that others are coded properly
- Identify cul-de-sac properties for potential valuation
- Procedural review of many value contributing characteristics
- Identify rental income patterns for commercial property
- Determine vacancy rate for commercial property
- Identify contamination areas and properties within those areas (i.e., influence on value)
GIS Layers
- Census data
- Topography
- Flood plain
- Drainage
- Traffic
- Zoning
- Taxing districts
- Contamination areas
- Aerial photography
- Conservation areas
- Parcel data with all assessor data attached
Throughout 1995 the request for a GIS driven application continued and several more drafts of the user requirements were developed. Progress was slow, hampered somewhat by the re-organization of the Mapping Department into the GIS Department, the negotiation process between the Assessor's Office and the GIS Department to allow development of the digital parcel data set, and the amount of time taken to deliver that data set.
By 1996, the edit process on the digital parcel data had begun and actual GIS models were demonstrated to show how an application might look. Interaction between the Assessor's Office, the GIS Department, the MIS Department, and the Network Services Department went into high gear and development issues came to the forefront. Meetings between these departments were started to coordinate all the various elements that were needed to make the project successful. These meetings continue to occur on a monthly basis.
In the spring of 1997, the Director of GIS, the Deputy Assessor, and the Mass Appraisal Analyst began the development of a GIS Application that would fulfill the majority of the requests the Assessor's Office staff had been making over the past two years. A demonstration of ArcView software assured the Assessor's staff that what they were asking for could be accomplished.
A GIS programmer/analyst was assigned to the project in the summer of 1997. This slowed the application development so that the programmer could get acclimated to the project's complexity, resulting in numerous meetings between the Assessor's Office (the client) and the programmer. The application request list had grown by this point and priorities were becoming difficult to decipher. So a flowchart was developed to give all parties a better understanding of how the application data would be displayed and queried. The final flowchart was compiled in July 1997. It contains all user requests that were known at the time and assisted the programmer in generating program code.
A key aspect to the success of the project was the need for continual clarification of wants, needs and system capabilities between the client and programmer. The communication allowed the programmer to better understand the client's needs and to modify the application to their specifications. Communication is the key, even when it gets confusing! Part of that communication problem is the need for understanding two different languages - that of the appraisal geeks and the computer techno geeks. Their own terminology was so different, they didn't realize that they were saying the same thing. As a result, the programmer had to listen, program the perceived wish, and show the results. This will always be a vital part of making a program work to the satisfaction of the client.
On the technical side, the decision was made to develop the application in ArcView GIS using avenue scripts and Dialog Designer dialogs to customize the menus, buttons, and tools in the Graphical User Interface. The GIS layers used in the program had to have the flexibility to be displayed based on what the user wanted to see. The GIS data sets needed for the project were stored on an HP9000 server in a data warehouse, making access to them difficult from the client's desktop computer. Originally an in-house program called the Data Extraction Interface (DEI) was developed which allowed users to clip, zip and ship JeffCO GIS layers from the server to the user's desktop computer using a point and click interface developed in Microsoft Visual Basic. This portion of the application interface was subsequently replaced with an Informix database, Esri SDE v3.0.1.2, and more dialogs in 1999. The results were dramatic. The data was exchanged and displayed much faster to the client; 20 to 30 seconds compared to 2 or 3 minutes
The Program
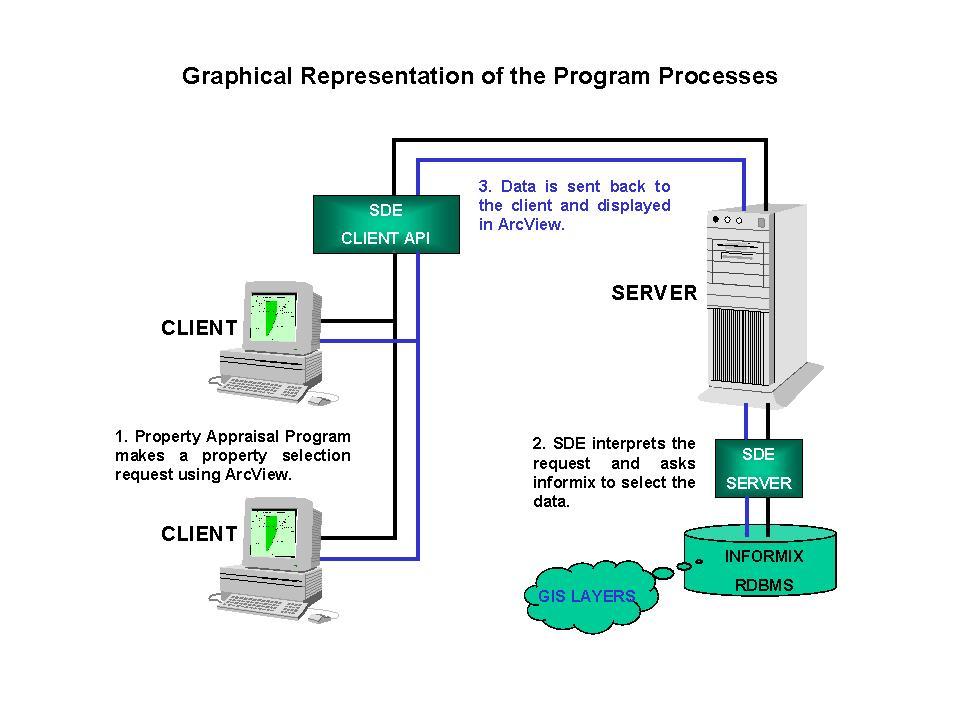
ArcView GIS 3.1 is used to query, display, and analyze the parcel data and several other SDE layers. Communication between the server and client's desktop computer is constant once the program has been activated with a connection to SDE. The ArcView interface the user sees was customized to the specifications made by the Assessor's staff and was named the Property Appraisal Program or PAP for short.

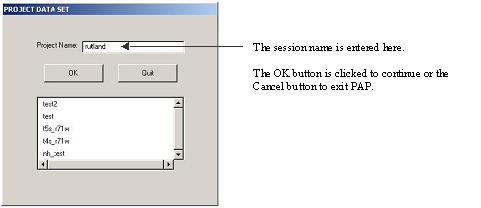
Step 1 - PAP opens and a dialog box will appear. The client must enter a current session name or overwrite a previous session name to continue the program. If the client chooses to overwrite a previous session, all files and data associated with that session are deleted. The name used also becomes a subdirectory on the client's computer into which the selected data will be stored.
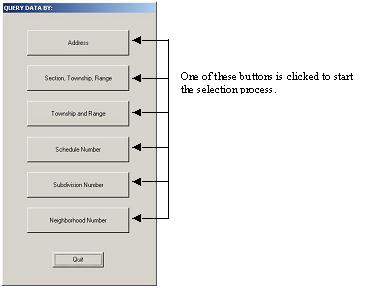
Step 2- The parcel data can be extracted from the SDE data warehouse by address, section-township-range, township and range, schedule number, subdivision number, or neighborhood number.
Step 3 - Next, information is entered based on the type of selection made in step 2 (i.e. Schedule Number).
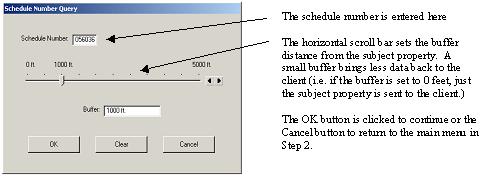
Step 4 - The parcel data is selected from the SDE/Informix server (data warehouse) by first performing a tabular query to find the parcel attached to the schedule number and then a spatial query is performed to select the parcels surrounding the schedule number selection. The number of parcels selected is based on the buffer distance entered on the dialog box. This selection is then exported to a shapefile and is stored the session's subdirectory on the client's computer. Other selections are made
Step 5 - The selected data sets are loaded into the PAP program. A dialog box opens informing the user the program is ready to use.
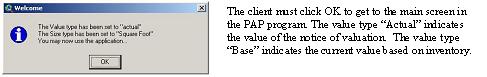
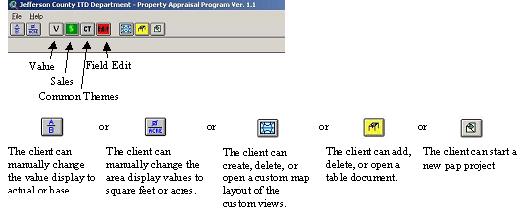
Step 6 - Four options for Appraisal information display as buttons on the main screen (i.e. Values, Sales, Common Theme (inventory information), or Field Edit)
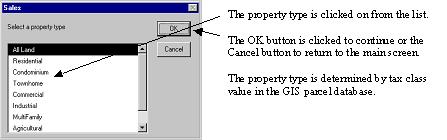
Step 7 - The client then selects the property type to be reviewed from the open dialog box. The choices are all or only one of the property types (residential, condominium, townhome, commercial, industrial, multifamily, agricultural, or other).
Step 8 - Based on the options selected in Steps 7 and 8, an ArcView window (view document) opens, displaying both the graphic image (display area) and a table of contents. The table of contents lists both the default themes (road names, roads, property types, and selected parcel) for all view documents and the customized themes for the requested view. To see the customized themes, the box to the left of the theme title must be checked. Customized color-coded legends will then show in the display area. Depending upon the property type selected, building design types, land characteristics, or exempt land can be viewed by using the button bar. An 8.5" x 11" hard copy map can be produced by clicking on the print button in the button bar.
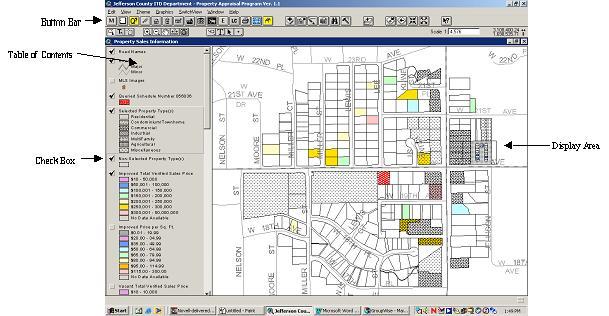
In addition, if the field edit option was selected in Step 7, the client has the ability to change the values for items in the parcel database in the GIS data warehouse directly from PAP. This feature is unique to the program because adjacent parcels can be selected and updated concurrently.
Summary
PAP is an additional dynamic tool that the Assessor's Office can use to value and defend property values. The appraisers now have the ability to easily select a subject and, in a relatively short time frame, obtain a geographic image combined with the appraisal database to do quality checks of property characteristics, neighborhood boundary establishment, review comparable sales for valuation support, in addition to updating the database enmasse. Time that was previously spent cutting, pasting, and color coding maps is now reduced to creating a query and printing the results. In essence, a major hindrance of the time it took to get the data will be gone.
Many pieces had to be considered for this project to be successful. Coordination between the Assessor's Office, GIS, MIS, and Network Services was essential to keeping lines of communication open. The Assessor's Office had to make sure their needs were communicated effectively. The GIS department had to create an application that would bring elements together in a manner never seen before in the Assessor's Office. Information had to be effectively and efficiently transferred between two totally different types of data. This meant that the GIS and MIS departments had to coordinate the maintenance and update of the tabular data to the spatial data. The GIS and Network Services departments had to coordinate the hardware and software issues involved in updating the personal computers used by the appraisers as well as ensure that the systems necessary for the transfer and storage of data met the needs of the application.
It has taken over five years for this project to become a viable working tool, and as changes in the technological industry continue, PAP will undoubtedly experience more changes. Revisions to come include an upgrade in software from ArcView GIS v3.1 to ArcView GIS v3.3 and SDE v3.0.2 to ArcSDE v8.2, allow the user to query the parcel data by tax authority number or tax district number with subsequent display parameters, and include more detailed analysis of parcel sales information once the data is available to the client.
This application is an important part to the reappraisal process and will be used for some time to come.
Epologue
The trend to integrate GIS into mainstream Information Technologies has occurred in Jefferson County. In mid 2000, what once was the GIS Department and the MIS Department was restructured into one organization named the Information Technologies Development Department and the Network Services Department became the Information Technologies Operations Department. The two departments work in tandum to produce quality I.T. products for Jefferson County Government. The recognition that GIS is more mainstream has been gratifying on the one hand, however the emphasis to generate new and exciting GIS applications has been minimized. The fine line between creativity and general Information Technologies must be carefully watched and cared for otherwise the unique qualities GIS brings to the table could get lost in the shuffle.