Schools across the United States and elsewhere are being challenged to meet high academic standards. These demands can make it harder for schools to pursue innovative curriculum enhancements such as GIS-supported inquiry. Too often, the argument is made that such projects are interesting, but that there simply isnĺt enough time available. In this review of Mapping the Environment projects supported by the Missouri Botanical Garden, learn how GIS can be seen as the solution to meeting educational standards in science and mathematics, geography, and technology, and not an obstacle in a crowded educational agenda.
Since 1998, the Education Division of the Missouri Botanical Garden has supported teachers and students in their efforts to engage in authentic science inquiry through the use of GIS and related technologies. This work has included a range of short and longer-term professional development workshops, programs for students, and curriculum development projects. Mapping the Environment has emerged as a means to make GIS more accessible and relevant to students and teachers than would be possible using traditional software manuals and isolated activities. As a result, the power of GIS has enabled participating classes to better meet the challenges of implementing a standards-based curricula.
In our early work, a group of seven teachers participated in a two week professional development workshop focusing on mapping and assessing water quality in a local watershed. This Deer Creek Watershed Project proved to be successful in engaging teachers and their students in monitoring of several local watersheds in addition to Deer Creek, but application of the GIS technology proved to be relatively limited. Teachers in the workshop used the standard ArcView software manual as a skill builder, and they applied their formative GIS knowledge using data sets prepared by the Mapping the Environment program staff.
Back in the classroom, these teachers found it difficult to translate the knowledge and skills gained in the summer workshop into readily usable practice in their schools. While there were some successes, teachers had a number of difficulties to overcome, including remembering the ôbasicsö of ArcView, locating and using appropriate data sets, and conveying their still nascent knowledge of GIS into lessons usable by their middle school-aged students. Given these challenges, providing support for these teachersĺ efforts required that the program director spend a great deal of time in schools working directly with the teachers and their students.
While this provided the Garden with an opportunity to learn first-hand from students and teachers as they worked to integrate GIS into their curriculum, it was apparent early on that the program staff would not be able to support a large number of teachers with such a labor-intensive model.
To address these limitations, two major changes were made beginning in the second year of the program: (1) a modified professional development schedule was implemented, and (2) curriculum modules were developed to support teacher learning and to provide materials that would be directly applicable for teachers implementing GIS in their science curriculum.
The teacher workshop model was modified to consist of nine days of professional development, starting with a five day workshop in the summer to be followed by two 2-day workshops held in the fall and spring of the school year. By spacing the professional development over an eight month period, teachers were better able to assimilate what they had learned and develop new skills incrementally. Thus, while the total number of contact hours in the professional development program was less in the second and third years of the program, teachers exhibited a much higher level of confidence in their GIS skills than did the first group. Subsequent contact with teachers in the first cadre of teachers confirmed teachersĺ preference for this staggered model of professional development.
Further refinement of the professional development model occurred after the second year of the program. Beginning in year 3, more substantial blocks of time were built into the schedule for guided practice of basic GIS skills. Most often, this occurred through challenges posed to the teachers which required application of the skills practiced earlier in the workshop. This additional opportunity to consolidate skills was well received by the participants as a means of gaining confidence they would need to implement GIS-enhanced inquiry in the classroom.
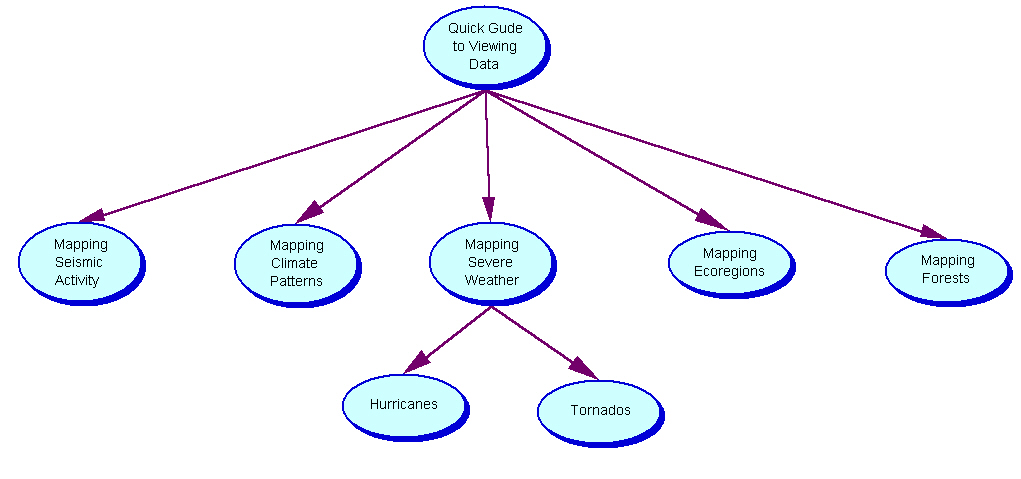
Working in conjunction with the modified professional development model, a series of curriculum modules were developed. In response to feedback from teachers indicating a need for strong basic GIS skill development and a focus on relevant science content, the Mapping the Environment curriculum modules were created. The curriculum series begins with a Quick Guide to Viewing Data,intended to provide basic GIS skills in no more than two 45 minute class periods. This introductory module is then followed by a series of content-specific modules that apply and extend the basic skills developed in the Quick Guide. To date, five modules have been extensively field-tested and published by the Missouri Botanical Garden. Two additional modules are currently under development and will be field-tested in the 2002-2003 school year: Mapping Ecoregions and Mapping Forests.
Individual modules consist of a series of 5-6 inquiries, each of which is focused by a guiding question. The Quick Guide to Viewing Data is recommended as an introduction to ArcView, as it focuses on the core skills needed to have basic facility with the software:
1) How do I get started with the program?
2) How do I add information to my map?
3) How can I get a closer view?
4) How can I plot new data on my map?
5) How can I change the colors on my map?
Content-specific modules apply these basic skills as students are led through a range of GIS-enhanced investigations. (Each module also contains additional challenges to promote extended inquiry.) For example, Mapping Seismic Activity leads students to investigate the following increasingly complex concepts:
1) Where are earthquakes located?
2) How can I map the magnitude of the earthquakes?
3) Why are earthquakes located where they are?
4) What really happens at these plate boundaries?
5) What do volcanoes have to do with plate tectonics?
These modules are intended to provide the means through which teachers and students can engage in investigations using authentic data, and in the process develop the skills, attitudes, and knowledge contained in curriculum standards for science, mathematics, geography, and technology.
Science: While the specific science content varies by module, each promotes a core of inquiry skills advocated in the National Science Education Standards (1995) and supplementary documents. In Inquiry and the National Science Education Standards, the National Research Council (2000) recommends that students in grades 5-8 be able to:
1) Identify questions that can be answered through scientific investigations
2) Design and conduct a scientific investigation
3) Use appropriate tools and techniques to gather, analyze, and interpret data
4) Develop descriptions, explanations, predictions, and models using evidence
5) Think critically and logically to make the relationships between evidence and explanations
6) Recognize and analyze alternative explanations and predictions
7) Communicate scientific procedures and explanations
8) Use mathematics in all aspects of scientific inquiry
Mapping the Environment investigations are designed to engage students in these processes as they investigate questions posed in the modules and frame original questions, searching for patterns in the data which they can cite as evidence in support of their explanation of a given phenomena, whether it involve a study of seasonal or regional variations in climate patterns, analysis of seismic activity, or any other aspect of earth and environmental science.
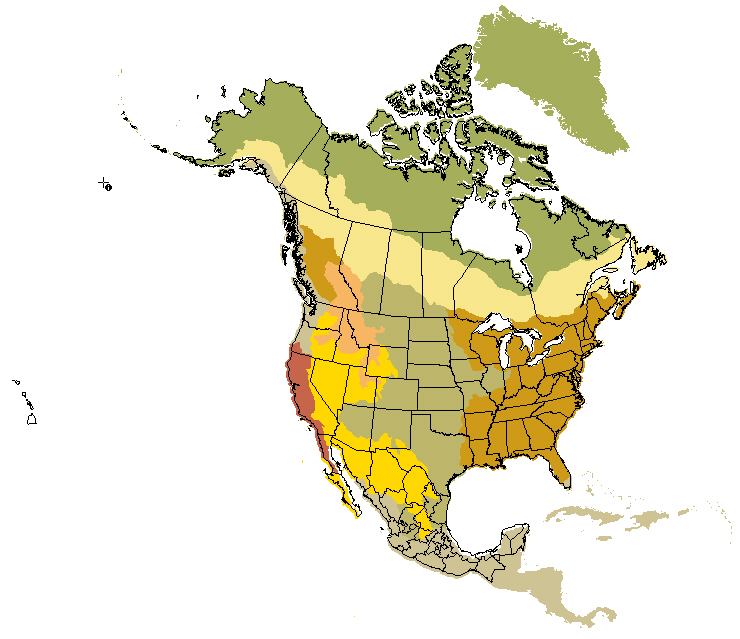
For example, in the forthcoming Mapping Ecoregions curriculum module, students will be able to deepen their knowledge of basic earth science concepts involving precipitation, temperature, and landforms as they analyze and describe variations in these phenomena. This understanding is then extended as students investigate how temperature, precipitation, and landforms affect the types of plants and animals that can be found in an area. This added dimension brings in significant life science concepts such as the relationship between form and function, adaptation, and evolution.
In each of the investigations, studentsĺ factual knowledge comes alive as it is used as part of a substantive problem-solving endeavor. More broadly, studentsĺ ability to see the world through scientific eyes is enhanced as connections are made between what may otherwise be seen as discrete science units (earth science, life science, etc.) and students see how living and non-living parts of the world interact to form distinctive biomes or ecoregions:
Math: Similarly, mathematical thinking is enhanced as students work in a data-rich environment. In addition to helping to meet many of the content standards in the Principles and Standards for School Mathematics (NCTM, 2000) including measurement, data analysis and probability, reasoning and proof, communication, connections, and representation, students have opportunities to develop their skills in thinking mathematically. This experience has long-term benefits in studentsĺ academic development. As noted in the Standards (p. 15), ôMathematical thinking and reasoning skills, including making conjectures and developing sound deductive arguments, are important because they serve as the basis for developing new insights and promoting further study.ö Students who have regular opportunities to think mathematically are far less likely to have the all too common view of mathematics as limited to arithmetic operations.
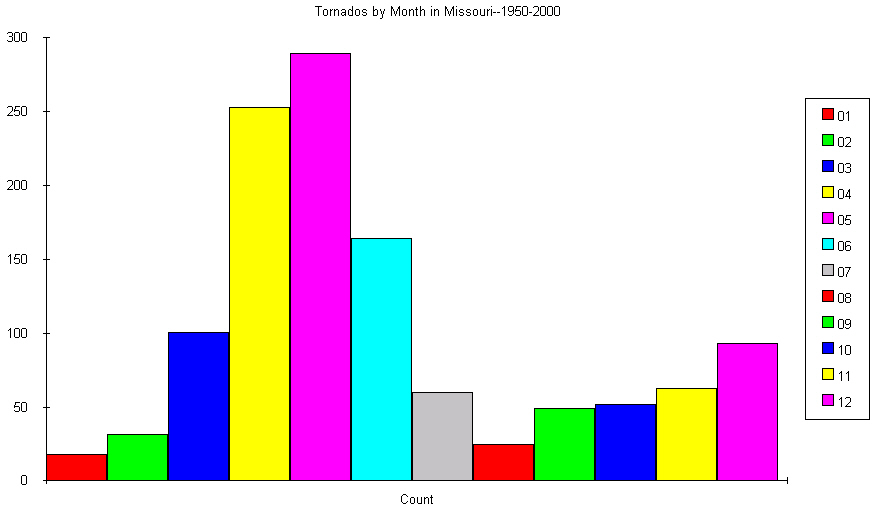
In Mapping the Environment investigations, students are challenged to apply a much wider range of mathematical skills. For example, in the Mapping Seismic Activity module, students map the gradation of earthquake depths in a region to observe subduction zones (where one plate submerges under another). In the tornado section of Mapping Severe Weather, students graph monthly patterns in how frequently tornados strike in their region, enabling them to link this data with the understanding they are developing in their science class about what conditions cause tornados to form. By combining this background knowledge with thoughtful analysis of the data, they are able to achieve a deeper understanding of how tornado formation is influenced by specific weather patterns most commonly found in certain parts of the country at specific times of the year. Without this use of data, the textbook descriptions of how tornados form are much less likely to take root in studentsĺ growing conceptual understandings. As is true for studentsĺ development of science skills, these investigations provide opportunities to experience the power of mathematics in helping to understand the worldŚhardly an inconsequential lesson.
Geography: In 1994, the National Council for Geographic Education issued Geography For Life, a set of academic standards defining the field of geography as a much more dynamic discipline than the standard ôstates and capitalsö approach found in many schools. These standards present a challenging vision of what it means to be geographically literate. Fortunately, GIS can be employed as a powerful tool to be used in achieving this vision.
Geography For Life consists of 18 standards, broken into 6 sections. GIS enhanced inquiry such as that found in Mapping the Environment modules can be employed to meet these standards, further enhancing the academic value of the investigations past the benefits in science and math education described above. As students engage in GIS-enhanced inquiry, they develop their understanding of:
1) The world in spatial terms
2) Places and regions
3) Physical systems
4) Human systems
5) Environment and society
6) Uses of geography
Technology: While use of computer technology is generally not seen as an academic discipline per se, many schools hold teachers accountable for studentsĺ developing skills seen as necessary for success in an increasingly information-rich environment. Consequently, projects such as the National Educational Technology Standards (ISTE, 1998) promote a vision of what students need to be capable of in order to be considered technologically literate. Among these standards, students are expected to:
1) Use technology tools to enhance learning, increase productivity, and promote creativity.
2) Use productivity tools to collaborate in constructing technology-enhanced models, prepare publications, and produce other creative works.
3) Use a variety of media and formats to communicate information and ideas effectively to multiple audiences.
4) Use technology to locate, evaluate, and collect information from a variety of sources.
5) Use technology tools to process data and report results.
6) Use technology resources for solving problems and making informed decisions.
7) Employ technology in the development of strategies for solving problems in the real world.
By meeting these technology standards, teachers and their students are also better able to meet the major content standards, enhancing the academic value of using GIS. Too often, technology use in schools becomes an end in itself. Mapping the Environment is designed to make GIS accessible to schools as a means of meeting academic standards. The technology is simply one of several means to that end. Thoughtful class discussions, field work, and background research also need to be included to achieve a balanced program.
As a guide to knowing when the use of GIS and related technologies is appropriate in the overall curriculum plan, the concept of ôstudent-empowering technology useö advanced by Means, Penuel, and Padilla (2001) is useful. In their view, student empowering technology use:
1) Emulates the ways in which professionals use the technology
2) Involves complex tasks
3) Requires significant amounts of time for completion
4) Gives students latitude in designing their own projects and in determining when and how to use technology
5) Involves multiple academic disciplines
6) Provides opportunities for student collaboration with peers and outside experts
Clearly, a significant GIS-enhanced investigation meets most if not all of these criteria. More broadly, for those engaging in substantive, standards-based investigations that are rich in spatial data, GIS is the tool of choice. Attempting to conduct a similarly complex investigation without such a powerful data analysis and representation tool would severely limit the projectĺs effectiveness. Thus, the need to make it accessible for use in regular classroom situations. Mapping the Environment is one contribution to that effort.
ISTE (1998). National Educational Technology Standards for StudentsŚConnecting Curriculum and Technology
.Eugene, OR: International Society for Technology in Education.
National Research Council (1995). National Science Education Standards. Washington, DC: National Academy Press.
National Research Council (2000). Inquiry and the National Science Education Standards. Washington, DC: National Aacdemy Press.
NCGE (1994). Geography For Life.
Currently out of print; major text of the standards is available at www.ncge.org.
NCTM (2000). Principles and Standards for School Mathematics. Reston, VA: National Council of Teachers of Mathematics.
Means,B, Penuel,W.R. and Padilla,C. (2001). The Connected School: Technology and Learning in High School. San Francisco: Jossey Bass.