|
Abstract
Geographic Information System (GIS) technology is quickly
becoming a critical component to develop and sustain asset management
for today's water utilities. Used as a spatial database, GIS can greatly
assist in various modeling applications through the development of automated
tools for constructing and maintaining reliable hydraulic network models
of water distribution systems. This paper presents a comprehensive GIS-based
decision support system, called H2OMAP Utility Suite, for use
in the effective planning and management of water distribution systems.
It links an advanced hydraulic network simulator with geospatial technology
and optimization theory to address every facet of network modeling and
asset management. Built with Esri MapObjects technology, the resulting
software will effortlessly read GIS data, extract necessary modeling information,
and automatically construct, skeletonize, load, calibrate, secure and
optimize a representative network model. It also makes it easy to run
and simulate various modeling conditions, identify optimal monitoring
stations, locate system deficiencies, and determine the most cost-effective
improvements for optimum performance. The optimization model uses an efficient
variation of the genetic algorithm for solving network model calibration,
field sampling design, pump scheduling, and network design and rehabilitation
problems in an optimal fashion. The integrated approach offers a virtual
geospatial environment to assist water industry executives and professionals
in formulating, evaluating and prioritizing facility management and infrastructure
security strategies.
Introduction
Computer simulation models of water distribution systems
represent the most effective and viable means for evaluating system response
to various management strategies. To be effective, these models require
extensive spatial and hydraulic infrastructure data readily available
from GIS. This information system format is unique in its ability to capture
and store facility data and spatial reference for asset management and
eventual hydraulic network model integration. It provides functions for
development and preparation of pertinent spatial information for input
to network models as well as functions to facilitate graphical output
display for evaluating results. Added visualization tools can be applied
using spatial and aspatial queries of model results to help identify correlation
between input parameters and model results. Therefore, the integration
of water distribution network models with GIS is a natural development
of hydraulic simulation tools complemented with the evolution and maturation
of relational database technology.
While many powerful water distribution modeling software exist, few are
currently integrated with a GIS platform. Engineers familiar with the
(CAD) environment have grown increasingly dependent on the hydraulic software's
usability, interface, and CAD-like features. Likewise, enterprise GIS
software has not been tailored, both in terms of price and functionality,
to serve the requirements of water distribution planning and analysis.
As such, software for the analysis of water distribution systems was normally
created in the CAD environment to receive acceptance from an engineering
community already familiar with AutoCAD for other civil applications.
No such software however, has been developed to integrate the water distribution
modeler's needs with the data and spatial reference abilities of GIS.
This paper presents a new perspective to water distribution planning and
management. It is a unique network analysis platform that addresses the
requirements of the modeling engineer while providing the functionality
of a GIS for consistent facility asset management1-2. The graphical interface
is developed using Esri's MapObjects geospatial technology and provides
an informative structured framework for database management and complete
network model construction, analysis, and result presentation.
Water utility engineers are responsible for ensuring the safe and efficient
supply of drinking water. The role of a GIS in the analysis of a distribution
system is to provide up-to-date and accurate data to be used in the engineering
analysis. For years, engineers have exported data from GIS data sets to
third party software for analysis and design of water distribution systems.
Applications and functionalities such as energy and fire flow analysis
with the ability to model different demand and operating scenarios were
not fully recognized in GIS software. Therefore, leaving the GIS environment
was necessary to use this data with other advanced modeling and planning
tools. While efforts to date have proven successful in allowing very basic
engineering analysis from a GIS, engineers have been reluctant to embrace
and utilize this technology.
Part of the reason for this reluctance can be attributed to the way many
GIS software treat data elements. For example, a water distribution system
that serves 150,000 people may have a GIS that contains anywhere from
100,000 to 250,000 separate pipe segments. From an engineering perspective,
this many pipe segments are not feasible for an accurate and manageable
hydraulic model. Presuming that a GIS were able to successfully model
that many elements, engineers will not want the task of evaluating the
voluminous amount of data generated from such an extensive hydraulic simulation.
Another reason for the hesitation to use a GIS software for network analysis
lies in the difficult command structures of many GIS software packages.
Engineers familiar with CAD based solutions may not find a GIS network
modeling package as intuitive, and would thus resist a new format which
may not appear to bring much additional functionality. Still another reason
for this reluctance may be the speed of the analysis software. Engineers
are used to working with time and budget constraints that will not include
extra time to run a lengthy and time-consuming hydraulic simulation. One
final and extremely practical reason for not choosing a GIS-hydraulic
model package may be the cost of many GIS modeling solutions. Spending
upwards of $15,000 to create and run a model that is less robust and has
fewer features than a $6,000 solution may prove difficult to justify,
especially for most users who are tied to a fixed budget.
It is for these reasons that engineers have opted to export the necessary
data from a GIS into a third party software application designed specifically
for the engineering analysis of a water distribution system. Therefore,
the GIS exporting process has become an accepted task among engineers
and has raised some common issues among practicing modelers.
Duplication of Data
One potential problem with exporting data outside of
a GIS and into a third party software application for engineering analysis
is the fact that a duplication of data may be created. Once this occurs
it becomes very difficult to ensure integrity between the two data sets
in the future (one data set being from the GIS, the other being from the
hydraulic model). This occurs because engineering models take on a life
of their own outside of a GIS3. Engineers spend hours tailoring the model
to match existing field conditions. Pumps, pressure reducing valves, storage
reservoirs, wells, closed pipes, etc. are all addressed by the engineer
in the hydraulic modeling software that would otherwise be disregarded
by the GIS manager. The engineer also goes to great lengths to ensure
data integrity within the model for the purpose of running a hydraulic
simulation. Pressure zone boundaries are delineated, demand area polygons
are created and point loads are determined. All of these activities bring
about the modification and adjustment of existing facilities as well as
the creation of new facilities, further complicating the task of taking
modeling data back to the GIS.
Finding Errors
While duplication of data is a potential risk when
creating an engineering model from a GIS, a recognized advantage is finding
errors in GIS graphic and non-graphic data sets. When GIS mapping began,
the first step for a city/utility was to decide how to best go about creating
the data and which department would oversee and supervise this process.
Many cities had decided to outsource data creation and then assigned an
internal Information Systems (IS) division to review the contract scope
and continue data management upon project completion. Due to outsourcing,
many cities received facility data sets that were not thoroughly inspected
for data accuracy. The engineering and operations departments, not realizing
the future impact of these outsourcing contracts, were not included in
the data creation process. Because of the combination of outsourcing and
IS oversight (not being aware of data needed by the engineer), preliminary
data integrity of a hydraulic system which is built directly from the
GIS may be questionable. While many cities believe they possess a highly
accurate GIS, it is only until the engineering department, in collaboration
with the operations department, utilizes GIS data for the sake of creating
a water master plan that the GIS inaccuracies are discovered. It is at
the time of a model creation for a system-wide master plan that issues
regarding pipe diameters, materials, location, connectivity, etc. are
thoroughly reviewed and inspected. What many find is that the GIS data
set consists of errors that require further investigation and correction.
Many master plans are delayed while GIS data discrepancies are adjusted
to match field conditions.
While these errors may be addressed and resolved in the hydraulic model,
little is done to ensure that all corrections are taken back to the GIS.
In many instances, once a hydraulic model is created for a master plan,
the model becomes more accurate than the original GIS data used in its
creation. A solution to this problem can now be realized using an integrated
geospatial network modeling methodology.
A New Geospatial Solution
The proposed geospatial software, H2OMAP
Utility Suite, approaches water modeling from a GIS-centric point of view
for spatial database management and analysis and works to avoid the duplication
effort involved in the creation of a hydraulic network model. Built entirely
with Esri MapObjects technology, the software uses the Shapefile (an industry
standard GIS format) as its native data format. Therefore, as pipes and
nodes are created, these data elements are also stored externally to the
program as Shapefiles, ready to be viewed and edited by any third party
GIS application. This integrated approach introduces a completely new
perspective to the application of GIS standards with network modeling.
It is further developed to host in a unifying framework the variety of
processes required for constructing, calibrating, and optimizing water
distribution network models. The integrated system combines the ability
to accurately build network topology, prepare requisite data, conceive
and evaluate multiple scenarios, execute optimization runs, and provide
both hardcopy reporting and graphical output display for evaluating and
presenting results.
The ability to make maximum use of all available data, from any department
or source, allows the utility to manage their infrastructure systems more
effectively. Since each department in an organization can control its
own data while giving other departments easy access to its most current
and accurate information, data is shared rather than duplicated and thus,
saving time and money across the organization. The following example is
provided to demonstrate the system's ability to reduce user errors and
facilitate network model creation.
Sample Project
A city has decided to undertake a water system master
plan. Using the city GIS water coverage, the GIS department assigns a
unique value (or ID) to each water facility in the GIS. The data is then
saved as a Shapefile and imported into the software. The engineer then
works on the hydraulic model, assigning pump curves to pumps, settings
to control valves, etc. In the process, the engineer establishes connectivity
and assigns facilities to their appropriate pressure zone. The engineer
proceeds to work on the hydraulic model, rectifying problem areas during
model construction. Since the data is automatically stored as Shapefiles,
the GIS manager views the modeling data in a GIS program to update changes
made by the engineer. This GIS update occurs directly without an importing
process, which would otherwise disrupt the modeler's task of building
the hydraulic model. The GIS manager may also opt to replace existing
facilities data stored in the GIS with those from the hydraulic model,
as the model data is now more accurate and contain additional data values
not stored in the GIS.
Because data sets are stored as Shapefiles, anyone in the organization
can view the hydraulic model outside of the model. Pipes, valves, tanks,
etc. can be added as views to ArcView or as layers in AutoCAD or Microstation.
Pressure contours from a hydraulic analysis and annotation layers for
labeling the hydraulic network are also stored as Shapefiles and can be
viewed at any time in any software package that supports the Esri Shapefile
format. The functionality of the proposed software allows engineers to
analyze distribution systems and GIS departments to integrate model data
in a smooth and seamless fashion.
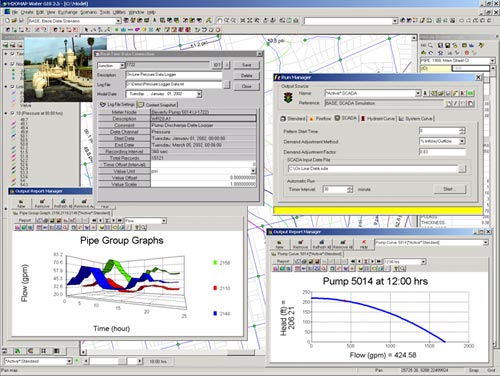
Advanced Functionality
The proposed integrated approach offers a full-featured
hydraulic analysis software solution for performing a wide range of essential
modeling tasks. Water utilities can use it for pump scheduling, developing
various planning scenarios, analyzing system flows and pressures, performing
water quality analyses, assessing fire flow capabilities, planning unidirectional
flushing programs, creating pressure contours, and monitoring SCADA operations.
The graphical interface is built with object-component technology to provide
a powerful and practical GIS platform for water utility solutions. As
a stand-alone program, it combines spatial analysis tools and mapping
functions with sophisticated and accurate network analysis capabilities.
GIS or CAD layers can be added to the program as background reference.
A small sample of files which can be directly imported include ArcInfo
coverages, Shapefiles, ArcSDE layers, Geodatabases, MIF/MID files, as
well as AutoCAD and Microstation drawings (DXF, DWG, and DGN).
The open-architecture framework allows fluent and flexible management
and distribution of geospatial data while facilitating the exchange of
critical modeling information with other applications and enterprise systems.
Immediate data storage and access in the Shapefile format puts the model
at the center of all enterprise solutions. Water utilities can develop
informed GIS solutions to help them increase engineering productivity,
exceed drinking water quality standards, optimize system operations and
capital improvement programs, and improve community and client relations.
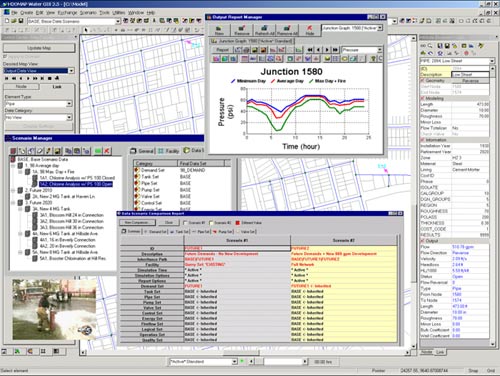
Multi-level Inheritance Scenario Management
A scenario manager allows modeling of multiple and
varied demand loading and operating conditions while benefiting from a
multi-leveled inheritance among planning scenarios. Every change made
to a "parent" scenario can be reflected through the entire set
of "child" scenarios for automatic acceptance of particular
data sets. With minimal effort, the hydraulic modeler can simulate skeletonized
systems, proposed facilities, and operational schemes to evaluate base
transmission pipe combinations, system behavior under varying demands,
and cost-saving operational procedures. Such capabilities allow the modeler
to alternate between scenarios, merge models of any size, and compare
results instantly to clearly illustrate optimal system performance under
any given network scenario and planning horizon.
Automated Network Model Reduction (Skeletonization)
Interfacing with GIS applications is a very reliable
and efficient method of developing hydraulic network models. However,
because GIS facilities are typically created for Automated Mapping/Facilities
Management (AM/FM) applications (e.g., water distribution system maintenance
and management), this format is generally not suitable for construction
of hydraulic network models. Common data format problems encountered by
practicing modelers who import to the network model are the inclusion
of hydrants, line valves, tees or crosses from the GIS.
A geospatial approach greatly simplifies and reduces large GIS models
to a manageable size ready for hydraulic analysis. It expeditiously processes
detailed GIS data, efficiently constructs reliable water system network
models using three automated data segmentation applications: data reduction
(Reduce), skeletonization (Skeletonize), and trimming (Trim) applications
(or RST applications), and re-allocate nodal demands.
Data reduction application is the ability to remove excessive pipe segmentation
caused by valves, fire hydrants or other data capture processes, by dissolving
interior nodes on pipe reaches and combining the associated pipe segments
into single pipes. For example, merging all series pipes of common diameter,
material, roughness coefficient and age. Data skeletonization application
refers to the capability of removing all pipes with diameters less than
a specified value (e.g., removing all 8 in and smaller pipes). The data
trimming application is the ability to remove short pipe segments leading
to dead ends such as service laterals and hydrant leads.
These network segmentation capabilities can be used effectively to screen
and accurately convert GIS data into a more practical and manageable hydraulic
model.
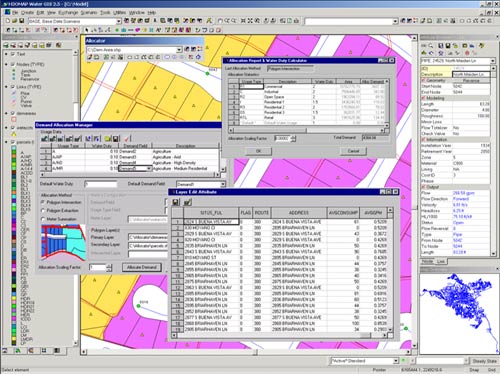
Demand Generation
Determining consumption and the spatial distribution
of consumption throughout the network model is a key element of modeling.
Network models are loaded with existing and future demands, depending
on the type of analysis performed. All sources, distribution pipelines
and available storage within the system are supporting elements that provide
service to meet these system demands. The variation of demand during the
course of a day must also be accounted for during an extended period simulation
(EPS). For static analyses, total system demand for various modeling conditions,
such as average day, maximum day, peak hour, etc., is spatially distributed
as a set of individual demand values allocated to selected junction nodes.
For extended time period (EPS) analyses (e.g., water quality), additional
temporal characteristics, typically represented by their respective diurnal
variations (hydrographs), are also required. Generally, the spatial demand
levels are first estimated for all junction nodes. The temporal effects
are then adjusted based on individual consumption categories.
Six accurate and fully automated methods can be used for processing geometric
polygons to accurately compute and load network models based on demand
type, location, and variation. These are:
1. Geocoded meter billing data (meter consumption database)
2. Shortest distance to junction
3. Shortest distance to pipe
4. Polygon Processing - spatial intersection of multiple polygon layers
5. Polygon Processing - spatial summation of consumption category area
polygons
6. Large users as individual point loads
The first method makes use of GIS layers to automatically geocode consumption.
The demand at each junction node is determined by identifying and summing
all the customers/meters within its associated service area polygon. In
the second method, each meter is assigned to the nearest junction while
the third method assigns each meter to the nearest pipe. In the fourth
method, demands are automatically calculated based upon a direct spatial
intersection between demand categorization polygons (e.g., land use polygons,
population polygons, pressure zone polygons, TAZ polygons, census tract
polygons, meter route polygons, and others) and the demand node area coverage
polygons (service area polygons). In the fifth method, nodal demands are
calculated by summing the individually assigned consumption category polygons.
In the last method, consumption levels for major users such as major industries,
schools, parks, golf courses, hospitals, etc. are identified directly
from their billing records and their demands are automatically assigned
as individual point loads at their respective junction nodes.
These comprehensive capabilities will allow water engineers to effectively
utilize their engineering knowledge and experience and leverage existing
GIS data investments to strategically define/forecast their network demand
distribution for various planning horizons in their master planning effort.
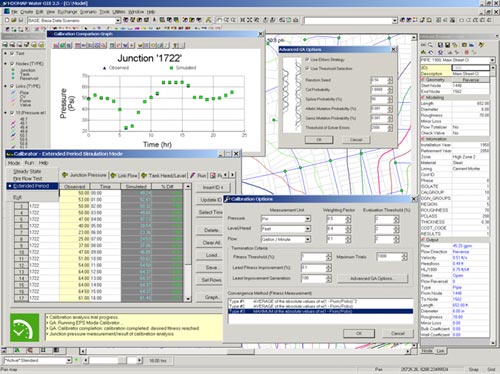
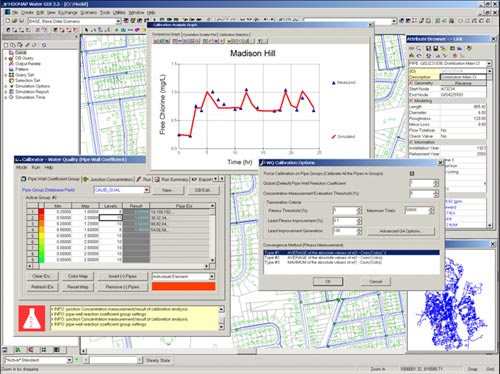
Automated Network Model Calibration
After a network model is properly constructed, it must
be calibrated to the physical system so that model predictions can be
interpreted with confidence5-6. Calibration entails adjusting certain
model parameters, usually the aggregate pipe roughness coefficients, until
the model results coincide with observed field conditions. The field conditions
most commonly used in network calibration correspond to the pressure readings
obtained from fire flow tests or from on-line SCADA systems. The price
for neglecting network calibration is basing decisions on a model that
may be seriously in error.
Typically, engineers will attempt to calibrate their network models using
a tedious and inexact trial-and-error process in which the model input
parameters (typically pipe roughness coefficients) are adjusted until
computed and field observations are within reasonable agreement. However,
since there is a vast number of possible combinations of parameter values
that need to be considered, the trial-and-error evaluation of all options
is unlikely to be practically feasible or manageable, and even knowledgeable
modelers often fail to obtain good results. As a result, network model
calibration has generally been neglected or done haphazardly.
In order to improve the reliability of hydraulic network models as well
as eliminate the need for trial-and-error calibration methods, the network
model calibration problem is cast as an optimization problem. It is then
solved using an improved variation of the Genetic Algorithm optimization
technology7-8 coupled with advanced elitist and global search control
strategies to significantly enhance accuracy and convergence. The calibration
model considers any combination of field pressure, tank level, flow and
water quality measurements, quickly determining pipe status and roughness
coefficient, pump and valve status, demand distribution and water quality
parameters to best reflect what is actually occurring in the system. It
offers comprehensive micro-level water distribution model calibration
capabilities - considering any time frame of calibration condition (e.g.,
maximum hour), an unlimited number of calibration scenarios (e.g., time-disjoint
fire flow test conditions), and complete extended period simulation calibrations
(e.g., on-line SCADA readings). Calibration results are then stored in
the database and accessed by the software's object-oriented interface
for graphical reporting and display.
Optimal Sampling Design
The credibility and efficacy of a calibrated network
model can only be as good as the data with which it was calibrated. While
field sampling programs are essential for model calibration, poorly defined
sampling designs may lead to calibrated roughness coefficients that are
not reasonable. Since only a limited number of measurements are normally
available due to resource constraints, the number and location of calibration
tests must be chosen to provide maximum information on the condition of
the system. If these locations are less than optimal, the data collected
may yield insufficient information for an accurate calibration and, thus,
would defeat the purpose of the calibration process.
Sampling design is currently performed by subjective judgement, thus depending
heavily on the experience of the modeler. In order to optimize the quality
of sampling designs for model calibration, the sampling design problem
is formulated as a dual-level combinatorial optimization problem and solved
using Genetic Algorithms. The dual-objective function is to determine
the minimum number of sampling locations (junction nodes) with pressures
that are collectively the most sensitive to changes in pipe roughness
values and also provide the most topological coverage of the network.
This ensures identifying the minimum set of junction nodes which stresses
the greatest percentage of the system and that are the most uniformly
spread so that pipe roughness values can be accurately inferred.
Considerable flexibility is allowed when screening sampling location results.
Because the optimization algorithm searches the solution space from a
population of points, and not just from a single point, alternative sampling
locations of the same quality, can be used and compared if additional
constraints are imposed, such as a location of an inaccessible or leaking
hydrant. The optimal sampling sites are then stored in the database and
conveyed back to the decision-support system interface for graphical query
and display.
Network Design and Rehabilitation
Cost-effective design and rehabilitation of water supply
and distribution systems is a problem of great importance in engineering
practice. Water utilities have been using network models to assist them
in planning their system rehabilitation and designing new systems. New
system design (or expansion to existing systems) is required to cope with
sustained growth while rehabilitation (or upgrading) of an existing system
is required to maintain adequate levels of service.
The network design and rehabilitation problem is cast as an optimization
problem and solved using Genetic Algorithms. It consists of determining
the optimal rehabilitation alternatives and pipe sizes for selected pipes
in the network that produce the minimum overall cost for a given set of
demand loading and operating conditions while satisfying the hydraulic
operational requirements of the system. The decision variables include
any selected combination of rehabilitation and design options such as
cleaning or cleaning and lining of existing pipes, pipe expansion, and/or
installing new pipes that can either parallel or replace existing pipes.
Cost data is specified for each option and for a range of pipe sizes.
This data will vary with pipe material and geographical location. System
operational constraints include minimum and maximum pressures at nodes,
and minimum and maximum velocity and hydraulic gradient requirements for
pipes. The results of an optimization run are then stored in the database
and can be displayed in both tabular and dynamic color graphic forms.
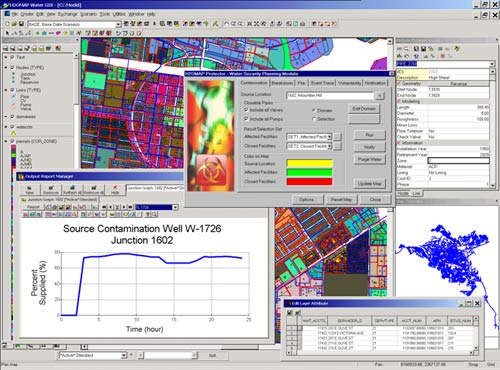
Water Security Planning and Vulnerability Assessment
Ensuring the provision of acceptable levels of reliability
in water distribution systems and reducing their vulnerability to natural
disasters and emergencies is a problem of great importance for water utilities
worldwide.
In order to improve the safety and security of drinking water distribution
systems, the software delivers an array of cutting edge water security
planning and vulnerability assessment tools. It allows water utilities
to model the propagation and concentration of naturally disseminated,
accidentally released, or intentionally introduced contaminants and chemical
constituents throughout water distribution systems; assess the effects
of water treatment on the contaminant; and evaluate the potential impact
of unforeseen facility breakdown (e.g., significant structural damage
and/or operational disruption). It enables users to locate all areas affected
by contamination; calculate population at risk and report customer notification
information; and identify the appropriate valves to close to isolate a
contamination event. Finally, it helps water utilities track contaminants
to the originating source; compute required purging water volume; develop
efficient flushing strategies; determine the resulting impact on fire-fighting
capabilities; and prepare data for eventual prosecution.
These capabilities will greatly assist water utilities in reducing their
infrastructure vulnerability and enhancing their ability to prepare for
and respond to natural disasters and emergencies. The software can be
effectively used to identify viable solutions before an incident or disaster
occurs, or to assist in responding should it occur9.
Pump Scheduling
Energy costs generally constitute the largest expenditure for nearly all
water utilities worldwide and can consume 65 percent of a water utility's
annual operating budget. One of the greatest potential areas for energy
cost-savings is the scheduling of daily pump operations.
Energy-saving measures in water supply and distribution systems can be
realized in many ways from field testing and proper maintenance of equipment
to the use of optimal computer control. Energy usage can be reduced by
decreasing the volume of water pumps (e.g., adjusting pressure zone boundaries),
the head against which it is pumped (e.g., optimizing tank water level
range), or the price of energy (e.g., avoid peak hour pumping and make
effective use of storage tanks such as filling them during off-peak periods
and draining them during peak periods), and increasing the efficiency
of pumps (e.g., ensuring that pumps are operating near their best efficiency
point). Water utilities can further reduce energy costs by implementing
on-line telemetry and control systems (SCADA) and by managing their energy
consumption more effectively using optimized scheduling of daily pump
operations.
The pump scheduling problem is cast as an optimization problem and solved
using Genetic Algorithms. The optimization problem consists of determining
the least-cost pump operation policy that will best meet target hydraulic
performance requirements. The operation policy for a pump station represents
a set of temporal rules or guidelines (pump operating times) that indicate
when a particular pump or group of pumps should be turned on and off over
a specified period of time (typically 24 hours). Th optimal operation
policy is defined as that schedule of pump operations that will result
in the lowest total operating cost for a given set of boundary conditions
and system constraints. System constraints prescribe lower and upper limits
on nodal pressures, pipe velocities, and storage tank levels, and final
tank volumes at the end of a specified time period (normally 24 hours)
to ensure hydraulic periodicity. The resulting optimal control rules for
each pump in the system are then stored in the database and passed back
to the decision-support system interface for graphical results presentation.
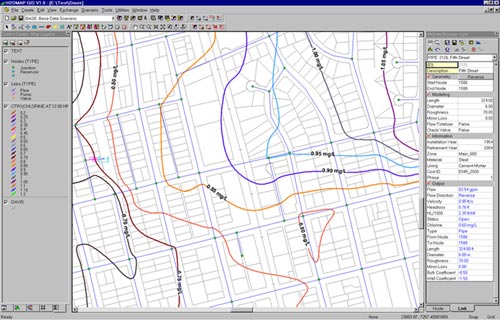
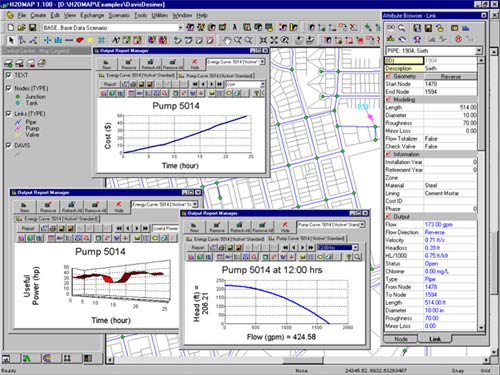
Results Presentation
The use of powerful GIS thematic mapping functionality
makes it easy to turn dry database information into stunningly colorful,
fully dimensional visualizations and to present analysis results in map
form. Users can generate accurate, and smooth contours for any variable
including elevation, pressure, hydraulic grade line, demand, water age,
chlorine concentration, and more, directly on the map - even overlay multiple
contours on a single drawing. Draw on a range of other sophisticated graphical
presentation tools, including color-coded mapping, dynamic annotation/labeling,
graphing, profiling, customizable tabular reporting, and vivid VCR-style
animation to produce truly compelling results. These graphical capabilities
are critical to better communicate and understand problem areas and system
deficiencies and to present remedial engineering solutions at community
information sessions or council meetings.
Conclusions
Water utility engineers are discovering a wide variety
of uses for GIS technology. In particular, GIS information is critical
to water distribution system planning and analysis. A new geospatial software,
H2OMAP Utility Suite, has been presented as a decision support
system to provide a GIS-based solution for water distribution system modeling
and management. Built entirely with Esri MapObjects technology, the software
system seamlessly integrates sophisticated GIS features and functionalities
with a hydraulic network simulator and optimization theory allowing accurate
network model construction and providing a reliable and effective means
for decision makers to quickly assess and address the implications of
alternative design, rehabilitation and operational changes on system performance.
Through the exploitation of GIS graphical data visualization capabilities,
potential system deficiencies can be quickly identified where improvements
are required. The resulting GIS-based software allows a wide range of
potential network improvement and enhancement alternatives to be modeled,
analyzed, contrasted, and evaluated, providing water utility managers
with the ability to readily optimize their capital improvement programs.
It also equips water utilities with expanded power and flexibility in
estimating the consequences of a terrorist attack or a crisis event on
their drinking water supply infrastructure, and in formulating and evaluating
sound emergency response, recovery, remediation and operations plans and
security upgrades. Finally, the software makes it easy for any utility
to work seamlessly across platforms and to manage water systems in a single
environment.
References
- H2OMAP Water - Users Guide. MWH Soft,
Inc. 300 North Lake Avenue, Suite 1200, Pasadena, CA 91101.
- H2OMAP Skeletonizer - Users Guide.
MWH Soft, Inc, 300 North Lake Avenue, Suite 1200, Pasadena, CA 91101.
- Miles, S.B and Ho, C.L. (1999). "Applications
and issues of GIS as a tool for civil engineering modeling." Journal
of Computing in Civil Engineering ASCE, Vol. 13, No. 3, pp. 144-152.
- H2OMAP Demand Allocator - Users Guide.
MWH Soft, Inc, 300 North Lake Avenue, Suite 1200, Pasadena, CA 91101.
- Boulos, P.F. and Ormsbee, L.E. (1991). "Explicit
network calibration for multiple loading conditions." Journal of
Civil Engineering Systems, Vol. 8, pp. 153-159.
- H2OMAP Calibrator - Users Guide.
MWH Soft, Inc, 300 North Lake Avenue, Suite 1200, Pasadena, CA 91101.
- Boulos, P.F. et al. (2001). "Using genetic
algorithms for water distribution system optimization." In Proceedings
of the ASCE Environmental and Water Resources Institute's (EWRI's) World
Water & Environmental Resource Congress, May 20-24, Orlando, FL.
- Boulos, P.F. et al. (2001). "Optimal operation
of water distribution systems using genetic algorithms." In Proceedings
of the AWWA Distribution System Symposium, September 23-26, San Diego,
CA.
- H2OMAP Protector - Users Guide.
MWH Soft, Inc, 300 North Lake Avenue, Suite 1200, Pasadena, CA 91101.
|