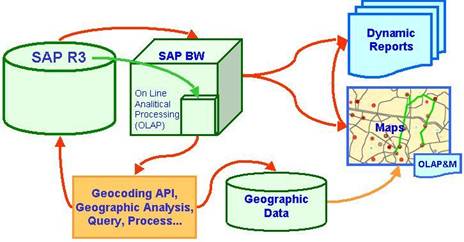
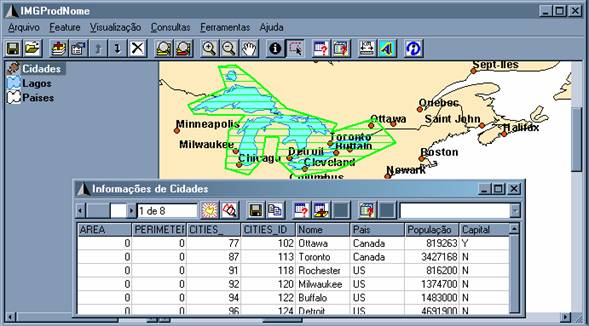
The system is a GIS that integrates geographic resources with Business Intelligence data from SAP/R3 and BW. The business features are stores and wholesalers, daily updated by an automated process of extraction from BW, geocoding and spatial related attribute processing. It has a simple interface that makes service provider contract management and analysis easier. Standard map functionalities are available. The most relevant functionalities are map queries used as OLAP queries filter and the joining of BW queries and map features, enabling spatial analysis or thematic maps creation over the SAP data.
Today open standards, flexibility, scalability, reliability and customization makes GIS useful for wide possibilities of professional applications. New applications are created each day.
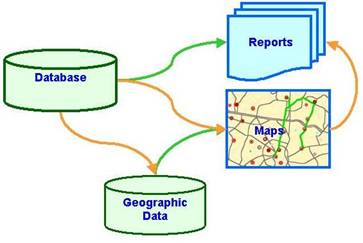
Most applications demands integration between geographic and business data. Usually geographic data is added to business data for map publishing or analysis, using specific geographic tools or technique (spatial analysis, geostatiscal analysis, etc).
Few years ago, new data warehouse systems were developed, based on relational technology, to store tactical information to answer ôwhoö, ôwhenö, ôwhatö and ôhow muchö questions in business. Technology advance (hardware and software) enabled use of more powerful tool for OLAP (On-Line Analytical Processing). OLAP uses multi-dimensional raw data aggregated and summarized to generate business intelligence reports providing an interactive access to a wide variety of possible views of information [OLAP Council,1997].
GIS software are much easier than OLAP systems, but are still to difficult to be used for average people. Integrating gives the analysts the power of strategic business information with spatial intelligence.
Present a simple, yet powerful, method where business analysts can add spatiasl data to their analysis.
Databases are an application to store data probably related to real objects or events. Spatial features in a GIS are a model of real objects that probably needs to be catalogued and controlled by someone and allowing most database having a spatial representation. Linking table rows with spatial features is the best way to put GIS into the business world.
Data integration between spatial data and business database is a simple and fast way to successfully obtain return on GIS investment. Most databases can easily be reached and queried by standard components like Microsoft OLE DB . Most GIS products already comes with database access capabilities.
Like databases, OLAP systems store data, but in a different way and for different purposes. Usually, data is related with multiple characteristics like a date, a place, a salesman, a costumer, etcà or in other words, raw data belongs to a very specific element in a few varieties of dimensions of the available data universe. For instance, US$ 1250 was the sales of a cookie brand , in the downtown store, in 7/5/2002: we have 3 dimensions (product, geography and time), 1 variable (sale volume in dollars) and raw sales data is stored for all products, all stores and all days.
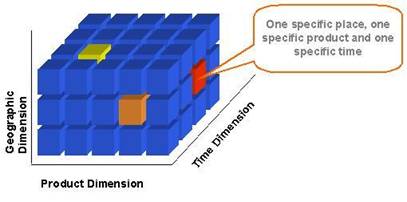
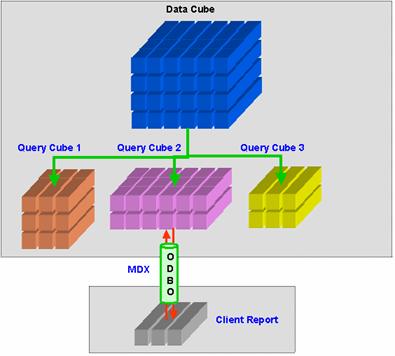
The data in an OLAP system is stored in a special structure known as cube. In Diagram 2 it even looks like a cube as it just mixes 3 dimensions. However, multidimensional data can be related to an infinite number of dimensions.
Each dimension has a list of elements that can be aggregated together in clusters, for instance, days can be aggregated in week or month, products can be aggregated lines of products and stores can be aggregated in counties, states and countries. These clusters are known as hierarchies. OLAP system is able to process a huge amount of raw data to output a detailed report of a very specific situation or a more generic summary about a whole region or period of time.
Dynamically and interactively the OLAP users can perform new operations like consolidation, drill down, roll up, slice & dicing, dimension query and filtering, generating reports in manner never seen before, surfing the data freely researching best aspects to reach information.
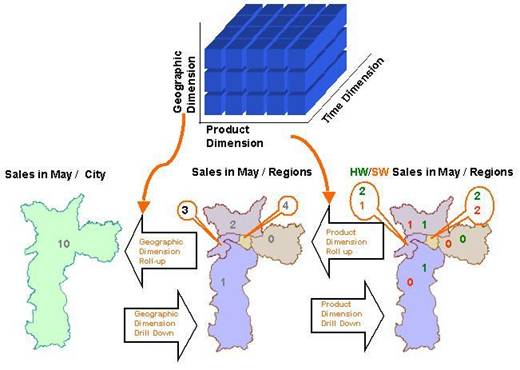
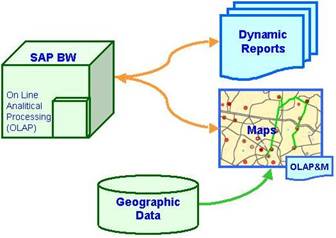
Geography components are very common in OLAP cubes. GIS data integration add to OLAP systems new tools to perform its natural operations and add dynamic attributes to maps. We can see a consolidated representation of a map or we can drill-down to see details about regions and other dimensions.
SAP is a german company widely known for its product, R/3, the most used Enterprise Resource Planning (ERP) tool of the market. R/3 essentially is a Data Warehouse, a huge one. Its modules can support and control most areas in different types of companies, providing robust solutions for a high cost.
Despite of being so big and important SAP does not supply all costumersÆ needs and attract other companies to create and deliver complementary products to supply consistent system solutions. SAP chose Esri to be its GIS company provider. Some Esri products come with SAP extensions and vice versa, with no need of custom development to have data integration.
SAP also produce its OLAP system known as SAP Business Warehouse or just BW. It can be used together with R/3 and are standard SAP modules to make batch data load from the data warehouse to the OLAP system. BW completes the SAP architecture providing strategic information to the business analysts.
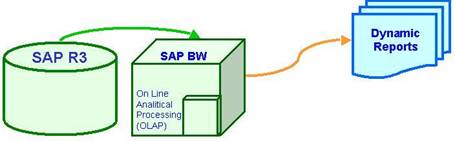
R/3 and BW are sophisticated and powerful tools, require high qualified staff to setup and administrate and despite of high cost of acquisition, design, installation and maintenance, data warehouse and OLAP systems outputs are commonly just graphs and reports.
Few users find SAP BW Business Explorer easy and friendly what definitely it is not. BW users profile is analysts that need to focus on business. They find it hard to use. Simple and friendly interface is a key to succeed.
With BW and R/3, geographic data can be created for different purposes and by different methods depending on the application. Geocoding is one of the most used methods to create business spatial data. Spatial query, network analysis or custom spatial process also can be new method to create spatial data or spatial related attributes.
Spatial related data can be loaded into R/3 or BW to help on data analysis.
SAP BW has a mapping interface for the SAP BW Business Explorer called BexMap that are a SAP component implemented with Esri MapObjects 2.0.
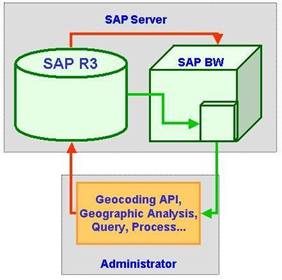
It allow BW users to easily create and add maps with strategic spatial oriented data to reports [Esri, 2002].
Very few systems have a friendlier interface than a map centric GIS interface. They are beautiful and stimulant, while can be very intuitive and easy to use. This is one of the principles that guide Geographic Business Warehouse (GBW).
GBW is a GIS integrated with SAP BW. It has an intuitive map centric interface with basic map resources and commands. It was design for users with very few or none GIS experience. It also potentialize BW use with simplified query access and spatially enabling BW query results.
GBW was developed with Microsoft Visual Basic 6.0 and Esri MapObjects 2.1. It has two modulus as can be seen at Diagram 7:
1. a Feature Manager application
2. a GIS and BW client application
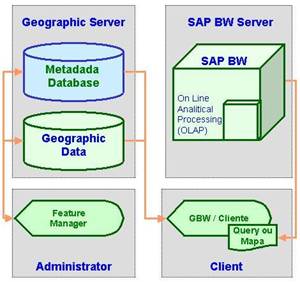
GBW uses a Metadata Database to store system configuration data, like available features, available attributes, attributes description and default feature symbology. The Metadata Database also stores basic BW metadata and rules to link features and BW data. The Geographic Data can be stored as shapefile format or ArcSDE Layers.
Feature Manager is used just by administrators. It basically manages the Metadata Database and can load or change all available feature metadata. It also controls how features will be associated with BW data. The linking rules are loaded into the attribute metadata table as BW characteristics list.
The GBW Client application allows users to query geographic and BW data together.
GBW was originally design to help companies on service provider contract management for very dynamic businesses were stores moves frequently. Stores and providers are daily updated in the R/3 and geocoded and spatially related considering active contracts, providerÆs reach area and distance between the store and provider. Service Provider and stores maintenance profile is stored into BW. It is queried to generate strategic information for service contract negotiation and maps are applied to define spatial cluster areas that help on the business management.
The system was design to fit into old hardware platforms with few processing resources. The minimum system requirements can be:
ÀIntel Celeron 300 Mhz
ÀMinimum RAM 64 Mb
ÀCD ROM
Memory is critical to access a big volume of information and best configurations are recommended in this case.
The software requirements are:
ÀWindows 95, 98, NT 4 or 2000
ÀMapObjects Run-Time 2.1
ÀMicrosoft ADODB 2.6
ÀSAP BW Front end 6.10
ÀMap save and load
ÀSaves BW query data with map
ÀPrint and export Map to JPG or BMP file formats
ÀSimple feature access
ÀActive Legend with symbology
ÀMap layer visibility control
ÀPre-defined or custom symbology
ÀThematic maps
ÀLabel placement
ÀDisplay control (zoom, pan, etc)
ÀFeature query in the map, by attributes or by area
ÀAttribute description
ÀDistance Meter
ÀFeature display filter
ÀSAP BW query
ÀBW query filter setup
ÀImplements SAP specific variables filter
ÀJoin between feature attribute and BW data
ÀThematic maps, label,à over BW data
ÀFeature query can be used to define BW query filter
ÀExport BW query and Feature query into CSV file format
ÀOn Line Help
In OLAP systems data is not stored as in relational databases. The OLAP cube is a complex structure with several dimensions and variables. Multidimensional data access also requires different approach. While standard tables has columns and lines, following the same concept, multidimensional data has columns, rows, pages, chapters, sections, and so on. However it is very hard to query and manage the result of more than 3 dimensions at the same instruction.
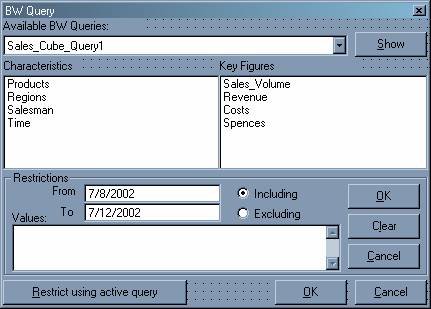
To query multidimensional data was created the MDX (Multi Dimensional eXpression). SAP BW can be queried using standard MDX code but also using specific SAP BW MDX implementation. Table 1 shows a MDX example. It would create a report for each day in the interval, with each Region, each Product sold in the Region and with Sales_Volume.
SELECT
Crossjoin (Regions, Products) ON COLUMNS,
NOT EMPTY Sales_Volume ON ROWS,
Days ON PAGES
FROM Sales_Cube
WHERE ( 7/8/2002 < Day < 7/8/2002 )
A MDX expression can be sent to an OLAP system using Microsoft ADOMD (ActiveX Data Objects Multi Dimensional) and the specific OLEDB for OLAP provider for the system. ADOMD is a subset of MDAC (Microsoft Data Access Component) package and the OLEDB provider for SAP BW is delivered together with SAP Front end installation CD.
GBW is a sophisticated business intelligence application, associated with geographic software and databases. It has a simple and easy-to-learn interface, able to permit outstanding benefits at corporate level like fast deployment, high productivity leverage at user level, self-sufficient training, low cost maintenance, and limitless expandability.
GBW is so easy and friendly that most users chose it as theier default SAP BW interface making SAP Business Explorer useless even for access just the OLAP cubes. GBW is the perfect tool for making contract management and analyses of services providers and easy and enjoyable task.
OLAP Council, 1997, http://www.olapcouncil.org/research/whtpapco.htm
Esri, 2002, http://www.Esri.com/partners/alliances/sap/sap_bw.html
Rodrigo Nogueira Barrionuevo
Bachelor's Degree in Agricultural Engineer (UNICAMP -1995)
Specialist in Business Administration (FGV-2000)
GIS Consultant (1996-present)
Technology & Development Manager, Imagem Sensoriamento Remoto - Brazil