Shaded or painted
relief backdrops add tremendous visual
interest and value to cartographic products. The addition of relief backdrops to
maps has proven an effective technique for portraying realistic landscapes and
geographical situations and it is widely practiced in cartography today.
However, the beautifully smoothed and colored shaded relief surfaces commonly
seen as backdrops
on many maps often do not reveal the true
character of the ground being shown. By enhancing painted or shaded relief with
textures and materials, more realistic information can be displayed and
therefore provides map users a better sense of the geographical situation
present in the map. The information required to develop these geographic
textures and materials
can be derived from a number of widely available
digital sources, including digital aerial photography, satellite imagery and
other GIS thematic data. Incorporation of this additional information is
desirable and possible while still maintaining visual balance and readability.
This presentation will discuss the concepts and philosophy behind the use of
geographic textures and materials. It will also provide a
step-by-step application example showing how landscape based textures and
materials can be applied to cartographic backdrops using ArcGIS to create a
dramatic, interesting and informational cartographic presentation.
Traditional thematic maps and plats offer little to let map users picture
the true geographic character of the landscape shown, that is, the actual
texture, material and pattern of the land'
s covering. The myriad lines and
annotations on these products are just not concerned with presenting complex
and important landscape characteristics such as terrain, land cover or land
use. Yet, to remedy some shortcomings, cartographers have developed a number of
techniques for terrain and landscape portrayal.The most widely used of these techniques is shaded
relief
or hill shading.
In its most basic form, the term
Shaded relief
usually applies specifically to gray scale image
which illustrates how the sun might shade the land given a constant solar
azimuth and altitude. This gray scale image is incorporated as a backdrop image in the cartographic
presentation. This technique tends to solve the basic problem of providing a geographic context for locating
planimetric features, but has limited utility because it lacks the advantages
of using color and texture.
Improvements in mapping software, computer graphics and printing technology
now allow thematic and mapping and platting to easily take advantage of
portraying underlying terrain features colorized shaded relief. This particular brand of cartographic
presentation is called painted relief.
Displaying thematic map information as painted relief has been an
effective and popular cartographic method. It is practiced worldwide among
production cartographers as well as the ever-growing population of Geographic
Information Systems (GIS) users and countless beautiful, interesting, and
informational maps are created using painted relief techniques. Yet, shaded relief, and even painted relief
techniques do not address or include landscape patterns and provide no
information about the actual materials covering the ground. The hill shaded
terrain image generated from digital elevation information would not include
important landscape patterns such as urbanization, farming, forestry, and many
other landscape processes, nor the covering of the terrain; (ie Is the land
cover material a forest, sand dunes, rocks, or snow?). Colorizing a theme'
s distribution and
draping it on a relief model does nothing to address the actual land cover
texture nor does it imply material. Indeed the shaded and painted relief image is generated from a
statistical elevation model of the ground and it is unnaturally smooth and
devoid of detail. This missing detail, in today's world, provides important insight
into the nature and geography of an area. Depending on the purpose of the map, land cover patterns, textures and
materials should be included in the cartographic presentations.
Many cartographers have sought raw image sources such as aerial photography and satellite imagery to show land cover patterns and textures in their presentations. But the raw image, even when ghosted for map clarity is essentially an information overload situation. In its uninterpreted form, raw imagery suffers from a number of problems: 1) relief inversion: hills may look like valleys, valleys may look like ridges; 2) features obscured due to shadows; 3) too much information shown: aerial images display everything--including unimportant items; 4) no visual hierarchy: unimportant items are shown on the same visual level as highly important items; 5) temporal problems: images get out of date; and finally 6) lack of control over what is shown: the role of the cartographer is to design and control information being presented, so the use of raw imagery as a source for geographic textures and materials must be made on a very selective basis.
On the other hand, aerial photography and satellite imagery, when used as a
basis for a properly interpreted land cover map, can be a excellent source for
mapping geographic textures and materials, since a good land cover map provide important information about the
patterns, textures and materials of the lands'
s cover. It can provide the type of information
needed to enhance painted relief techniques to a level where geographic textures and materials can be
easily included in the cartographic backdrop without interfering with map
readability.
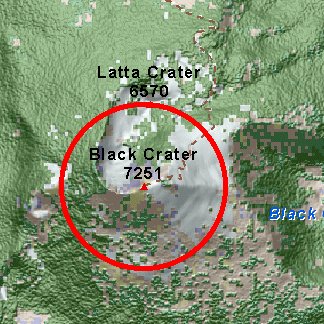
This paper presents a single example which illustrates how to apply land
cover textures and materials derived from satellite imagery to a painted relief
cartographic backdrop. The study area is the Three Sisters Region of Central
Oregon. This area was selected to
demonstrate this technique because it embodies a wide range of land cover types
that are typical of lands managed for multiple use by the Bureau of Land
Management. Data sources for the
project include 10 meter digital elevation models, a simplified land cover map
derived from Landsat TM data, roads, streams, boundaries and geographic names
were extracted from BLM GIS databases at the Oregon State Office. Esri'
s ArcMap
product was used as a display tool, while the material and texture assignment was
performed in the ArcGRID system utilitizing and Arc Macro Language (AML) program.
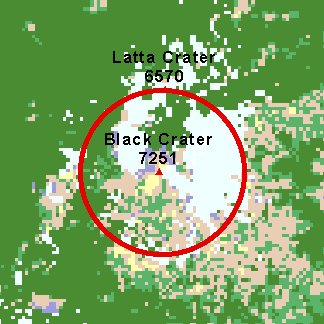
For this demonstration, a simple land cover classification was performed using Landsat TM satellite information of the Three Sisters Region of Central Oregon. Seven land cover categories were mapped for the area: Water, Snow, Barren, Grass;, Shrub, and Lava. Simplicity was maintained for this demonstration. In actual practice more elaborate schemes would probably be used. The graphic below shows only a small portion of the entire study area since space is limited in this form.
To develop and build materials, textures and patterns, each land cover category must be evaluated for a number of characteristics: Color, texture, and reaction to light. Since land cover categories are generally an accumulation of many similar materials and textures, it may be a judgment call as to describing their appearance. The color of a class is fairly obvious. Texture can be presented in terms of the range of heights of individual objects that belong to that land cover category, while the reaction to light may vary from reflective surfaces such as snow and water to diffuse and absorbing surfaces such as forest stands. Below is a simple table used to guide the development of an AML program used to build a texture and material map for the area:
Material |
Color |
Texture |
Light reaction |
|
Water |
Blue |
Smooth |
Reflective |
|
Snow |
White |
Smooth |
Reflective |
|
Rock |
Dark Gray |
Blocky |
Opaque |
|
Grass |
Yellow |
Smooth |
Reflective |
|
Shrub |
Sagebrush |
Low Bump |
Diffuse |
|
Forest |
Forest Green |
Tall bump |
Diffuse |
|
Lava |
Ruddy |
Rough |
Diffuse |
These values were translated into a AML program which operates in the
ArcGRID system. (Shown Below.) It uses the IF and NORMAL Grid
functionality. The program establishes different textures for each material by evaluating
values created using the NORMAL command, then setting a texture height for pixels meeting that
criteria. For example, lava has values of 7 and 8 in the land cover map; where this is true and the normal_random
noise map is >
; 15, set the output pixel equal to 70. This creates a very rough irregular surface
pattern.
Roads and rivers are also incorporated into the product from vector sources, since they were not mapped in the land cover classification.
if (land_cover ge 9)
texture1 = 10
else if (land_cover == 7 &
normal_random > 15) /* dark lava
texture1 = 150
else if (land_cover == 8 &
normal_random > 15) /* light lava
texture1 = 120
else if (land_cover == 1) /* water
texture1 = -15
else if (land_cover == 6 &
normal_random gt 30) /* small trees
texture1 = 65
else if (land_cover == 5 &
normal_random gt 50) /* medium trees
texture1 = 85
else if (land_cover == 4 &
normal_random gt 70) /* large trees
texture1 = 100
else if (land_cover == 3 &
normal_random gt 90) /* shrub
texture1 = 10
else if (land_cover == 2) /* grass
texture1 = -12
else
texture1 = 0
endif
texture_elevation = merge(rivers * -10,roads_1 * 10,texture1)
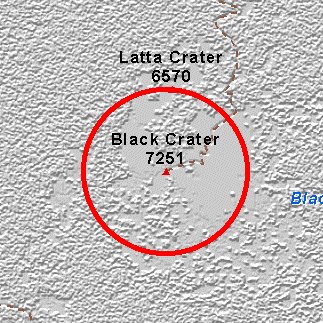
The program runs quickly and creates essentially and “elevation of texture” grid. It is shown below in shaded relief form so the final textures are more apparent.
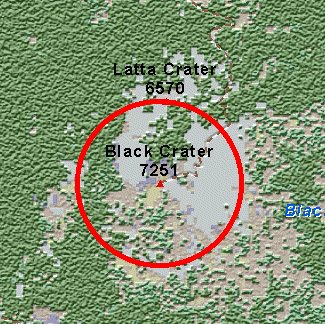
The image below shows how the land cover category color looks after it has been texturized.
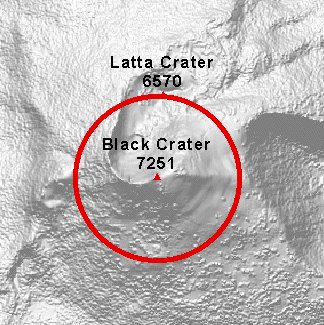
The final step in the program sequence is to integrate the texture elevation information with the terrain elevation data. This is performed through the HILLSHADE command in ArcGRID. The command used is shown below:
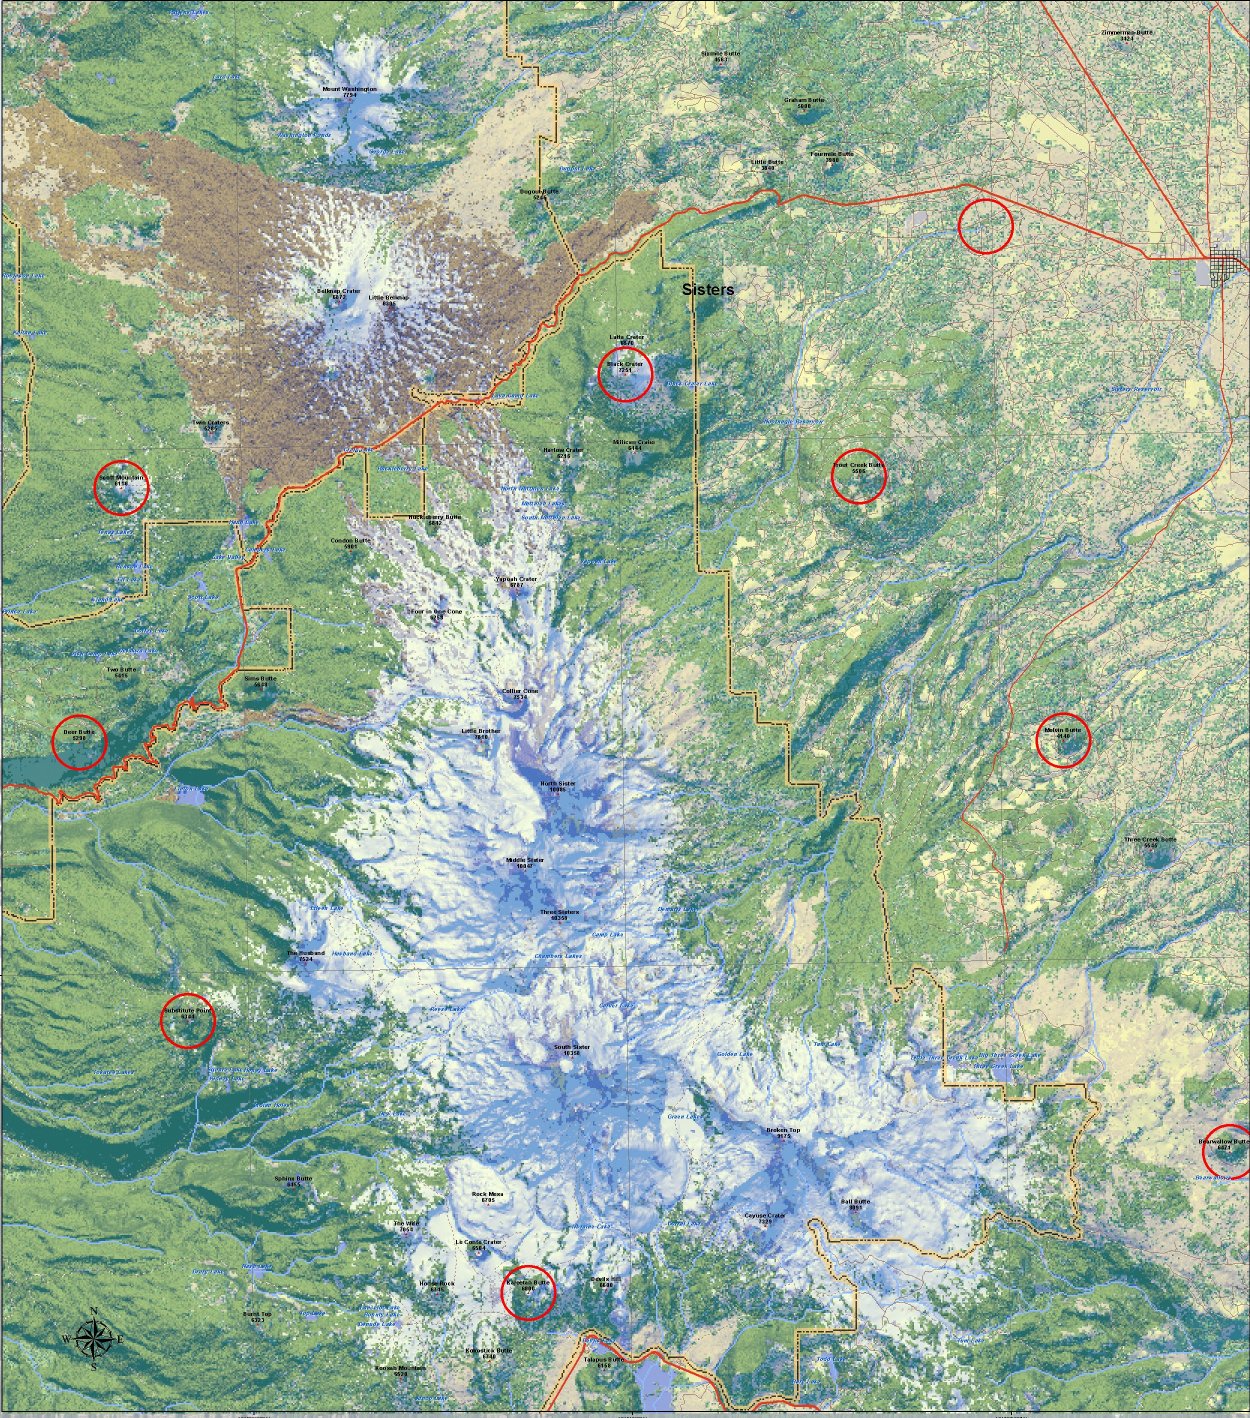
The image below is the result of the above command and gives a better idea of the materials, textures and patterns of this landscape!
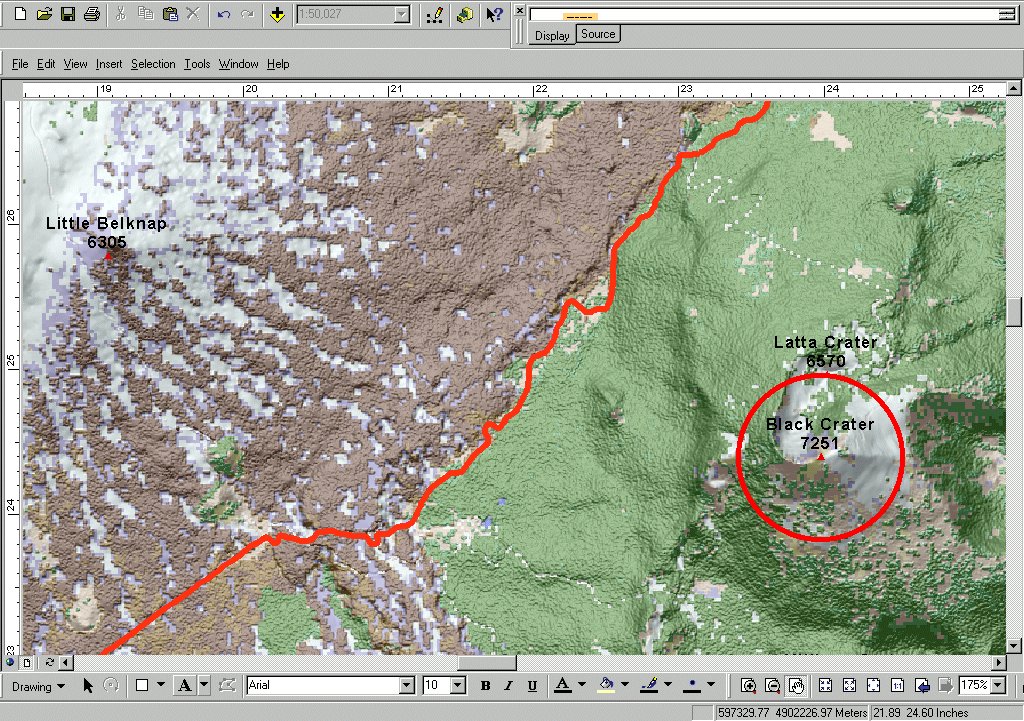
Since ArcGIS cartographic display capability supports data transparency, the final texturized terrain and the land cover grids are loaded into ArcMap. The Land cover map is assigned its colors and overlain on the texturized terrain. The image below shows the results of this process.
The above example demonstrates one method of applying materials and texture to cartographic backdrops. It illustrates that new technology provides cartographers options for creating richer and more interesting cartographic products. With this technology, more realistic and informational maps can be designed, more complex geography can be communicated and maps can be of better service to everyone.
Jeffery S. Nighbert
Bureau of Land Management
Oregon State Office 955.2
1515 SW 5th Avenue Portland, Oregon 97201
Phone:(503) 808-6399 Fax: (503) 952-6419
Email: jnighber@or.blm.gov
Jeffery S. Nighbert has been a geographer with the Bureau of Land Management for over 20 years and is currently the Senior Technical Specialist for Geographic Information Systems (GIS) at the Oregon State Office, located in Portland, Oregon. He has extensive experience in GIS and holds a M.A. in Geography from University of New Mexico.