The Richland County GIS Department has investigated the feasibility of modeling urban environments in three dimensions for use in upcoming projects and programs. Exploiting emerging technologies related to remote sensing, GIS, 3D modeling, and computing hardware, procedures for creating a texture rich urban model were established. Looking toward future developments in true-3D GIS, the County was successful in modeling thirty square blocks of downtown Columbia, SC. The model depicts actual feature heights above an elevation surface as calculated from LIDAR data. The realistic scenery is highlighted by building textures derived from oblique digital photos.
The Geographical Information Systems (GIS) Department functions under the cumulative mandate of three entities: those of Richland County, the Information Technologies Department (IT), and GIS itself. Being part of Richland County, the GIS department inherits the responsibility of improving the quality of life for all its citizens by providing cordial, responsible services and assistance in a prompt and fair manner. Of these essential County services the IT Department is authorized to be the visionary force that reinvents, reengineers, and streamlines all County Government practices where technology is concerned. The result of which is a more efficient and effective Government that can utilize the time/cost savings to improve the quality of interaction between Richland County and its citizens. As part of the IT Department, GIS finds itself supporting the broader goals of the County and IT through specific applications of spatial data, statistical analysis of geographic data and information and applications of that data. The five main goals for the GIS Department are:
To build a framework of fundamental digital geographic data elements that support Richland County�s services to its citizens.
To coordinate all digital geographic data so that services rendered to citizens are efficient and improved over time.
Make geographic and related information available to citizens while protecting county investment in data development.
Empower County officials and employees by providing the tools, data, and information needed for answering practical problems, policy issues, and political questions that impact citizens.
Foster data sharing partnerships between government and private entities so that economic, environmental, public safely, and infrastructures are improved for citizens.
With these goals and mandates in mind, the GIS Department seeks to find and realize innovative ways to apply technology to existing county methods and procedures so that citizens benefit both directly and indirectly from a local government able to respond in the timeliest fashion.
Currently, the business community has no fundamental characterization of the urban environment for use in economic development and planning. Accurate geographic data of the community are necessary to analyze, convey, and postulate business scenarios involving physical structures, the environment, and demographic and economic variables. Business recruitment, architectural design, gentrification programs, and urban planning rely on paper-centric plans and information that prevent community leaders and individuals from asking and visualizing 'what-if' scenarios. Increased business and community development rely on accurate and timely data not currently available to the City of Columbia. Regarding this limitation, Richland County GIS developed a virtual model of the urban environment in three dimensions utilizing advanced technologies of geographical information systems (GIS) and remote sensing. Specifically, the County created a method in which users can explore Columbia, SC in a computer-based virtual environment where all objects are constructed to scale with accurate aesthetic properties. Technology hurdles such as hardware limitations, software infancy, and lack of procedural precedent were overcome. GIS and remote sensing technologies and data were exploited to provide correct geometric shape and location for all features within the study area including buildings, trees, street lines, sidewalks, parking spaces, and cross walks. The foundation of the model relies on the accurate terrain surface derived from innovative airborne laser mapping techniques.
The project was conceived while viewing a crude interactive computer-based model of the Sydney 2000 Olympic grounds on the Internet. It provided the end-user with a method for navigating within the virtual world. Unfortunately, the objects shown in this model were not in true scale, but simply an artistic rendition of the region created by the developer. It was at this time that we saw the potential application of GIS and remote sensing technologies applied to the relatively new methods of 3D modeling and virtual reality.
The first step in developing this type of model was researching modeling software packages and evaluating a necessary balance between system complexity and functionality. It was determined that a highly complex system would make development very tedious and would inhibit modeling a large region of the urban environment in a timely fashion. We also were looking for a system that could be loosely coupled with our existing GIS to input the terrain elevation and geographically referenced data. It was determined that Evans and Sutherland's RapidSite software, initially developed for the computer aided drafting community for pre-development visualization, would provide the best functionality without the increased complexity of other software packages. It even provided closely coupled communication with GIS surface models and location referencing systems.
Richland County purchased the software in the spring of 2001 and began testing its functionality and productivity. New site visualization projects could be created in RapidSite using a surface model in GRID, TIN (triangular irregular network) or shapefile contour format. The software also provided functionality to drape raster (.tif) and vector (.shp/.dwg/.dxf) data over the surface to generate a visually realistic terrain. The vector data could be filled/represented using custom textures (i.e. grass, concrete, asphalt) to enhance its appearance. Most importantly, the software allowed users to create accurate 3D models of buildings and attach real life photographic textures to exterior surfaces with relative ease.
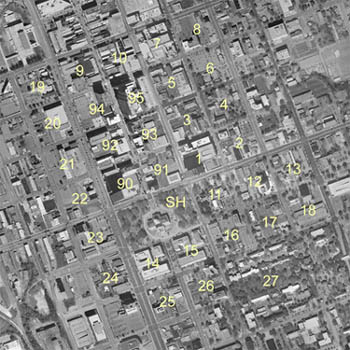
After software and hardware configurations were established, it was determined that the bulk of the work associated with the project would come in the form of data collection. A region of study was defined as approximately 30 blocks of downtown Columbia, SC, including the state capital and the surrounding central business district (Figure 1).
Figure 1. Modeled Blocks
Much of the data collection could be performed in the office using existing GIS and remotely sensed data, but fieldwork involved collecting digital pictures of building facades for use as textures in the 3D model. A University of South Carolina student was hired to perform these duties during the summer of 2001. Over 700 digital pictures were collected and edited to remove obscuring objects and prepare them for the model. The images were organized in a hierarchial manner based on the associated block, building, and orientation. Other data collection involved digitizing the geographic features listed below on an aerial photograph of the city:
In March of 2000, Richland County's GIS department contracted with a remote sensing firm to collect accurate elevation data for the entire county. This data was collected using a leading edge technology known as LIDAR (Light Detection and Ranging). The sensor is attached to an aircraft and flown over the earth at 6000 ft. It shoots approximately 10,000 pulses of light at the earth and can determine the exact location at which each pulse hits a feature on the surface. The pulse returns show that the light can bounce off any feature on the earth including trees, buildings, and the ground. The output produces points approximately five feet apart that can be interpreted to produce a visual representation of feature elevations. The elevation points collected in March of 2000 were overlayed on top of the building footprint polygons to determine an average height above ground level for each building within the study region. The LIDAR points were also used to create a Triangular Irregular Network (TIN) terrain model. The TIN surface model and GIS data layers were then used to create a RapidSite three-dimensional project. The GIS layers can be filled with colors and textures to provide a true to life appearance to the terrain. Figure 2 shows the GRID based surface model with raster and vector overlay data in the RapidSite software.
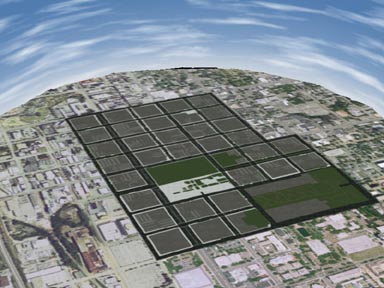
Figure 2. GRID surface model with raster and vector textures
Building models were created by extruding the building footprint polygons by their associated LIDAR derived height (Figure 3).
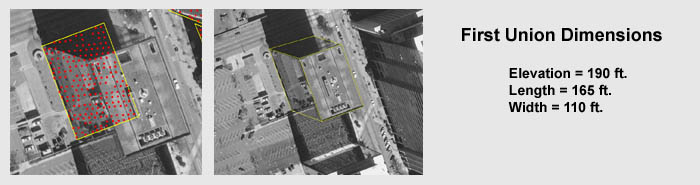
Figure 3. Gather height information from LIDAR points
Textures from the digital photography were attached to the sides of the building and the model was saved for later use (Figure 4).
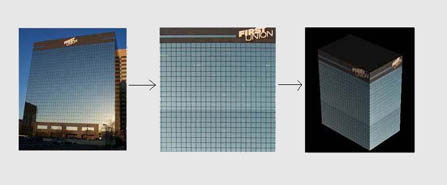
Figure 4. Texture Collection, Editing and Utilization
When all of the buildings in the study area were completed, they were added individually to their surface location in the model. At this point, the model became an accurate three-dimensional surface with all of the GIS data (street lines, sidewalks, parking lines, crosswalks, and medians) draped over the TIN. The buildings can also be seen at their location in real life (Figure 5).
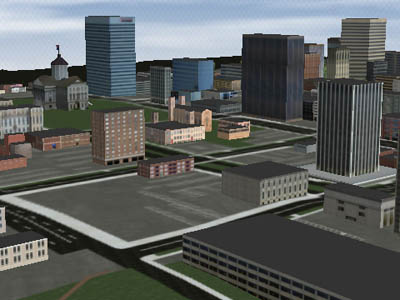
Figure 5. Model Appearance With Buildings
Trees were then added to the model using aerial photography for location and LIDAR to assign the canopy height. Richland County utilized generic tree models included with the RAPIDsite software and were duplicated and scaled to increase efficiency and minimize total model size. The software also utilizes modeling techniques whereby trees are represented as two crossing polygons appearing three-dimensional from the side. (See Figure 6)
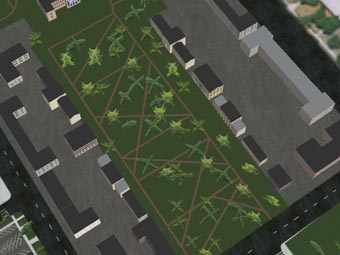
Figure 6. Modeling technique utilized for trees
An image of the completed model is displayed in Figure 7.
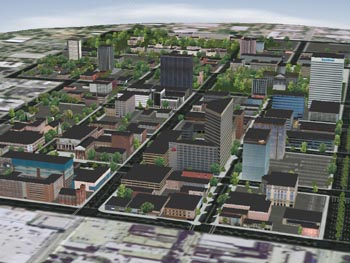
Figure 7. Completed Urban 3D Model
The model allows users to navigate within the virtual city however he/she chooses using RapidSite's built in 3D navigation controls. Flythrough movies can be generated, screenshots captured, and features in the model can be edited with ease. When the Affinity Building across from the state capital changed its name to the SouthTrust building, the associated model was updated in the virtual city with little effort. A flythrough that rotates around Columbia, SC, several screenshots and a vrml sample model can be found on www.richlandmaps.com under the projects heading.
The nature of this project placed heavy dependence on the latest and greatest technologies. LIDAR is a remote sensing technique that has only been available for a few years and Richland County was one of the first counties in the country to acquire this type of data. Evans and Sutherland's RapidSite modeling software was introduced in 2000. The computer hardware necessary to support the software listed above is extensive. A Dell 330 1.5 GHz workstation was used including 1G RAM and a 128 Mg Wildcat II graphics card developed by 3D Labs Inc. This is the best graphics adapter currently sold, devoting a full 64Mb to texture memory and 64Mb to frame buffering. The GIS software utilized in this project was ArcGIS 8.1 and ArcView 3.2 developed by Environmental Systems Research Institute (Esri). Without the ability to accurately determine spatial attributes such as size, shape, elevation, and location of all features, the development of an accurate 3D model would have been impossible. The ARC software packages provide for the gathering of such data and RapidSite offers the ability to develop the models and display them in a three dimensional environment. Developing this type of 3D GIS model three or four years ago would have been impossible due to limitations in hardware, software, and spatial data technologies.
Innovativeness:
Visualizing current or future changes in an urban environment such as Columbia, SC is a formidable task. Perhaps someone decides to develop a new building downtown, and they want to know what the building will actually look like or from what floors they will be able to view the state capital. This type of question could not be answered without an accurate visualization model. Other potential applications include advertising for businesses that are located in the central business district and using the flythrough as an economic development stimulus for large companies interested in coming to South Carolina. The proactive development of this model will result in many other applications as software capabilities increase. Presenting this type of virtual city on the Internet with the ability to navigate freely and gather detailed information associated with all the buildings in the model would provide great information to business travelers and tourists. The potential applications of this type of model are limited only by the imagination of end users.
Benefits/Impact/Metrics:
The achieved benefits of this project lie within the success of the model itself. Proving the feasibility of developing such a visualization tool and preparing for similar future applications such as economic development, building renovation visualization, city publicity, viewshed analysis, 3D GIS, and commercial development pre-construction assessment make the project a great accomplishment. Pioneering such a high-tech process will benefit all those who attempt to develop virtual reality models and will provide a system for accomplishing such a task. Because the project was recently completed and the dissemination process is underway, the model of Columbia, SC has only just begun to realize the positive impacts targeted by the County administration and GIS team. Tangible metrics will be calculated as the model begins to influence economic development and business projects.
3D GIS of Tomorrow:
It has become clear that technological advances change the way we live and
work, with goals to gain accuracy, cost effectiveness, and efficiency. Visualizing
current or future changes in an urban environment such as Columbia, SC is a
formidable yet necessary task. Perhaps someone decides to develop a new building
downtown, and they want to know what the building will actually look like or
from what floors they will be able to view the state capital. This type of question
could not be answered without an accurate visualization model. Other potential
applications include advertising for businesses that are located in the central
business district and using the flythrough as an economic development tool for
large companies interested in coming to South Carolina. The proactive development
of this model will result in many other applications as software capabilities
increase. Presenting this type of virtual city on the Internet with the ability
to navigate freely and gather detailed information associated with all the buildings
in the model would provide great information to business travelers and tourists.
(See Figure 5) The potential applications of this type of model are limited
only by the imagination of end users. Proving the feasibility of developing
such a visualization tool and preparing for similar future applications such
as economic development, building renovation visualization, city publicity,
viewshed analysis, 3D GIS, and commercial development pre-construction assessment
make the project a great accomplishment. Pioneering such a high-tech process
will benefit all those who attempt to develop virtual reality models and will
provide a system for accomplishing such a task. It is however, important to
realize the role of technology in this genre. Developing this type of 3D GIS
model three or four years ago would have been extremely difficult due to limitations
in hardware, software and spatial data technologies.
The GIS community has reached a point where true three dimensional visualization
and spatial analysis are feasible and necessary, further expanding the term
GIS application and modeling a world that is not flat.