Rhonda Fetters, GIS Programmer, Science Applications International Corp
Seavey Anthony, Program Automation Branch Chief, RMA, Kansas City
Jay Garner, Program Development Division, RMA, Kansas City
Abstract: The U.S. Department of Agriculture, Risk Management Agency (RMA) administers the Federal crop insurance program. Its purpose is to provide an actuarially sound risk management program to reduce agricultural producers� financial losses. This paper describes several proposed applications of GIS in RMA's business processes. It illustrates how GIS can be used to provide mapping tools and products for decision makers and the process of integrating RMA policy data with GIS in order to visualize various aspects of RMA�s business.
The Federal Crop Insurance Corporation (FCIC) was established by the Federal Crop Insurance Act (FCI Act) in 1938 to provide crop insurance for America's farmers. It now insures 155 crop/plan combinations.
The use of GIS is applicable to many areas of the crop insurance business. The applications discussed in this paper include the ability to:
1. Geographically code policy information to show where RMA�s business is located, including: program participation, loss ratios[a], and causes of loss.
2. Compare crop insurance participation with demographic information in order to identify underserved and minority populations; and
3. Define risk areas more accurately by analyzing physical factors that affect crop insurance risk.
Under the FCI Act, RMA is mandated to take such actions as are necessary to assure the actuarial soundness of the Federal crop insurance program, including the establishment of adequate premiums for all insurance plans. The ability to evaluate high loss ratio areas by cause of loss is crucial to the RMA manager and analysts who establish rates.
In order to demonstrate the capabilities of using GIS as an investigative tool, the RMA Online Summary of Business Application was used to select pilot counties for mapping RMA policy data. Selection was based on four criteria:
The state was included in the Public Land Survey System (because producers in these states report a "legal" description of their location);
The county had a high loss ratio (greater than 1.075);
The county had a high number of policies sold; and
The county had a high participation rate[b].
The purpose of this investigation was to explore mapping RMA data below the county-level. The two counties discussed in this paper are Dickinson and Jefferson, both in Iowa. However, before describing the results of mapping this data, it is important to understand the different insurance instruments that are available to producers.
Crop insurance is available to producers with deductibles of 15 to 50 percent. Producers can also select from yield and revenue-based insurance plans. These plans indemnify producers for crop loss due to reduced yield or prevented planting when the producer is unable, because of drought, flood, or other natural disaster, to plant crops for harvest on the acreage for the crop year. The revenue-based insurance plans also provide coverage for a drop in price.
This group of crop insurance models is based on a guaranted yield to the insured producer. The guarantee is a percentage of the yield calculated from historic yields (individual or group). Indemnities result from a shortfall of the actual yield. This yield shortfall is multiplied by an indemnity price selected by the insured before the insurance period begins. Within this group, there are two principal plans: Actual Production History (APH) and the Group Risk Plan (GRP). APH is based on individual yield histories, while GRP groups producers of the same crop in a given area or county and compares the actual group yield to expected group yield. Table 1 summarizes RMA business by yield-based insurance plans for the 2001 crop year.
Table 1.�Summary of RMA Yield-Based Insurance Plans
|
Insurance Plan |
Policies Sold |
Total Indemnity |
Number of Crops |
|
APH |
1,242,950 |
$1.3 billion |
70+ |
|
GRP |
13,598 |
$23 million |
8 |
This group of crop insurance products guarantees a certain amount of revenue to the insured. Indemnities are paid when the measured is less than the guarantee. Within this group, there are several models based on individual revenue streams and expectations; one non-commodity specific Adjusted Gross Revenue (AGR) plan, and three commodity-specific individual revenue plans: Crop Revenue Coverage (CRC), Income Protection (IP), and Revenue Assurance (RA). There is also one group-based revenue plan, Group Risk Income Protection (GRIP).
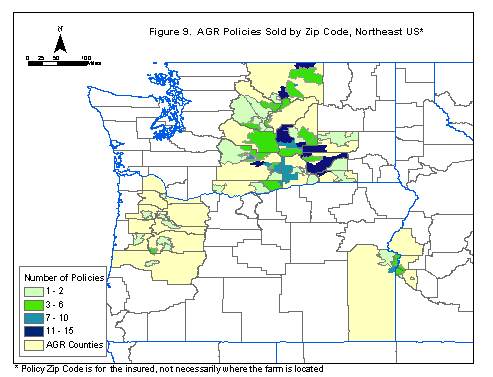
Table 2 summarizes RMA business by revenue-based insurance plans for the 2001 crop year. CRC is the main revenue-based insurance plan. It is provided for six crops (corn, cotton, grain sorghum, soybeans, rice, soybeans, and wheat) in a number of states. All revenue-based plans are only available for a limited number of crops and states. AGR is a pilot program that was designed to extend insurance availability to small, specialty crop producers in a limited number of states. In the Northwest (ID, OR, and WA) the program is currently providing coverage for 78 different commodities, for 50 of which insurance was previously not available. The AGR program is also available in New England (CT, MA, ME, NH, RI, VT).
Table 2.�Summary of RMA Revenue-Based Insurance Plans
|
Insurance Plan |
Policies Sold |
Total Indemnity |
Number of Crops |
|
GRIP |
3,101 |
$2.5 million |
2 |
|
AGR |
564 |
$8.2 million |
n/a |
|
CRC |
523,344 |
$1.1 billion |
6 |
|
IP |
19,100 |
$41 million |
6 |
|
RA |
54,444 |
$146 million |
6 |
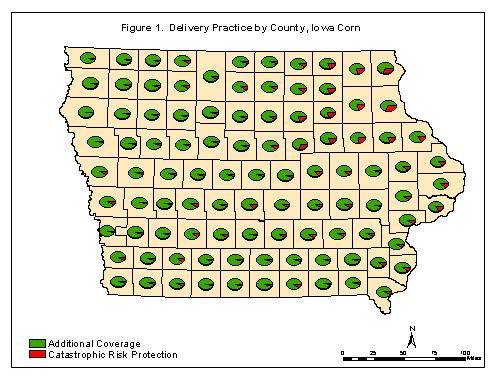
The first insurance characteristic that was mapped was insurance level. Figure 1 shows the relative number of policies sold by delivery type for Iowa corn. For the purposes of this paper, there are two coverage levels. First, catastrophic coverage (CAT) refers to policies with a 50 percent deductible that pays at the rate of 55 cents on the dollar once the deductible is satisfied. Farmers pay a $100 fee for CAT. The second level is called "additional" and refers to policies with deductibles of 15 to 50 percent. These policies usually pay 100 cents on the dollar once the deductible is met. Farmers pay a portion of the risk premium for additional-coverage policies.
As illustrated, additional coverage is the dominant delivery type. Catastrophic (CAT) risk protection rarely comprised more than 25 percent of the corn policies sold for any Iowa county.
CAT coverage appeared to be higher in counties where RMA has more high-rated land. If insured land falls within a high-rate area, the producer would be more likely to select CAT instead of additional coverage because the latter would have a higher premium.
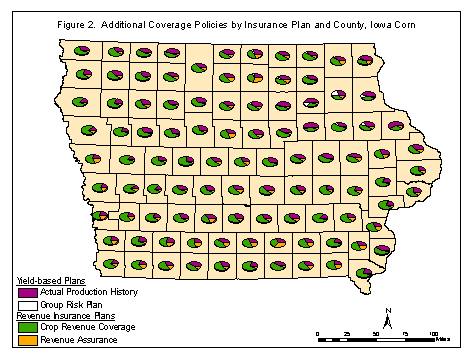
Figure 2 illustrates the relative percentage of additional coverage policies sold, by insurance plan, for Iowa corn. The yield-based plans available for this crop include APH and GRP. The two revenue-based plans include CRC and RA. APH and CRC are the dominant insurance plan policies sold at varying levels across the state of Iowa.
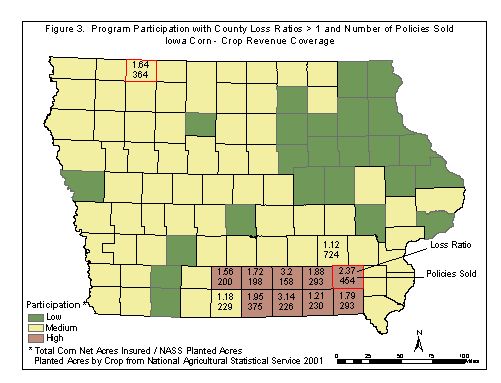
The fourth criterion in selecting the pilot counties was high participation rates. Figure 3 compares participation rates in Iowa counties where the loss ratio for corn CRC was greater than 100 percent and shows the number of CRC policies sold.
Dickinson and Jefferson counties are highlighted in red (Figure 3). In both counties, the primary insurance plan was CRC. Jefferson County had the highest loss ratio and number of policies sold for corn CRC, however, Dickinson County was also selected because it met the criteria and is geographically distinct from the other high loss ratio counties.
To analyze the loss ratio in Dickinson County, Iowa, CRC corn policies with loss ratios greater than 100 percent were mapped at the PLSS section-level with other geographic data, including: water bodies, populated places, and major roads. The 2-D representation showed where the losses occurred; however, viewing the same data in 3-D using ArcScene� provided the ability to overlay loss ratios with cause of loss and a definite pattern could be identified in the northern portion of Dickinson County (Figure 4).
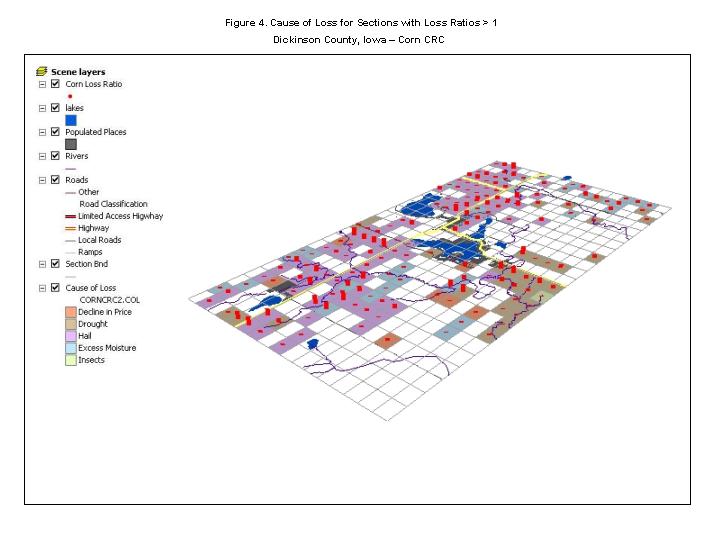
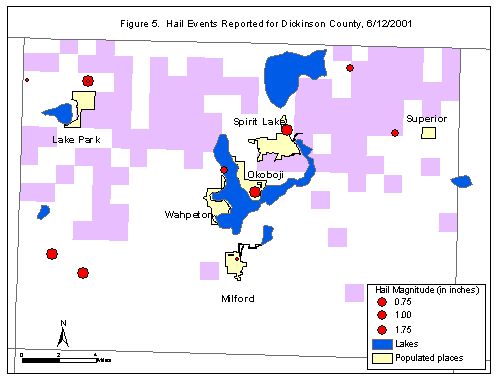
Dickinson County claims on corn CRC were primarily due to hail damage. In addition to hail, there were localized areas where excess moisture and drought were reported as the main cause of loss. APH soybeans losses exhibited the same loss patterns in this county.
A hailstorm was confirmed using information from the National Climatic Data Center (NCDC) Storm Events database, weather stations reported that thunderstorms, high winds and hail swept through Dickinson County on June 12, 2001 (Figure 5). The pattern identified using ArcScene� supported the west to east hail track across the county.
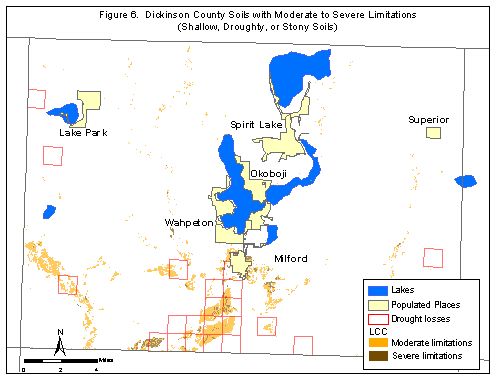
The other major cause of loss was drought. In Figure 4, policies that had drought losses occurred in the south central portion of the county. Figure 6 includes the Land Capability Class/Subclass (LCC) from the Iowa Soil Properties and Interpretations Database (ISPAID). The LCC indicates, in a general way, the suitability of soils for most kinds of field crops. Most of the locations where cause of loss was due to drought in Dickinson County also coincide with areas having moderate to severe limitations due to shallow, droughty, or stony soils.
In Jefferson County, the primary cause of loss on corn CRC policies was excess moisture. Figure 7 shows the range of loss ratios for Jefferson County, where the dark red indicates a loss ratio of 6.17 or higher. According to the NCDC Storms Event database, between two and five inches of rain changing to snow accumulated on March 15, 2001. On April 5, torrential rains fell, with amounts of up to three inches. The timing of these meteorological events indicate that indemnities were paid because producers were prevented from planting. In fact, 89 percent of the losses in Jefferson County were due to excess moisture which prevented producers from planting.
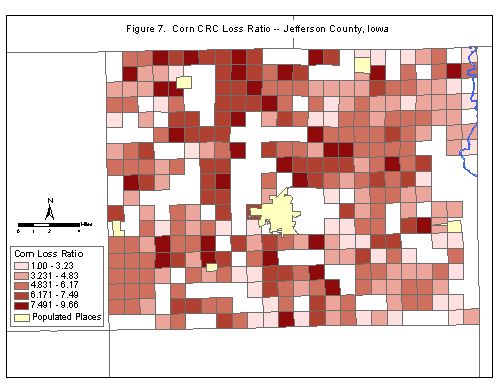
Figure 8 includes the LCC and areas with occasional, frequent or common flooding from the ISPAID. In Figure 8, the areas that experienced excess moisture were also areas where the soil is classified as having moderate to severe limitations due to water in or on the soil.
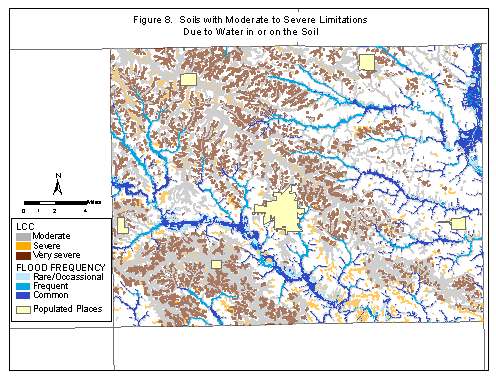
The excess moisture prevented planting losses in Jefferson County were likely compounded by soils with poor drainage characteristics. This analysis may warrant further investigation into the crop insurance experience in Jefferson and the surrounding counties. Analysis of historical losses and other agronomic factors, especially soil conditions, may support considering high-rate designation for some of this land.
RMA offers educational and outreach programs that target small and specialty-crop producers. RMA provides funds to private and public entities that offer risk management education
to agricultural producers.RMA performs civil rights reviews to determine overall compliance of the crop insurance industry with Title VI of the Civil Rights Act of 1964, which prohibits discrimination based on race, color or national origin in programs or activities in Federal programs.
The AGR program is an insurance program that was developed for producers whose income from agriculture is based on multiple specialty crops. The location and level of AGR program participation is of interest to outreach staff, who must determine where funding and educational extension should be focused. Figure 9 is a map that was produced for the Spokane, WA Regional Office to assist in targeting outreach services.
Initial mapping of underserved areas was based on comparing the number of insured farm operators to the total number of farm operators. Total number of policies sold[c] was compared to the number of farms operating in 1987 (Census 1990). Figures 10a and 10b illustrate this comparison for Georgia.
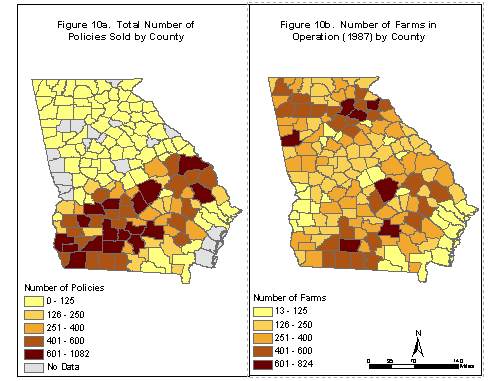
Based on the US Census data, the average number of farms in the three southeastern counties is 41.6, with an average number of acres farmed in each county of about 1,500, indicating that agricultural production is not significant in this region. There were not any policies reported in these three counties in 2001. On the other hand, in the northern part of Georgia there are several counties with a large number of farms, but with fewer than 125 insurance policies sold. These would appear to be underserved counties.
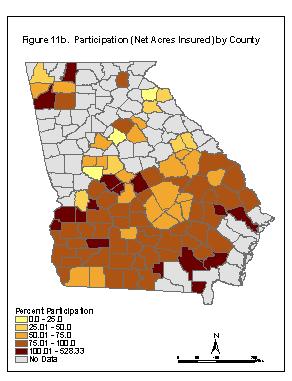
Another way to estimate crop insurance participation is to examine the percent of acreage insured rather than total number of policies in force. Figure 11 illustrates participation[d] based on RMA net acres insured compared to NASS reported planted acres. In this example, only the crops for which NASS reports acreage were included (corn, cotton, oats, peanuts, rye, grain, sorghum, soybeans, tobacco, and wheat). The areas in Figure 11 where no program participation is present, but insurance policies are in force, is likely a result of RMA insured crops not reported in NASS.
Figure 11 suggests that RMA is insuring large acreage farms based on the small number of policies in force (Figure 10a) in counties with high participation. In comparing figures 10a, 10b, and 11, RMA may be insuring a low percent of farms; however, these farms may represent a large percent of the planted acreage in the high participation counties. Depending on how underserved areas are defined, these counties may or may not be "underserved" by RMA. Using GIS allows RMA to map different characteristics (policies, farms, net acres) that help to identify potential underserved areas.
Minority producers are identified at the county level in the Natural Resources Inventory and Analysis Institute's (NRIAI) enumerations. NRIAI adapts US Census and Agriculture Census demographic data to the specifications needed for the Natural Resources Conservation Service (NRCS) Performance and Results Measuring System. The data includes farm acreage, and 1990, 1997, and estimated 2002 population by minority/gender group.
Figures 12a and 12b provide a comparison of the percent African American population in Georgia counties and the percent of agricultural producers that are African American (male/non-Hispanic). As indicated, the counties with a high percentage of African American producers are not necessarily the same as those where African American comprise a high percentage of the general population.

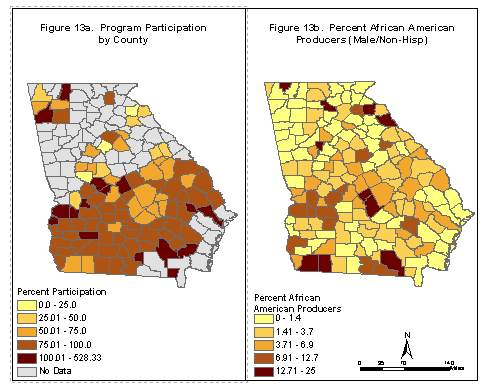
Areas that have a high percentage of minority producers and low participation are also of interest to Outreach and Civil Rights staffs. As discussed above, there are different ways of identifying participation, none of which is complete. However, comparing the location of minority producers to some measure of participation is useful in targeting risk management education to both underserved and minority populations. It may also serve as documentation in support of Civil Rights reviews of the reinsured companies.
Figures 13a and 13b provide a comparison of program participation (same as 11b) and minority producers. At first glance, it appears that many of the counties with a high percentage of African American producers have low participation rates. However, in the southern Georgia counties, where program participation is generally 50 percent or more, there are a handful of counties with a fairly high percentage of African American producers. Additionally, when considering total number of policies sold (Figures 10a and 11a) there is an indication of minimal program participation in counties with a high percentage of African American producers (Figure 12b). It is possible that African American producers may be engaged in specialty crop production. Judging from the differences in what crops were included when measuring the total number of policies sold, and participation.
RMA has developed a prototype GIS tool to help identify potential risk areas using environmental factors that affect crop insurance risk. The purpose of this tool is to help define risk areas based on those elements that determine actuarial soundness and to provide a mechanism for producing digital data for the RMA Actuarial Document System.
The prototype GIS tool was created using ArcGIS� 8 technology. The data layers that were included for analysis in this prototype are: elevation, slope, flood zones, and Soil Rating for Plant Growth (SRPG)1. The SRPG is a soil quality measurement that is derived from nearly 25 soil quality parameters in the Soil Survey Geographic (SSURGO) Database, including effective rooting depth and root zone water-holding capacity. The SRPG ranges from 0 to 100, with values >70 indicating high productivity for cropping, 50 to 70 indicating moderate productivity, 30-50 indicating marginal productivity, and <30 indicating soils that cannot sustain agriculture without large inputs of resources.
The custom tool provides a form for user-defined criteria (Figure 13). The user can select which layers to consider in the composite rating analysis. Minimum and maximum values for the underlying raster dataset are displayed to assist the user in determining appropriate values to enter in the selection process. Once values have been entered, the Visual Basic for Applications script generates a composite raster image of the grid cells that met the specified criteria.
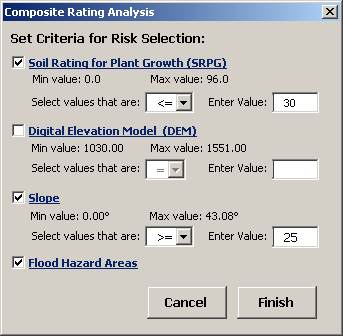
Figure 15 illustrates a composite image for Thurston County, Nebraska. The grid cell values indicate the number of criteria that were met for a given area. As illustrated, most of the result image has areas where only one or two criteria were met. In this case, areas west of the bluffs along the Missouri river are flood zones or have an SRPG less than 30. The areas where two criteria were met are primarily in the flood zone and have a low SRPG. There were also a few small areas where three criteria were met.
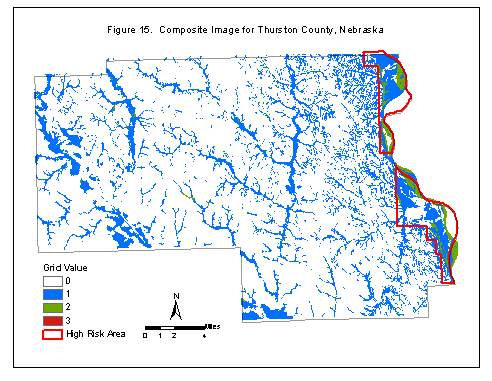
As shown in Figure 15, most of the current RMA risk area includes the land along the eastern portion of the county. However, during the annual update of risk map areas the RMA analyst could overlay the composite image with the Digital Ortho Quad and examine additional land for high-risk consideration in combination with actuarial experience.
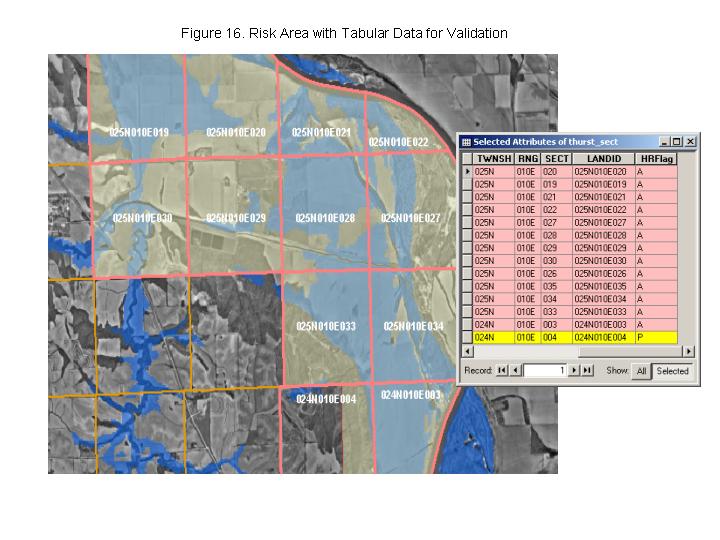
The RMA Actuarial Document System is availabe online and includes risk maps as scanned images. Using ArcGIS software will provide underwriters with the ability to create digital data that can be made available to RMA customers, as well as tabular data that can be used in policy processing systems for validation. Figure 16 provides an example of the Composite Rating Tool used to identify risk areas.
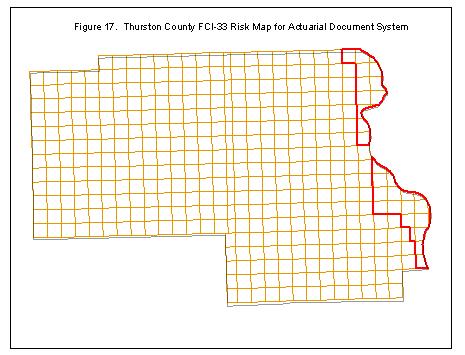
Once a digital map is created (Figure 17) it can be exported to an image format and published in the Actuarial Document System, or downloaded as a layer to be used in a GIS.
This paper described some of the GIS applications that might be integrated into RMA's business processes. By integrating RMA policy data with a GIS, RMA was able to identify and confirm environmental conditions that led to the primary causes of loss in Dickinson and Jefferson Counties in 2001. GIS tools could also enhance the ability of Civil Rights and Outreach staffs to carry out the mission of ensuring compliance with the Civil Rights Act and targeting RMA outreach services to underserved areas. Finally, GIS can also be used to evaluate the risk associated with agricultural production capabilities.
Based on this initial review, it is clear that GIS can serve as an important decision support and analytical tool. RMA has defined many application areas and is in the process of finalizing a GIS Business Plan that will prioritize application development, as well as ensure that the information technology infrastructure is in place to support the use of these applications.
1. Fithian, Wayne, Albert Peters, Andres Vi�a, Lei Ji, and Bill Waltman . Development of a Regionally Based Agronomic Decision Support System Based Upon Remotely Sensed and Ancillary Data. Submitted to NASA Commercial Remote Sensing Program Office, July 13, 2000.
[a] Indemnity
Paid/Premium Collected
[b] RMA Net Acres Insured by Crop / 2001 National Agricultural Statistics Service (NASS) Planted Acres by Crop
[c] NASS crop policies sold and non-NASS and specialty crops,
including: Apples, Blueberries, Cabbage, Canola,
Nursery (field grown & container), Onion, Peaches, Pecans,
Peppers, Potatoes, Sweet Corn, and Tomatoes
[d] RMA Net Insured Acres / NASS
Planted Acres (calculated only for
the crops that NASS reports
acreage, which includes: Corn, Cotton,
Oats, Peanuts, Rye, Grain Sorghum,
Soybeans, Tobacco, and Wheat)
Author Information:
Seavey Anthony, Program Automation Branch Chief, Risk Management Agency
Actuarial Program Automation Branch
Mailstop 08-11
6501 Beacon Drive
Kansas City, MO 64133
phone: 816-926-3865
fax: 816-926-1307
e-mail: Seavey.Anthony@rm.fcic.usda.gov