Mapping Post-Wildfire Burn Severity Using Remote Sensing and GIS
Annette Parsons, Andrew Orlemann
Salt Lake City, UT 84119
(801) 975 3750
ABSTRACT
The increased availability of Geographic Information Systems (GIS) and remote sensing technologies in the last decade has led to significant advances in the way the USDA Forest Service conducts its rapid mapping of areas burned by wildfire. The use of the two technologies in concert has revolutionized the way a Burned Area Emergency Response (BAER) team conducts its assessment and makes recommendations for post-fire treatments designed to minimize threats to life, property, and resources from flooding and erosion. On-site GIS and rapid delivery of remote sensing products have become invaluable tools in the BAER process. These tools save time and increase accuracy, leading to faster analyses and better recommendations.
Geographic Information Systems (GIS) have been in use by the USDA Forest Service to aid in land management planning and resource management for over a decade. The use of this technology by forest management personnel has increased dramatically since the Forest Service adopted ArcInfo, ArcView, and associated products in the early 1990s. Initially available only on high-end workstations, desktop GIS is now used by most Forest Service staff in their day-to-day jobs as an essential tool for forest and resource management. This paper will outline how Forest Service employees use this tool for emergency management of fires and for post-fire watershed assessments.
The current day Burned Area Emergency Response (BAER) program has its roots in the frequent fire regimes of the southern California ecosystems. Nearly 30 years ago, as developments began to encroach on fire and flood-prone areas, the conflict between scenic rural living and the forces of nature became apparent. The Forest Service did a reasonable job of suppressing wildfires and protecting homes in these areas, but what about the floods, mudslides, and debris flows that too often followed? Commonly, media and managers focused on the risks from the wildfire itself, but neglected the risk of an equally deadly and devastating flood the first few storm seasons following a fire.
Beginning in the 1970s, the Forest Service began a process of deploying a team of water and soil management specialists to conduct an emergency assessment of burned watersheds. The assessment identified the effects of the fire on the watershed and soil function to determine flood and erosion potential, and identify values at risk. These included values such as human life, health and safety, property, infrastructure, long-term soil productivity, and natural resources (Figure 1).
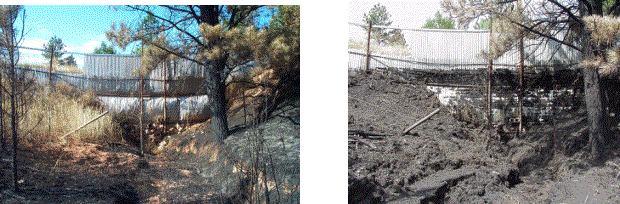
Figure 1. Homes, bridges, roads constructed in flow paths may be at much greater risk of damage from flooding and debris flow following a wildfire in the contributing watershed, depending on the degree of burn severity. Both are post-fire photos. Photo on left is pre-storm; photo on right is post-storm. Ash line shows water level nearly overtopped fill bridge and blocked access to private residence.
Today the issue has become even more acute, as increasing population pressure encourages development of the “wildland-urban interface” - that area where human habitations are constructed within and surrounded by fire-prone ecosystems. This, together with the increased density of wildland fuels due to nearly 80 years of effective fire suppression has set the stage for larger areas of high severity burns. Potential risks to human health, safety, and resources from post-fire flooding, erosion, debris flows and mudslides never been greater. Also, today the BAER evaluation has been expanded to include assessment of threats to cultural resources, long-term ecosystem health and to threatened and endangered species. In addition to the soil scientists and hydrologists, a BAER team may now be composed of wildlife biologists, range specialists, cultural resource specialists, recreation specialists, engineers, geologists, and others, depending on the resources and issues at the specific location.
If a potential emergency situation is found, then the team determines if there are emergency treatment measures that can be implemented prior to the first damaging storms to help minimize the threats. Such treatments can include seeding of slopes to encourage rapid revegetation, installation of erosion barriers and runoff control structures on slopes or in channels, installation of larger culverts, and development of emergency storm alert and evacuation procedures in the case of a sudden intense storm. While these measures can be helpful in reducing threats following a wildfire, especially if post-fire winters are gentle, it is important to recognize that fire, erosion and flooding are natural processes, and that no amount of treatment can stop them, particularly if the winters following the fire are severe. Some risks can only be fully mitigated by early warning and evacuation.
As soon as a wildfire involving National Forest lands exceeds 300 acres, the BAER process is triggered. A team is assembled quickly - often while the fire is still burning - because it must complete its assessment and make treatment recommendations within seven days of fire containment. The BAER team begins to cover the ground in cooler areas, even as suppression occurs in active fire areas.
The key element in the burned area assessment is a map of “burn severity” - a map of the degree of change to the watershed and soil function caused by the fire. This is not the same as a map of “fire intensity” (Key, 2001). While there is a relationship between fire intensity and burn severity, the correlation is not direct. Fire intensity is an expression of fire behavior and indicated by flame length, rate of spread, hear per unit area. Burn severity is an expression of the effects of the fire and is indicated by changes in soil characteristics that affect runoff and revegetation. The length of time heat is in contact with the soil (fire residence time) rather than fire intensity itself is the key factor in the resulting burn severity. For this reason, image classification alone does not accurately classify burn severity for BAER analyses, but must be combined with other spatial data such as pre-fire vegetation, slope, or aspect.
The burn severity map must be produced within a few days, whether the fire has burned 1000 acres or 50,000 acres, and all team members need the map to help them focus their field time (Figure 2). Traditionally, this has been a “quick and dirty” map of large, imprecise polygons hand-drawn on a topographic base map while flying over the burn in a helicopter. Aerial observations are supplemented with a cursory drive-through of the burned area.
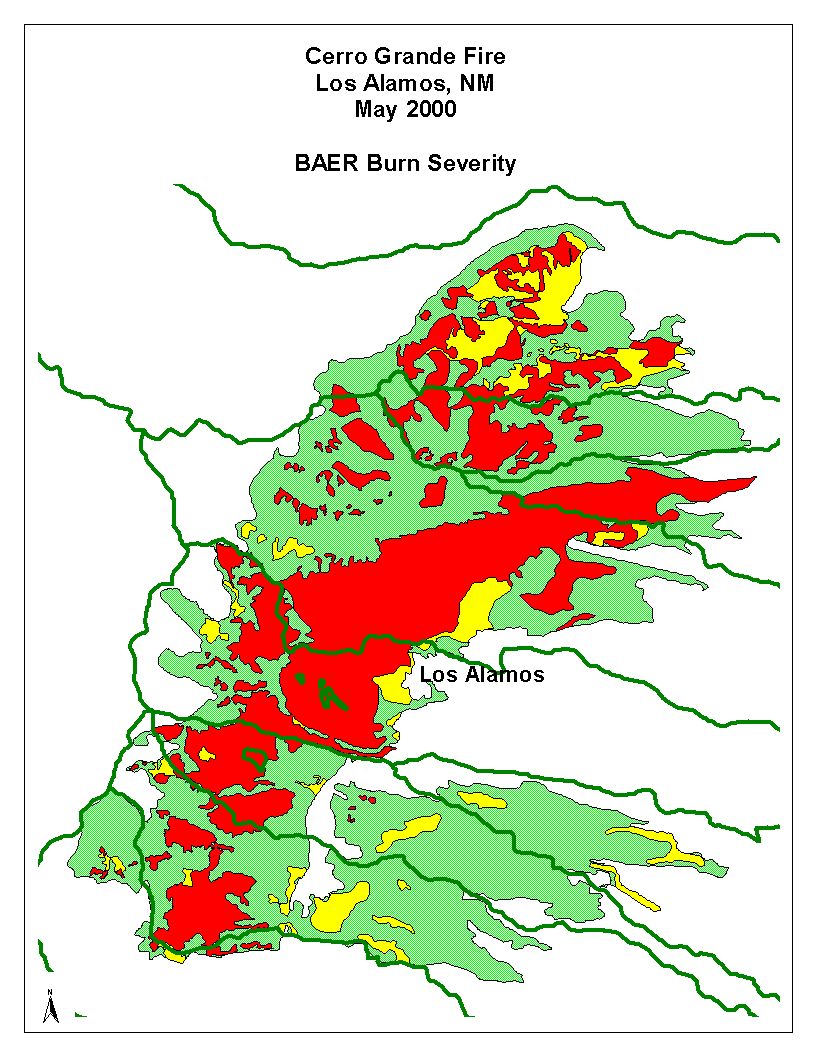 |
Figure 2. The BAER burn severity map is the key element in the post-fire rapid assessment process.
Today, with the help of remote sensing and GIS, we are often able to produce a more accurate map more quickly. In 1996, Region 5 (California) of the Forest Service cooperated with the USDA Forest Service Remote Sensing Applications Center (RSAC) in Salt Lake City to test the feasibility of high resolution digital color infra-red imagery acquired via fixed-wing aircraft for use in BAER burn severity mapping. The imagery proved invaluable to the BAER team because it provided an immediate post-fire image of the entire burned area (Lachowski et al. 1997). Using the image as a backdrop, auxiliary layers from a GIS were overlaid to determine fire effects to a given resource.
While the rapid availability of fixed-wing post-fire digital imagery is a huge improvement, it is very expensive and may have a number of other drawbacks. For example, sometimes the imagery is late and is not delivered until after the BAER team has completed its inventory the old-fashioned way. In addition, the level of detail and signature variation has not been shown to lend itself to a rapid classification of watershed burn severity. It has proved too variable and too detailed for reasonable use in rapid automated image classification schemes, and has typically been used simply as a basis for hard copy sketch mapping followed by digitizing of the polygons for the GIS analysis. Also, BAER teams on the ground are often working in a fire camp or other remote setting, and may not have access to high-end hardware and software or high-speed internet connections. What is needed is a product that can be used by resource staff who may or may not have high-level GIS or image processing skills, and that can be used on a laptop in a rural setting.
To try to better meet this need, RSAC has worked to develop better and faster ways to provide remote sensing products to BAER teams, and to expedite runoff and erosion analyses using the derived burn severity map in a GIS. We have learned that the moderate resolution satellite image products (Landsat and SPOT) seem to provide the optimum balance of level of detail, cost, file size and usability, and image classification possibilities.
RSAC BAER support staff track wildfires and satellites daily. As soon as a request for imagery is received from a BAER team leader, the staff determines which satellite is most likely to acquire a useable image and the order is placed. Because of variations in satellite revisit intervals, smoke, and clouds, the platform chosen will vary from the Landsat series to the SPOT series. Landsat is often the sensor of choice due to the availability of two mid-IR bands, which have been shown to be more sensitive to fire-caused changes in soil condition than any of the visible or near-IR bands (Key and Benson 1999). With a revisit interval of 16 days, however, we may not always be able to meet a team’s time frame with Landsat alone, and the SPOT satellites provide a viable alternative.
As soon as an image is available, RSAC processes it using ERDAS Imagine, then subsets the burned area. We then run a series of simple image classification steps (indexes). This series of steps has been developed over the past year, and we are continuing to refine and improve the process. The process is based on research done by Carl Key (2001) and others in mapping of areas burned by wildfire using Landsat TM scenes, but has been simplified to allow rapid processing and delivery to the field (Figure 3).
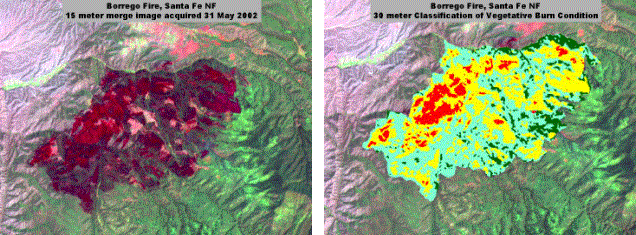 |
Figure 3. Using remotely sensed image products a preliminary burn severity map can be produced within a few hours of image acquisition.
The resulting classified images are recoded into four classes of burn severity: Unburned, Low, Moderate, and High. The final step is to overlay vegetation information for the area and apply a set of rules to assign burn severity classes according to the pre-fire vegetation type. For example, if the classification calls an area “High”, but the pre-fire vegetation type was grassland, then the pixels are reassigned a class of “Low”. This is because burned grasslands appear very black, and spectral reflectance values result in the high burn severity classification, but the soil and ecosystem effects caused by the fire are minimal due to fine, flashy fuels and short fire residence time. Similarly, burned shrub lands often classify as “High” severity based on spectral reflectance values, but in reality high burn severity is the exception rather than the rule in chaparral and shrub vegetation types. The vegetation filter will recode these areas to “Moderate”.
In this manner, within an hour or two of receiving the image, a preliminary burn severity map can be developed for the BAER team that, in many cases, can help them focus field efforts. The image and derived product is posted to our file transfer protocol (ftp) site for downloading by BAER team GIS staff. Field visits and helicopter reconnaissance flights by BAER team watershed scientists allow them an opportunity to make revisions as needed due to local conditions. Some of these local variations can be modeled using GIS. For example, steep inner gorges and south slopes in southern California’s chaparral ecosystems often support sparse vegetation, thus fuels are lighter than on gentler slopes or north aspects. Using Digital Elevation Models (DEMs), these areas can be identified and the image-derived burn severity map refined accordingly.
There are situations when this rapid image classification method does not work well, and local variations in vegetation, geology, or other factors can cause signature variation not accounted for by the RSAC BAER burn severity classification process. In these cases, the team still finds the image useful for sketch mapping during field and aerial reconnaissance. The team’s GIS analyst can then edit and revise (or capture) the map to develop the final map used in the team’s rapid assessment.
Once the burn severity map has been developed, verified, and finalized it becomes an important input parameter to both erosion and runoff models. Because the degree of burn severity reflects the amount of soil cover and the infiltration capacity of the soil, the burn severity map is used to develop these parameters in the erosion and runoff models. The amount of soil cover is the key factor in susceptibility of soil to erosion by wind and water following a fire. Other fire-induced changes in the soil such as loss of soil structure and development of a water repellant surface also significantly impact the susceptibility to erosion and runoff. The burn severity map is the key to identifying where these conditions occur.
BAER team soil scientists and hydrologists must model potential post-fire erosion and runoff so they can assess the potential for impacts to downstream values at risk. If a house is constructed in a drainage where watershed vegetation was burned in a wildfire, the degree of burn severity is directly proportional to the potential for increased post fire flooding, erosion, and sedimentation (Figure 4). The greater the severity of the effects, the greater the increase in runoff and erosion from the watershed. A small drainage ditch that has handled runoff from a vegetated watershed just fine over the past 20 years may well be overwhelmed if an intense storm occurs during the first winter or two following a fire, before vegetation recovery has begun.
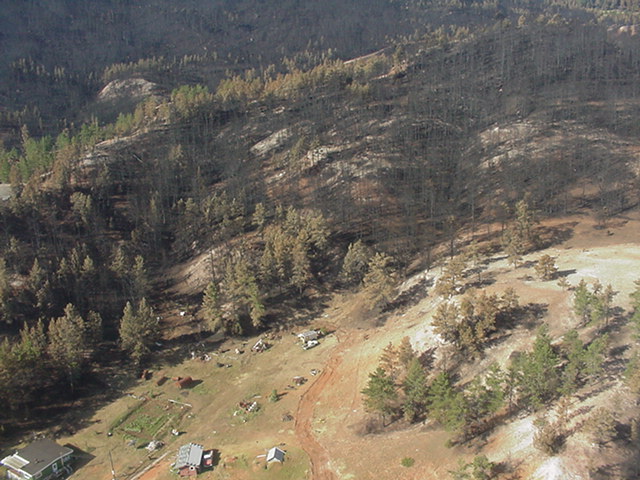 |
Figure 4. Homes situated in drainage paths of burned watersheds may be at risk from flooding and debris flows.
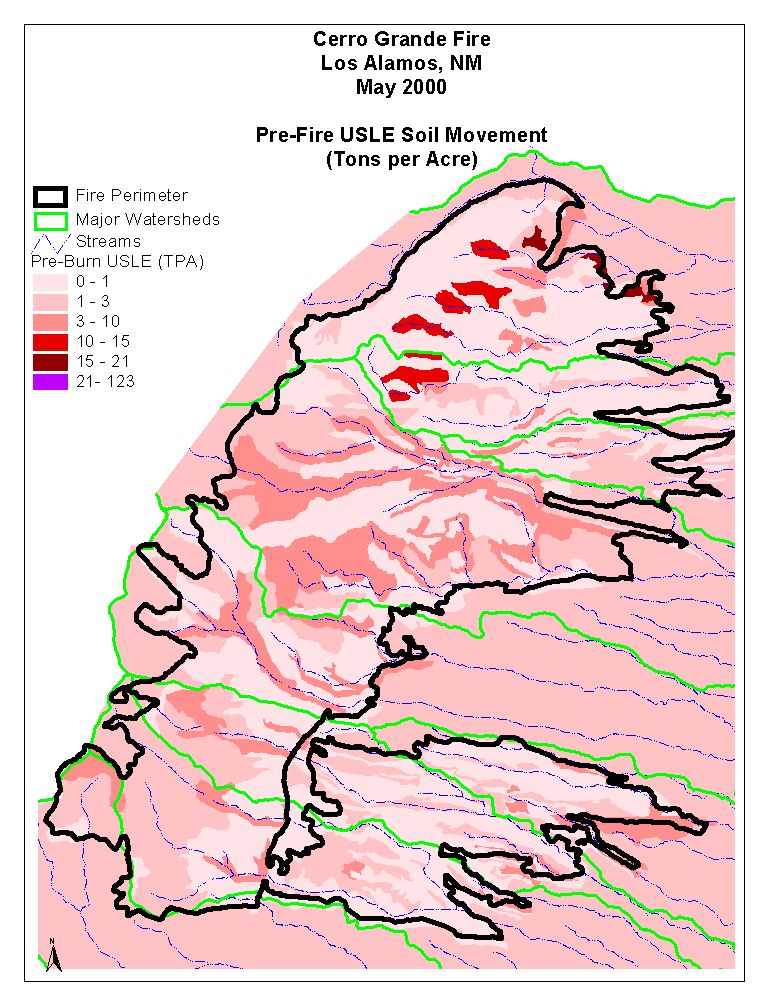
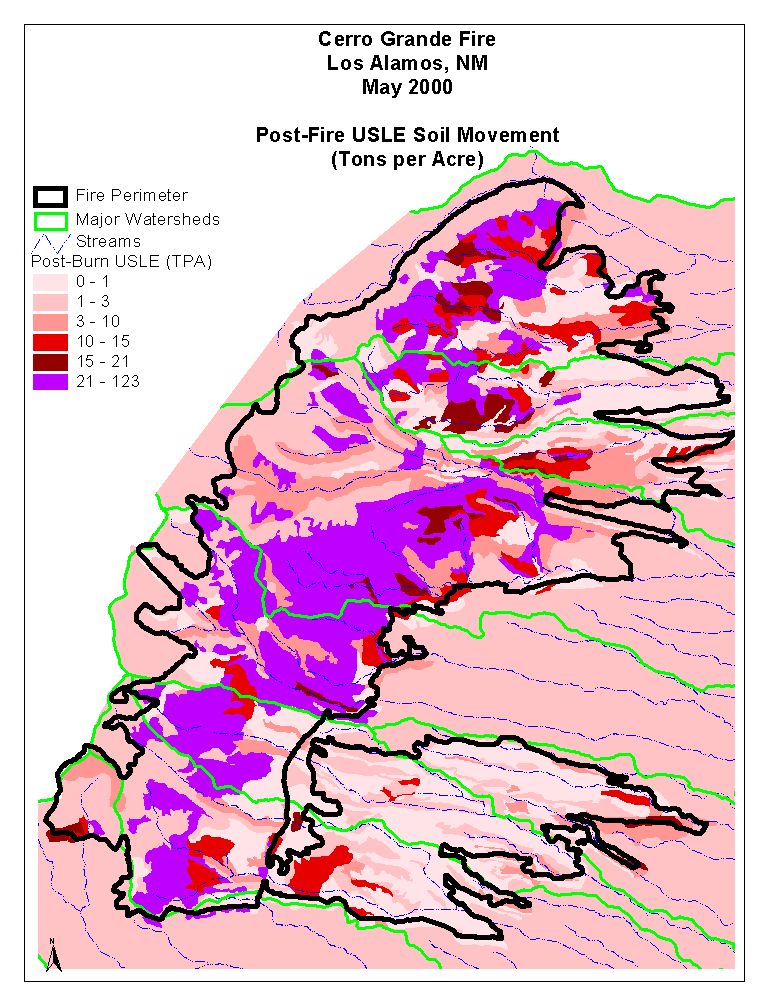
A prime example of this is the 18-inch culvert that has been in place under a 130-foot high road fill crossing of a perennial canyon in New Mexico. This small pipe has worked fine since it was installed in the 1950s, with its forested watershed intact. But the Cerro Grande Fire near Los Alamos severely burned nearly the entire watershed. During a short but intense storm following the fire, runoff exceeded pre-fire levels by two orders of magnitude, and water backed up 50 feet deep (Kuyumjian 2002). The integrity of the fill material was threatened, and access to one of the most populated areas of Los Alamos could have been cut off if failure had occurred.
Various models are used for predicting post-fire erosion and runoff. Most are not inherently spatial models, but by using GIS to overlay the spatial layers containing the input parameters, these models can be run and displayed spatially. An example of a soil erosion model is the Universal Soil Loss Equation (and its variations), A = RKLSC where:
A = predicted erosion in tons/acre/year
R = rainfall erosivity factor (varies geographically and is a function of the
2-yr 6-hr storm rainfall amount in inches)
K = soil K-factor (a measure of inherent erodibility)
LS = topographic factor (slope length and gradient)
C = cover factor (based on amount and type of cover, fine roots, and other factors)
The rainfall factor is derived from tables and maps based on geographic and topographic location. Spatial data for rainfall amount and intensity may or may not be readily available. The National Oceanic and Atmospheric Administration, the National Weather Service, and the United States Geological Survey are common sources of these data, and with each passing year more and more data become available in spatial format. Soil K-factor must be obtained from a local soil survey. A GIS layer of soils should contain this information, along with soil texture and rock content, required inputs to other erosion models. Slope length is more difficult. It may be available in the soil survey, but if not, it must be interpreted for each soil map unit by a soil scientist familiar with the local landscape. Slope gradient is readily available using slope layers derived from DEMs. The cover factor is determined by overlaying pre-fire vegetation with the burn severity map. It is then adjusted accordingly, based on burn severity class and knowledge of the local ecosystems.
Once all the necessary input parameters are appropriately developed and linked to spatial data, the analyst can perform a series of overlays. The user can work with vector or raster data according to preference, data complexity, and available software. We have used ArcInfo, Grid, ArcView, Spatial Analyst, and ArcMap in various combinations with good results. Attribute items are created in the polygon (or grid) attribute table for pre-fire and post-fire erosion values, and the map algebra is conducted either in the grid combination process or in the polygon attribute table. We prefer to do the algebra right in the attribute table, and retain all input attributes in the table for later analyses and for evaluation of results.
Other information needed for the BAER analysis includes potential erosion and runoff by watershed, and acres of burn severity class by land ownership. Watershed boundaries and land ownership become additional inputs in the spatial overlay process. Using GIS we can derive the needed information quickly. Additional information readily determined using GIS includes acres and location of burn severity classes in critical wildlife habitat areas, wilderness, and municipal water supply source areas.
Once we have completed all spatial overlays, we end up with one grid, or one polygon layer that contains attributes for watershed name, ownership, soil type, slope, pre-fire vegetation, burn severity, and predicted pre-fire and post-fire soil loss. This allows comparison of pre-fire and post-fire conditions in map displays and spreadsheets, as well as a visual display of burned areas of primary concern (Figure 5).
 |
 |
||
Figure 5. GIS provides visual comparison of pre-fire and post-fire condition and location of problem areas.
Similar processes can be conducted to model predicted post-fire runoff, since runoff models use input parameters of slope gradient, soil permeability, surface roughness, as well as amount, form, and intensity of precipitation. Another important watershed parameter in runoff models is the “time of concentration”. This relates to the size, shape, steepness, and permeability of a watershed, and can be created using watershed boundaries, DEM-derived slope, and soil infiltration parameters from the soils layer. Raster data models work well for these types of analyses.
The choice of model is up to the soil scientist or hydrologist running the model. Some erosion and runoff models work well in some areas but not in others. Some areas have research that allows the development of local models. As with any modeling process, the output is only as good as the input, and the ready availability of good quality spatial data for input parameters varies greatly. But if good, local spatial data are available, GIS can be a valuable aid to BAER team members in determination of emergency conditions and siting of appropriate treatment measures to reduce threats to values at risk.
The USDA Forest Service BAER program attempts to protect life, health and safety, property, infrastructure, long-term soil productivity, and natural resources through the mapping of post-fire burn severity and the implementation of treatments to reduce erosion and flooding. While the program has been in place for several decades, remote sensing and GIS technologies have only recently begun to play a critical role in the process. Rapidly delivered remote sensing images are now frequently used to develop initial burn severity maps which allow BAER teams to focus their field work on the most severely burned areas. GIS is then used in conjunction with these maps in spatial overlay operations to turn non-spatial erosion and runoff models into spatial displays and reports. The information derived from this combination of technologies allows BAER teams to more quickly and accurately locate severely burned areas and develop suitable treatment prescriptions.
REFERENCES
Bobbe T., Finco, M., Maus, P., Orlemann, A. (2001). Remote Sensing Tools for Burned Area Emergency Rehabilitation (BAER). RSAC Remote Sensing Tips.
Key, C. (2001). Landscape assessment sampling methods, FIREMON Draft v1.0. http://fire.org/firemon/lc.htm
Key, C. and N.C. Benson. (2001). The normalized burn ratio, a Landsat TM radiometric index of burn severity incorporating multi-temporal differencing. Unpublished manuscript.
Kuyumjian, Greg. (2002). USDA Forest Service, Santa Fe National Forest, Los Alamos, NM. pers. comm.
Lachowski, H., P. Hardwick, R. Griffith, A. Parsons, and R. Warbington. (1997). Faster, better data for burned watersheds needing emergency rehab. Journal of Forestry, 95(6):4-8.
Orlemann, A., M. Saurer, A.Parsons, and B. Jarvis. (2002). Rapid delivery of satellite imagery for burned area emergency response (BAER). Proceedings, Remote Sensing 2002 conference, San Diego, CA April 8-12, 2002. USFS RSAC
USFS BAER Web site: http://fsweb.gsc.wo.fs.fed/baer
RSAC Web site: http://rsac.gsc.wo.fs.fed.us