Marcelo Reginato and Thomas Piechota
The U.S. Environmental Protection Agency (EPA) requires every state to develop a Source Water Assessment Program (SWAP) that evaluates the vulnerability of drinking water intakes. The first step in the SWAP is the delineation of source water protection zones. Within the source water protection zones, a database of potential contaminants that could impact the drinking water intake is created, and the likelihood of the contaminant reaching the intake is assessed. ArcView and ArcGIS are used in this study to delineate the source water protection zones within the Las Vegas Valley, identify the proximity of potential contaminants to the drinking water intake, manage GPS field data, and investigate the land uses within the source water protection zones.
Figure 1: An overview of the Las Vegas Valley watershed, subwatershed boundaries, and the proximity to Lake Mead and the drinking water intake point. The subwatersheds are the following: C1 (C1 Channel), PIT (Pittman Wash), DUC (Duck Creek), FLA (Flamingo/Tropicana Wash), LOW (Lower Las Vegas Wash), CEN (Central Basin), GOW (Gowan Basin), RAN (Range Wash), and NOR (North Basin).
The 1996 amendment to the Safe Drinking Water Act of 1976 created the Source Water Assessment Program (SWAP) where one of the objectives was to evaluate the potential sources of contamination to a drinking water intake. As part of the SWAP, every state is required to assess the vulnerability of their source waters to surface and subsurface contamination. Source water is known as all the water resources in a system that can be converted to drinking water, including surface and groundwater (EPA, 2002). The components required in the SWAP for each state are (EPA, 1997a):
There are several methods for determining source water protection areas. It is logical to use information such as watershed topography, likelihood of pollutants entering water bodies, and time of travel for pollutants to reach the source water. This paper will focus on how GIS was used in the delineation of source water protection areas, and in the identification of point contamination and land uses within Las Vegas Valley source water protection zones.
The Las Vegas Valley watershed is located in Clark County, Nevada and ranges in elevation from approximately 1,500 feet to over 12,000 feet (WRCC, 2002). To the west, the Valley is bordered by the West Spring Mountains, which are approximately 12,000 feet, and to the north by the Ground Gunnery Range, which are approximately 7,000 feet. The watershed area is approximately 1,520 square miles; its washes and stormwater channels drain first to the Las Vegas Wash and then to Lake Mead (Figure 1). Most of the storm drains and channels within the valley are either, dry or do not have significant flow; however, some washes that used to be ephemeral streams now have perennial flows. One of primary sources for these perennial flows appears to be overirrigation of ornamental landscaping and turf (Mizell and French, 1995).
In 1999, the State of Nevada prepared a document that outlined the proposed SWAP for all surface and groundwater intakes in the State. In the program, which was approved by EPA, the State chose first to identify the watershed upstream from the intake points, and then segment the watershed into two protection zones, A and B. The state set minimum sizes and lengths for both protection zones; however, the sizes and length can differ depending on watershed characteristics. Zone A is a minimum buffer zone of 500 feet from reservoir, lake, river, and stream shores; the zone extends to a minimum distance of 10 miles upstream from the drinking water intake or the state boundary. Within Zone A, potential point contaminants to the water system will be inventoried (BHPS, 1999). Zone B extends an additional 3000 feet from the boundaries of Zone A, and it contains available land use or zoning information (BHPS, 1999).
The EPA report "State Methods for Delineating Source Water Protection Areas for Surface Water Supplied Sources of Drinking Water" (EPA, 1997b) summarizes the methods used to delineate source water protection areas. The main methods are the following:
Figure 2 illustrates these three methods. In the topographic method, all the area that contributes to the intake point is considered the source water protection area. The method is conservative and identifies the entire watershed as potentially impacting the surface water intake point (EPA, 1997b).
Setbacks/Buffers Zones are usually regions meant to filter overland flow and to reduce adverse impacts of stormwater runoff to water bodies (EPA, 1997b). Setting buffer zones around water bodies is the most common way to prevent a major surface water contamination; however, uncertainties about its size and efficiency exist. Castelle et al. (1994) state that buffer sizes are usually established by political acceptability and not by scientific data. In the same article, the author also developed four criteria to determine the adequate buffer size for water bodies.
Figure 2: Conceptual model of the three different approaches to define source water protection zones extents. These include watershed boundaries, buffer zones, and time of travel.
Castelle et al. (1994) discussed the size of vegetated buffers, and the
sediment, nutrient, and heavy metal removal capacity. It was noted that
is difficult to implement vegetated buffer zones in urban areas due to
land constraints. Despite this problem, the criteria are useful to determine
buffer importance. Castelle et al. (1994) also recommends a minimum value
of 15 to 30 meters (49 to 98 feet) to protect wetlands and streams from
runoff pollutants.
Time of travel (TOT) of pollutants is another method to define protection
areas. The method is based on the time it takes the pollutant traveling
through the stream to reach the intake point (EPA, 1997b). The method is
useful for emergency response activities, like an oil spill in a water body.
In additions to the three methods (Topographic, Buffer, and TOT), EPA
also suggests modeling as a way to enhance the efficiency of delineating
source water protection areas. Models can be used to assess the different
impacts of different land management strategies, can quantify nonpoint
sources, can evaluate different urban runoff scenarios, and can assess
the different impacts of various point and nonpoint sources releases (EPA,
1997a).
The watershed data for the Las Vegas Valley was obtained from the Clark
County GIS Management Office (GISMO) which is responsible for maintaining
the GIS data for all communities in Clark County. The data utilized
in this study include storm channels, watershed boundary, and land use.
In addition, field data was obtained on the extent of dry weather flows
and potential sources of contamination.
The "Regional Flood Control District Facilities" shapefile from GISMO has all stormwater drains and detention basins plus the current status as constructed, under construction, or under the ten-year planning horizon. Moreover, the shapefile also gives information about the channel characteristic (e.g. concrete, rip rap, earth, grass, natural). This information is used to determine the flows paths through the urban areas of the Las Vegas Valley.
The watershed boundaries were available from the GISMO and the U.S Geological
Survey (USGS). The USGS watershed boundary does not have the subwatersheds
delineated, so the watershed boundary and subwatersheds available in GISMO
were utilized for this study. The watershed shown in GISMO is slightly
different than the USGS watershed boundary, mainly in the north part of
the basin. However, this difference does not effect the SWAP delineation
of protection areas.
The land use data was compiled with GIS tools, by linking tables and using Structured Query Language (SQL) queries. The Clark County Assessors Office maintains an updated parcel database including land use information. This database is in a Dbase format, and it is not geographically referenced. The parcel data available in GISMO supplies the parcels shapefiles with only parcel numbers. Thus, the common field between both data sets (land use table and parcel shapefile) is the parcel number. Linking the Clark County Assessors Office table with the GISMO parcel shapefiles, results in a map showing the land uses for each parcel. The steps to accomplish this task are described in the flowchart shown in Figure 3.
The Clark County parcels are divided into books and book sections, each book has 36 sections, and each section is an ArcView shapefile. Thus, the first step was to open all shapefiles. Parcels were grouped into each one of the nine subwatersheds (Figure 1) due to the large amount of data. After opening all shapefiles from each subwatershed, the next step was to join and to clip the parcels within the subwatershed boundaries. Then the Assessors Office land use table was linked with the shapefiles attribute table. This provides land use information to each parcel. The Assessors Office provides 70 subclasses of land use for each parcel, therefore, it was necessary to the land use. A general land use code was generated by grouping the original Clark County Assessors Office data into seven land use categories shown in Table 1.
Table 1: Land use areas and percentages for the Las Vegas Valley watershed.
Land use profiles were also identified for each one of the nine subwatersheds (Table 2). The subwatersheds Range Wash, Flamingo/Tropicana, Duck Creek, Pittman Wash, and C-1 Channel are very similar in land use percentages. The North Las Vegas subwatershed has the greatest percentage of undeveloped area, and the subwatersheds Central, Lower Las Vegas, and Gowan are the most developed areas.
Figure 3: Flowchart that illustrates the compilation of the Clark County
Assessors land use data.
Table 2: Land use percentages for each subwatershed in the Las Vegas Valley watershed.
Different states have chosen different approaches to delineate source water protection zones for the SWAP; however all states have to follow an EPA guidance (EPA, 1997a). A common protection zone delineation outlined by EPA is to make the protection zones at least 200 feet wide around water bodies, and for it to extent at least 10 miles upstream from intake points. As noted earlier, Zone A is 500 ft zone around water bodies and Zone B is a 3000 ft zone from the boundaries of Zone A. The minimum extent of the protection zones is 10 miles from the intake
In addition to the three methods suggested by EPA for delineating the source water protection zones, the extent of dry weather flows is another approach for identifying the boundary of the source water protection zone. The presence of water in the channels is essential for a pollutant to travel downstream from the source of contamination until the drinking water intake; therefore, delineation of source water protection zones could be to the extent of dry weather flows in channels.
For the Las Vegas Valley drinking water intake, the 10 miles upstream
into the Las Vegas Valley is at at the location of Lake Las Vegas (see
Figure 4). This distance does not extend into urban areas of Las Vegas;
therefore, the protection zone were extended to the limits of the dry weather
flows. Following this criteria, the protection zone reached developed parts
of the Las Vegas Valley, where all possible water contaminants are located.
Figure 4: Limits of source water protection zone if the "minimum 10 miles upstream from intake" criteria is used in the SWAP.
Figure 5: Source water protection areas for the Las Vegas Valley watershed based on the extent of dry weather flows. Zone A is a 500 foot buffer and Zone B is a 3000 foot buffer from Zone A.
According to Nevada's SWAP, all possible contaminants within Zone A should be inventoried for future risk analysis and susceptibility of source water contamination (BHPS, 1999). Field work was conducted within Zone A to identify possible sources of contaminants. The same GPS Unit Trimble Geoexplorer 3, used to collect information about channels, was used to store the contaminant data within the protection zones. This data includes the survey date, facility description, contaminant code, facility address, picture, and geographic coordinates. After obtaining the data with the GPS, it was downloaded to a computer, the differential correction was executed, pictures were transfer to the computer, and the Dbase tables and shapefiles containing the field points were created. An ArcView project was created linking the contaminant location database with the field pictures using the "hotlink" feature in ArcView. The user can select a field point and a picture for that point will open.
The results for field identification, and field location of possible
contaminants within protection areas are shown in Figure 6 and Table 3,
which shows the number of contaminants identified in the field as well as
the respective contaminant code and category. The most common sources of
contaminants found were, medical institutions, auto repair shops, and gas
stations.
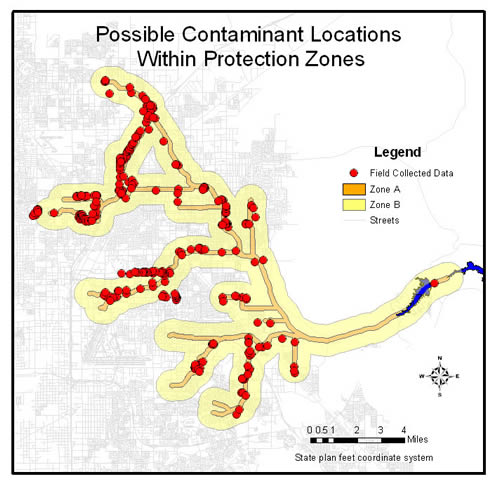
Figure 6: Sources of potential contamination with source water protection
Zone A. All points are based on field surveys.
Table 3: Result of field surveys showing the number of different contaminants identified within source water protection Zone A.
Nevada's SWAP also requires the identification of land uses within the
boundaries of protection Zones A and B. The land use data from 2001 was
compiled within the boundaries. The criteria used to obtain land uses within
the protection zones was that if any part of a parcel was within the buffer,
the whole parcel area was taken into account. Therefore, boundary parcels
have some area outside the protection Zone B. Figure 7 shows a typical
example of this parcel offset.
Figure 7: Example of parcels that are on the boundary of source water protection Zone B. Gray areas are the portion of the parcels on the boundary of Zone B that are outside the source water protection area.
Table 4 presents the percentages of each land use within the protection zones and Figure 8 shows the spatial distribution of the land use map within Zones A and B. It is not too surprising to see that much of the land use within the protection zones is undeveloped considering that 83% of the watershed is undeveloped. Residential (22.8%) and highways (13.3%) are also a large portion of the land use within the Zones A and B. This suggest that any control of pollutants from these areas will have a high impact on the protection of the drinking water intake.
Table 4: Percentages of land uses within the source water protection Zones A and B.
Figure 8: Land uses within source water protection Zones A and B.
The study presented here illustrates how GIS can assist in developing a Source Water Assessment Program (SWAP) for a surface water drinking water intake. GIS was useful for several key tasks as noted below.
Management of large data sets: GIS proved to be efficient in managing large amounts of data such as the Clark County Assessors Office database and GISMO parcels; however, the land use vector data had to be divided into the different subwatersheds to optimize computer processing time. After the land uses were converted to a grid with a 30 x 30 meter resolution it was possible to group all the data into one file.
Designating source water protection areas: The source water protection areas were defined based on the extent of dry weather flows, and then a ArcView Script was used to select channels downstream from the extent of dry weather flows. This creates a protection zone extent shapefile. The ArcMap Geo Processing Wizard was then used to delineate the protection zones based on the protection zone extent shapfile. Other GIS tools such as SQL were also useful to identify land uses within the protection zones.
Compilation of field data: The two sets of data collected in the field, extent of dry weather flows and contaminant inventory, were exported to GIS so the data could be plotted with other GIS features. Photographs of the points were also linked to the map by the hotlink tool. The linking of these photographs will be useful for future field work.
Future analysis will include the verification of the extent of dry weather flows, reevaluation of potential contaminant sources within the source water protection area, risks associated with each potential contaminant source reaching the drinking water intake, and the identification of the overall susceptibility of the drinking water intake.
This work is supported under research contracts with the Nevada Division
of Environmental Protection, State of Nevada Bureau of Health Protection
Services, and the University of Nevada, Las Vegas. The authors would like
to thank the Clark County GIS Management Office and Clark County Assessors
Office for assistance in obtaining electronic data.
Castelle, A.J, Johnson, A.W., and C. Conolly, 1994. Wetland and stream buffer size requirements - a review. Journal of Environmental Quality , 23 (5), 878-882.
Griner, A.J., 1993. Development of a water supply protection model in a GIS. Water Resources Bulletin, 29 (6) 965-971.
Geographic Information Systems Management Office (GISMO). Retrieved from the Word Wide Web: http://www.co.clark.nv.us/ceit/gismo/gismo.htm
Nevada State Health Division, Bureau of Health Protection Services (BHPS), 1999 State of Nevada Source Water Assessment Program (SWAP).
Mizell, S. A., and R.H. French, 1995. Beneficial use potential of dry weather flow in the Las Vegas Valley, Nevada. Water Resources Bulletin , 31(3), 447-461.
U.S. Environmental Protection Agency (EPA), 2001. Retrieved from the Word Wide Web: http://www.epa.gov/safewater/protect/swbasics.html#Anchor-What-49575 .
U.S. Environmental Protection Agency (EPA), 1997a. State Source Water Assessment and Protection Programs, Final Guidance.
U.S. Environmental Protection Agency (EPA), 1997b. State Methods for delineating Source water protection areas for surface water supplied sources of drinking water
Western Regional Climate Center (WRCC), 2002. Retrieved from the Word Wide Web: http://www.wrcc.dri.edu/cgi-bin/clilcd.pl?nv23169
Marcelo Reginato
reginato@unlv.edu
Graduate Research Assistant
University of Nevada Las Vegas
, Civil and Environmental Department
Thomas Piechota, Ph.D., P.E.
piechota@unlv.edu
Assistant Professor, Civil and Environmental Engineering
University of Nevada Las Vegas
, Civil and Environmental Department