Donna Wendt
Abstract:
The City of Tacoma published the Tacoma Dome Area Plan in 2001. ArcView GIS was used with CommunityVizЩ extension software in the process of developing and evaluating the economic, infrastructure, and 3D visual impacts of planned development options for the Tacoma Dome area.
The goals of this project were to redevelop what is now mainly a commercial/industrial area to a mixed-use district of retail and entertainment with urban housing. Components of this project were rezoning, environmental analysis, transportation analysis, light rail, commuter rail, and the proposed museum and office building construction projects.
Two other CommunityVizЩ projects are described in this paper, a build-out of a residential neighborhood to zoning maximums, and a scenario prototype for a parks capacity study.
This paper was presented on July 10, 2002.
Introduction
The City of Tacoma was chosen to be one of twenty two sites for the limited release of CommunityVizЩ software. The software tools help the community and planners to evaluate and visualize planned development. An ArcView extension, the components of CommunityVizЩ are closely integrated with GIS data. For more information on the software see www.communityviz.com. The software is a product of the Orton Family Foundation (see www.orton.org). The three components of CommunityVizЩ are:
SiteBuilder 3DЩ for 3D Landscape Visualization
Policy SimulatorЩ for Temporal Community Forecasting
The Tacoma Dome Area Plan
The use of CommunityVizЩ for the Tacoma Dome area plan was in creating prototypes for future enhancements in the following areas:
There are thirteen facilities that a city in Washington must provide. The study of the availability of these facilities is known as "concurrency management." These facilities are:
A scenario was set up to model the availability of water in the Tacoma Dome area. First, a study of current water use by land use code and square feet of building was conducted. The sources of data were the customer service consumption amounts and site addresses placed into ArcView, Pierce County Assessor building land uses and floor space files, and Tacoma Water pressure zone areas. Water use and building floor areas were totaled to the parcel level. Parcels with more than one land use, mixed use parcels, and parcels without building floor space were discarded for the purpose of calibrating water usage statistics. From this, a table was constructed having gallons per square foot by land use code and water rate code. A quick check of the validity of this table showed that self serve laundromats and fish processing plants consumed the most water per building square foot.
Once this table was made, it could be used in the scenario formula. To get the estimated water usage, multiply the proposed building square feet by the gallons per square foot per day. When a new building is added to the scenario, Scenario ConstructorЩ automated attribute updates do user queries, table lookups, and behind-the-scenes calculations.
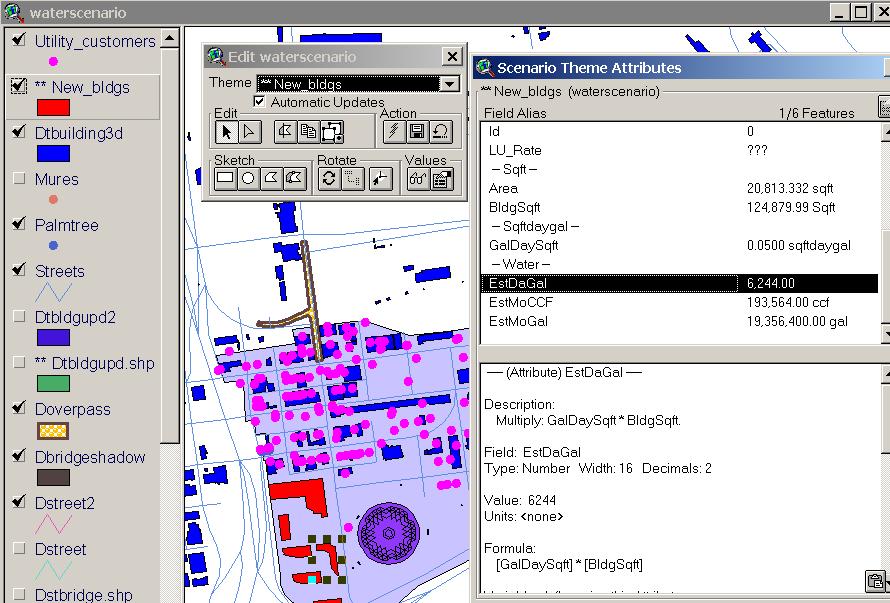
Formula Definitions
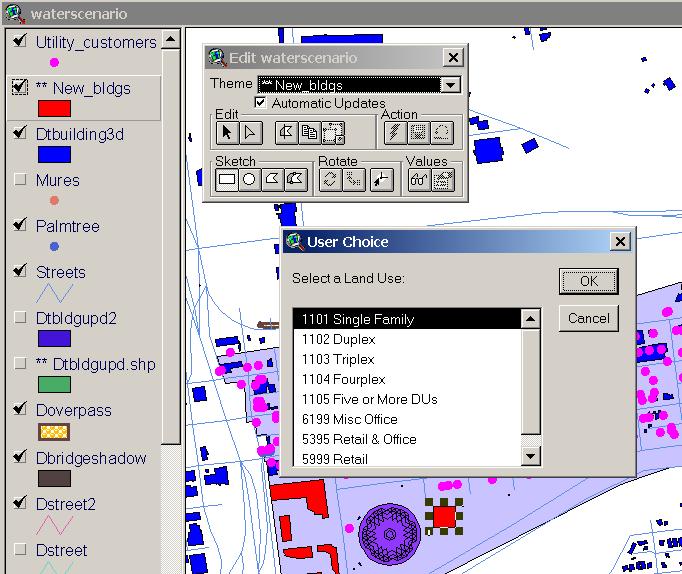
User Query Windows
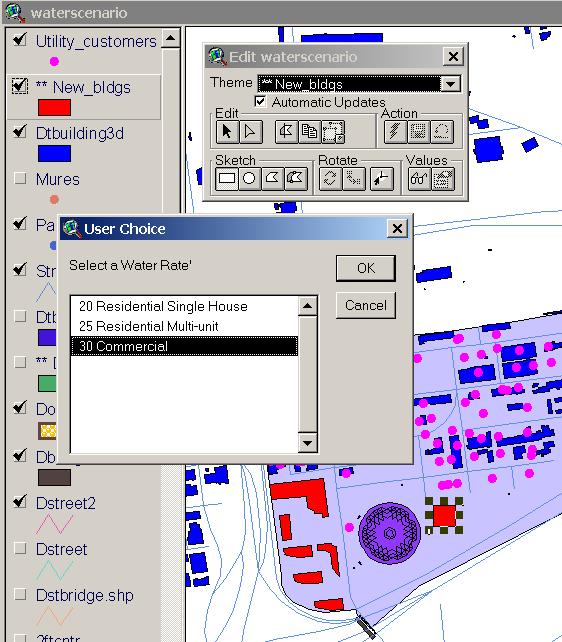
Choose Water Rate
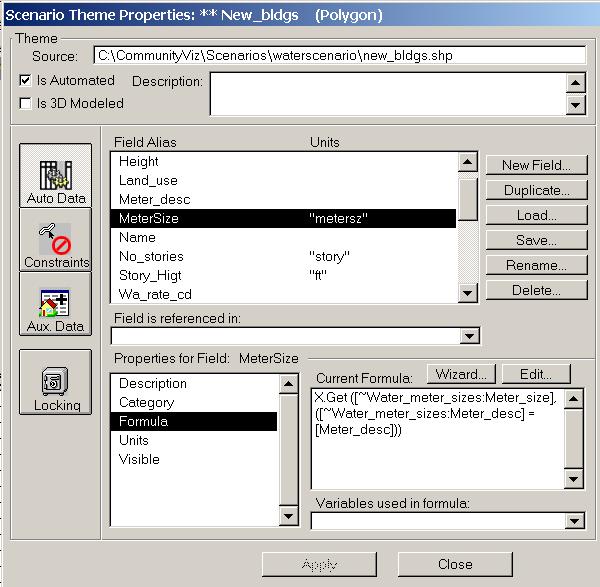
The meter size is calculated automatically without any more user entry using a powerful X function and a lookup table.
To summarize, there are five attributes of a new buildings that require user input:
The rest of the new building attributes are calculated automatically for this automated theme:
"Indicators" are tools used to measure change in a scenario. In the water usage scenario, an indicator is used to sum up the calculated water usage estimates for all of the new buildings. It is then compared to the water supply availability.
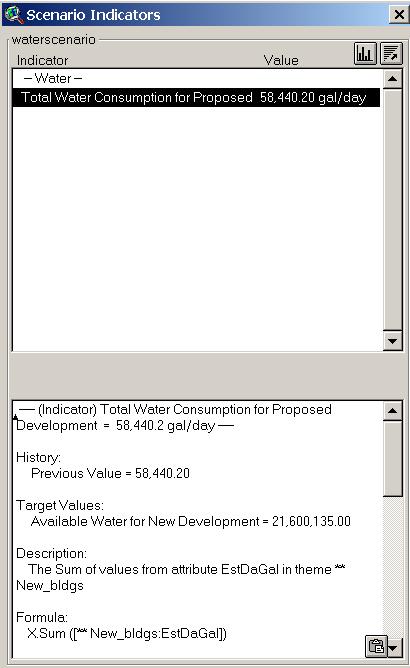
The actual water availability is even greater than that shown in the chart. The water flow of a new water main exceeded the ability to measure it.
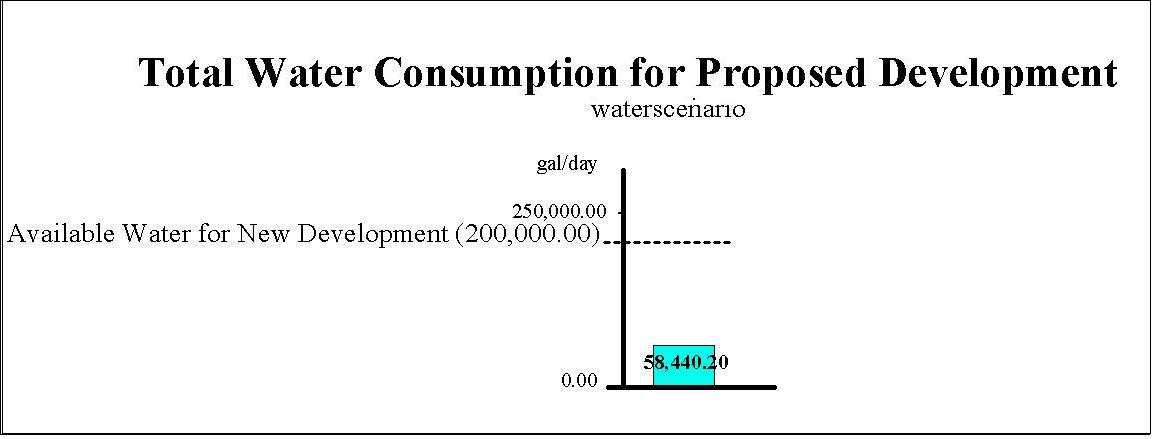
The chart is produced by clicking the chart button on the indicator window.
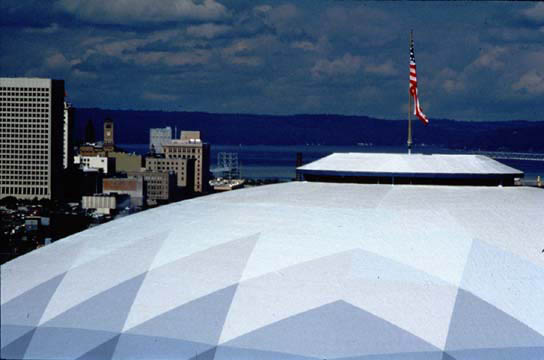
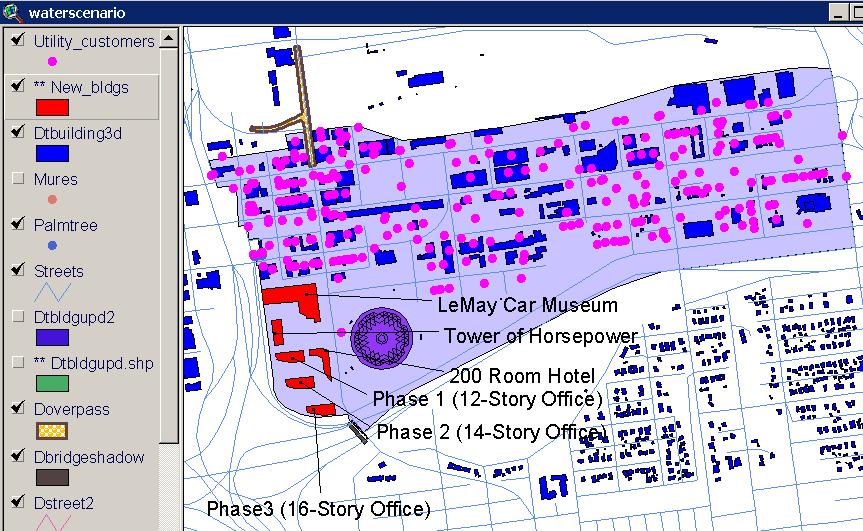
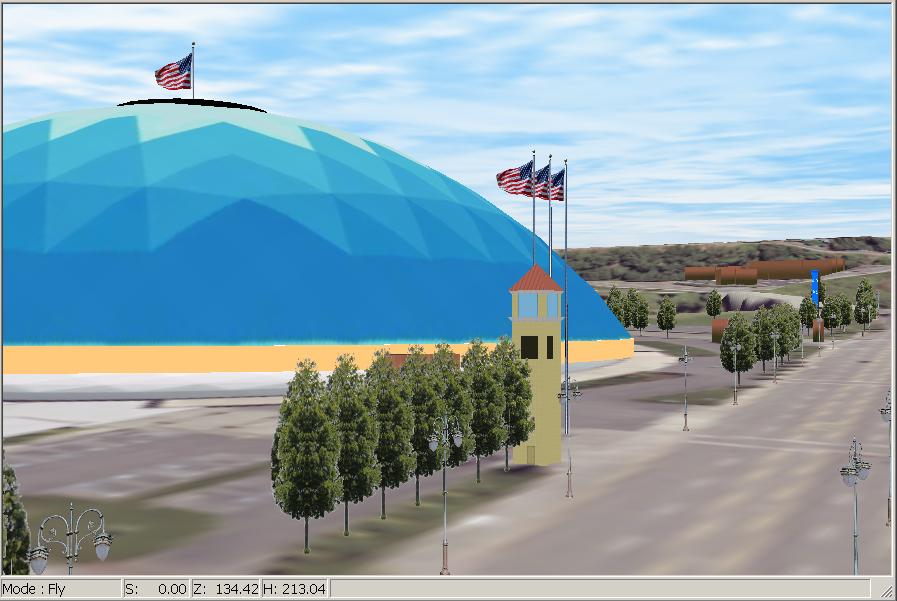
SiteBuilder 3DЩ is used to visualize the potential development of the Tacoma Dome area. This is not the final configuration and the building textures are only an approximation of the possible design. The schedule for construction has not yet been set, although discussions regarding the Harold LeMay antique car museum project are progressing.
The power of this 3D scene is that it is tied tightly to the 2D ArcView GIS themes. When the buildings are changed in shape or position, the 3D scene gets changed without needing to re-extract data as is the case with some 3D software. Features such as trees can come from the GIS tree inventory and are not merely 3D objects. Having the 3D features tied to the 2D themes enables the planner to interact with citizen groups to make changes to the development and get immediate feedback of indicators as well as the landscape visualization.
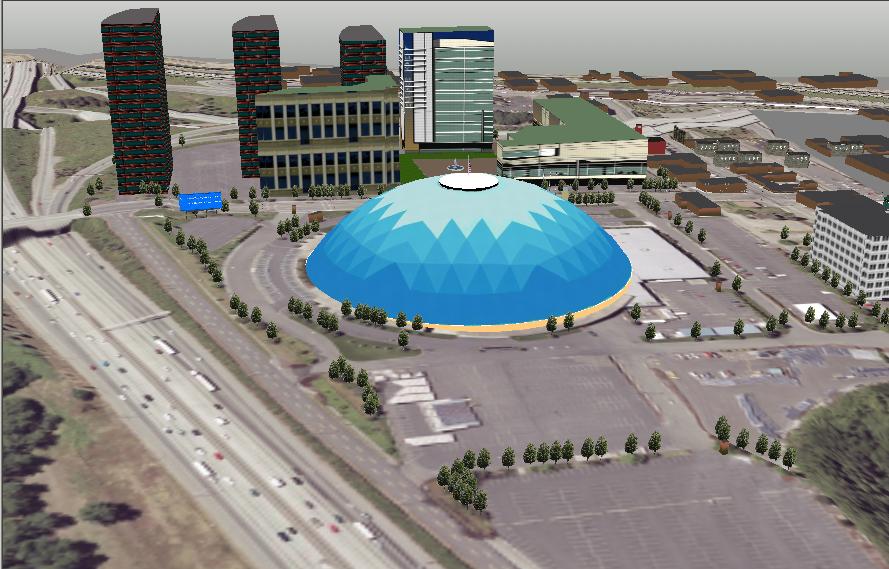
Note that the development is in the existing Tacoma Dome parking lot. Although it looks like there will be less parking, by constructing basement parking garages in the new buildings, there will be an increase in parking spaces as a result of the development.
SnagIt 6 and Camtasia software from TechSmith Corporation ( www.techsmith.com) were used to capture a 3D movie flythrough. Having the movie captured into an avi movie file is useful for presentations on PCs that do not have CommunityVizЩ installed on them. The 6-inch pixel color ortho photos draped in the 3D scenes were created by Triathlon, Inc.
Further GIS Analysis for the Tacoma Dome Area Plan
Work currently in progress will utilize the Policy SimulatorЩ component of CommunityVizЩ to do a 20-year economic forecast to evaluate the impact of the proposed development on both the Tacoma Dome area and the greater adjacent downtown Tacoma area. Policy SimulatorЩ takes into consideration a great deal of data, including but not limited to zoning, demographics, tax revenues, tax incentives, transportation, buildable land, existing development, proposed projects, and employment. Agent-based modeling is used to create the forecasts, and an element of random uncertainty can be introduced into the model. Issues that will be looked at with this modeling are the effects of the antique car museum on tourism and the impact of the proposed office space on the existing downtown businesses.
Potential Build-out to Zoning Capacity of a Residential Study Area
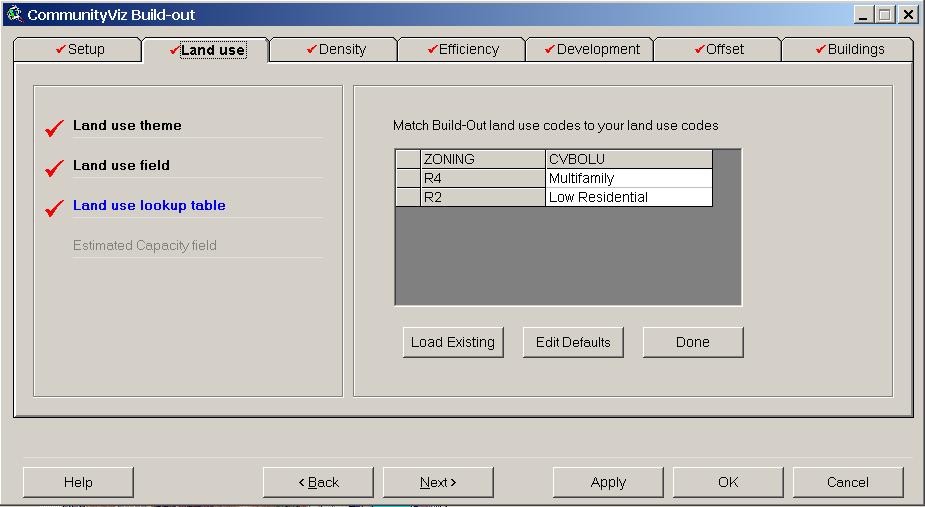
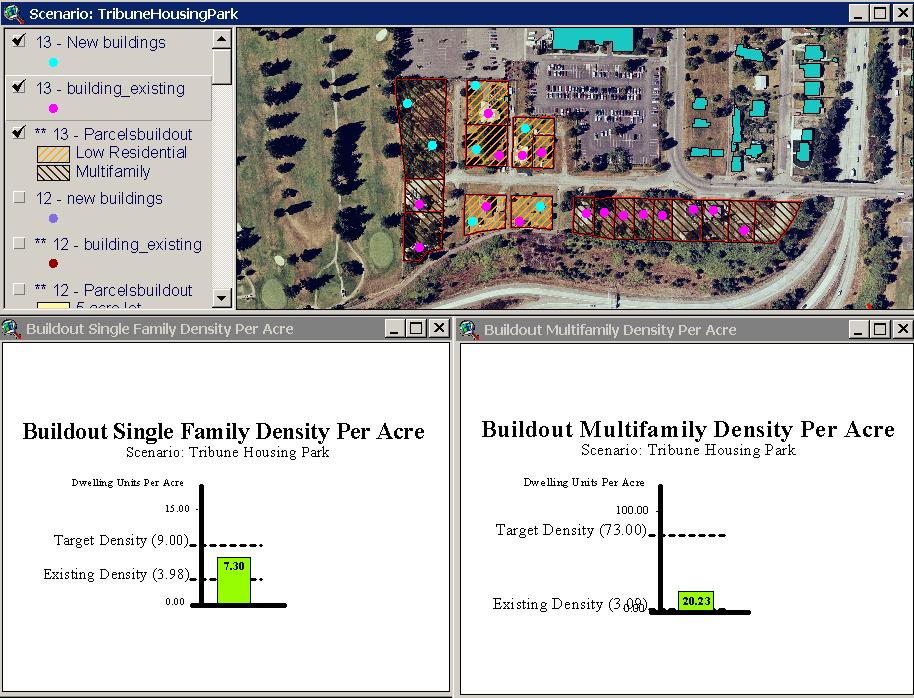
In May, 2002, Tacoma was involved in the beta test for a Scenario ConstructorЩ application, Build-Out Analysis. The software was tested in a small residential area south of the Tacoma Tribune building where some Habitat for Humanity houses have been built. The area is in the process of being rezoned to a combination of single family and multifamily. The object of the build-out is to see what the eventual density could look like and to measure the dwelling units per acre.
The data for build-out is fairly simple, zoning information and land uses for current buildings. Of course, it is nice to have the ortho photos and terrain for the 3D visualization of the results of the build-out. A wizard is used to set up the data.
The Habitat for Humanity houses and the cell tower were existing. To that, Build-Out added five houses and two apartments.
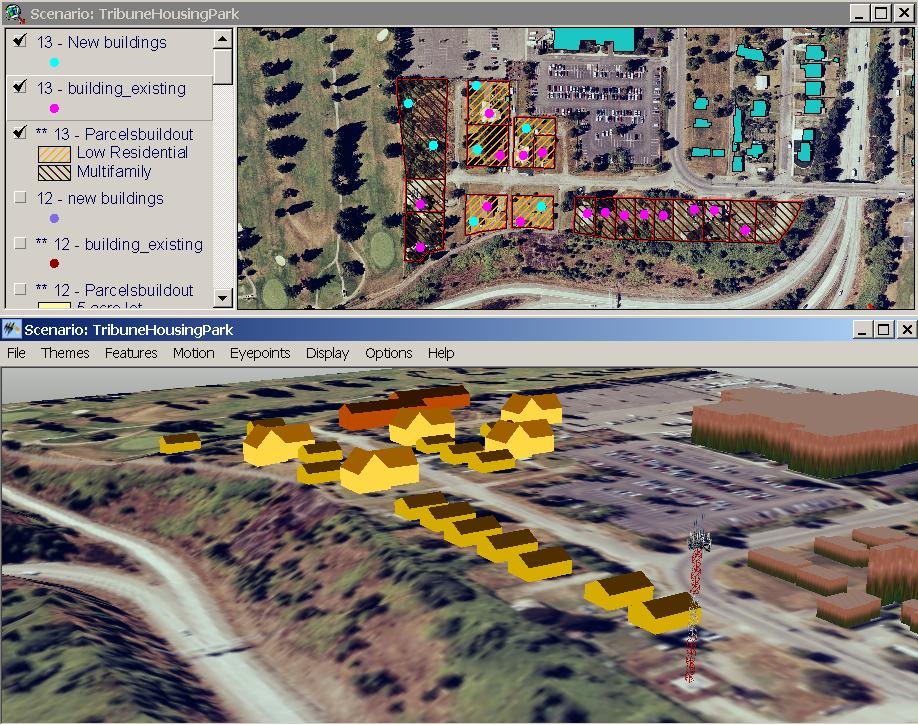
To add the element of measurement of results, indicators were built to show the resulting dwelling unit density by land use. The target densities are the maximum allowed by the zoning, which were defined under the wizard density tab. Because of the existing buildings and the shapes of the parcels, maximum density was not achieved in this area.
ForeverGreen Park Capacity Study
ForeverGreen is a group of private and public agencies concerned with planning for future population growth and regional park capacity. Their web site can be found at www.tacomaparks.com/ForeverGreen/ForeverGreen.htm. Work has just commenced on this project, so as of June, 2002, only the first prototype of this project has been started. Pierce County GIS has set up a web site for capturing park data. Park data entry has just begun, so only a few parks are present in this prototype.
CommunityVizЩ Scenario ConstructorЩ was used to do a traditional model of park usage by service radius. A radius of 0.5 miles, then 0.75 miles, was used to accumulate population served by local parks. The radius from the park was set up as a variable which can be changed using a slider bar. When the new radius is entered, indicators and linked indicator charts are immediately updated with the new population totals. Previous population totals for the half mile radius are shown on the charts with the arrows.
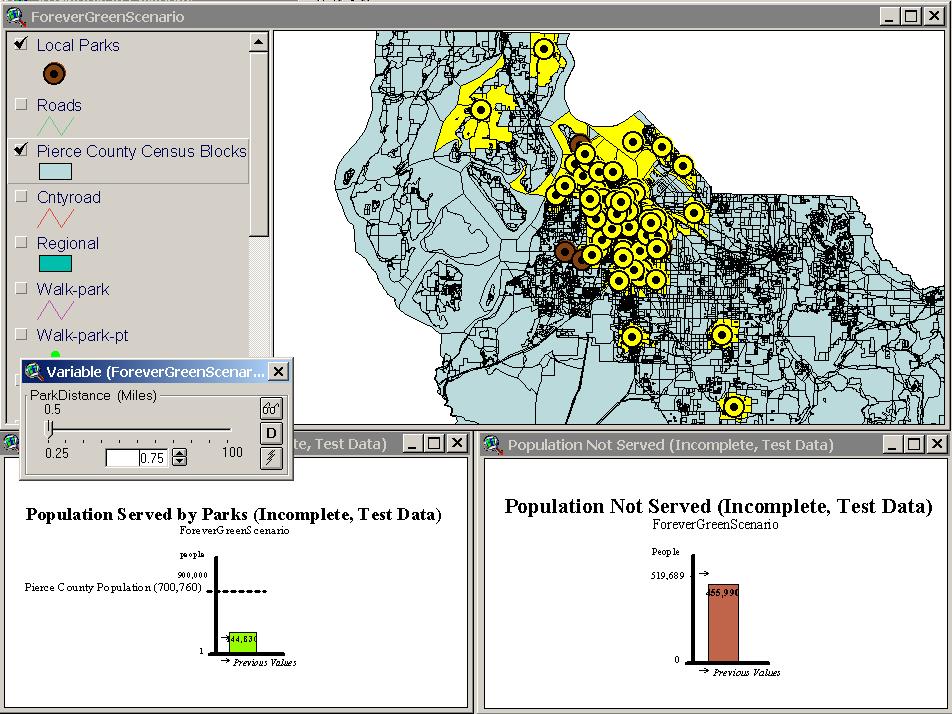
The ForeverGreen prototype is just a start of the analysis yet to be done, but it illustrates how the Scenario ConstructorЩ software may work well to evaluate the park data. Once set up, the indicators totaling population are updated as an automated X function. Other scenarios will include regional parks, impact based on specific park facilities, comparisons using the 20-year population projections, and a study of the "Four-Times Rule." The rule states that people will drive one quarter of the time they spend at an activity. So, if you spend an hour in a park, you will drive up to fifteen minutes to get there. This rule came from an extensive 1997 study of tourists done by Chandler, Brooks & Donahoe of Olympia, Washington. Applying this concept to parks and park facilities should yield some interesting findings. Network analysis for drive time and accumulating population by individual parks (centers) will be a good enhancement to the analysis process as well.
Future Plans
Tacoma will be looking into incorporating the CommunityVizЩ software into the Buildable Lands project. Much of the density, zoning, and population data is shared by both projects. The indicators and visualization tools will lend a "so what" conclusion to the buildable lands studies and should be better able to communicate the findings to government boards as well as the public. As specific projects progress, such as in the Tacoma Dome area, the development layout as well as the 3D scenes will be updated when new building configurations are proposed. For rezones, both economic and visual impact can be evaluated before the actions take place. For very important projects, more detailed 3D objects can be built for specific buildings with the summer, 2002, release of SiteBuilder 3DЩ.