A significant part of Urban Planning concerns itself with maintaining and enhancing the character of neighborhoods. Neighborhoods form the physical and social environment within which people conduct their daily activities and therefore neighborhood quality has a direct and significant impact on the quality of life of its residents. Even though ‘neighborhood planning’ enjoys an elevated position in general planning practice, there is considerable confusion and difference in opinion regarding definition and function of a neighborhood (Hunter, 1979). Planners have turned to residents to get a better understanding of what their local environment means to them and what in their opinion, constitutes their neighborhood. This process of generating meaningful public input to aid planning has however often seen only limited success because of the lack of effective tools for the purpose (Al-Kodmany, 1998). The analytical potential and the spatial explicitness of geographic information systems (GIS) can be a powerful tool bridging the gap between resident comprehension and expression of their neighborhoods and therefore go a long way in making neighborhood planning more contextual and useful.
This research is an effort to strengthen the link between GIS and public participation by taking GIS beyond its conventional role in planning to develop a ‘neighborhood GIS’. A neighborhood GIS is a database for the community that can help the residents visualize, describe and evaluate their local environment and therefore help in planning for it. A neighborhood GIS was developed for the city of Urbana, Illinois as a prototype. The city’s existing GIS was used as the base and several information layers were added to present a multidimensional picture of the community. Several Urbana residents were surveyed using the neighborhood GIS to test its effectiveness as a participatory tool. During the survey, the participants were encouraged to interact with the GIS to the extent that they felt comfortable (with the help of a GIS facilitator) and then respond to several questions about their neighborhood and the city.
Current methods for expression of individual and group perceptions/preferences include techniques like survey questionnaires (open ended or otherwise), marking up maps, design charrettes and Likert scale rankings (Talen, 2000b). Although these techniques have their own relevance, GIS provides a range of new possibilities by introducing spatial complexity and interactivity. It is widely acknowledged that these additional dimensions can be very valuable in securing meaningful resident involvement in the planning process (Howard, 1998; Kim, 1998; Elwood and Leitner, 1998; Shiffer, 1998; Harris and Weiner, 1998; Al-Kodmany, 1998, 2000; Martin and Myers, 1994; Couclelis and Monmonier, 1995; Hoefer et al., 1994; Florence et al., 1996; Craig and Elwood, 1998; Parker, 1998; Bosworth and Donovan, 1998; and Talen, 2000b).
GIS can be used to display most location specific data in a visual format, which is easy to understand and manipulate. While it is true that even traditional paper maps and models can portray data spatially, they are not very good at handling spatial complexity. For example, as the city of Rockford, IL discovered, it is very difficult to simultaneously visualize the impact of poverty, unemployment and education on crime rates in an area using paper maps (Hoefer et al., 1994). The city had to create several maps to represent each variable of interest on transparent sheets of paper that were overlaid to see how the different variables correlated. This cumbersome process is made very easy in GIS – a user can overlay any combination of variables in a single map to analyze situations or express preferences using very basic operations. Also, variables like visual quality, traditionally considered ‘intangible’, can be represented quite well using multimedia tools like ‘hotlinking’ within the GIS system. Issues like an area’s strengths and weaknesses or personal definitions of what constitutes one’s neighborhood can be converted from non-spatially referenced lists and given a meaningful spatial context using GIS (Talen, 2000b). For example, ‘sense of place’ might find a definition in terms of some spatial elements like nature of public spaces, streets, architecture and physical condition of buildings, visual character, distribution of people and their activities (Al-Kodmany, 1998). GIS can therefore equip residents with a more complex spatial vocabulary than simple paper maps and thereby enhance the richness of their expression.
Residents can manipulate and interact with the GIS data to query out information that they require to better understand and describe their neighborhood. This is an immense improvement over paper maps or picture slides, which are static representations. The information conveyed in paper maps is limited to what is drawn on the map; users cannot derive any further attribute information pertaining to the mapped data nor can they change the content or the display style of the map. Also, paper maps cannot be redrawn fast enough to keep pace with an individual’s evolving thought process or a dynamic group discussion that might involve multiple variables and alternative scenarios. This can impede discussion and expression – Al-Kodmany (1998) talks about the frustration of using picture slides and paper maps in a community meeting setting in a neighborhood of Chicago. The interactive capability of GIS overcomes these limitations to a great extent. Operations varying from the simple zoom, pan, and copy, paste themes between views to spatial queries like area calculations, location/ number of occurrences of an entity, attributes of an entity, shortest path etc. can be easily performed by residents with the help of a GIS facilitator.
Coupled with the technical advantages that GIS has to offer, the increasing availability of inexpensive GIS data and development of user friendly software, present strong arguments in favor of developing its potential as a tool for community participation in planning (Ammerman, 1997).
Urbana is a small (population 40,000), Midwestern college town, and is the older and the smaller portion of the twin city region of Champaign-Urbana. Urbana has several mixed use, traditionally designed residential areas and a small downtown. The thriving commercial centers in the region, including a large regional shopping mall, are located in Champaign, which therefore has a stronger economic base. Most of the growth in the region, including new, low-density sub-divisions, occurs in Champaign, while Urbana faces a declining tax-base. The flagship campus of the University of Illinois (the University of Illinois at Urbana-Champaign) is geographically situated between the two cities.
The first step in building the neighborhood GIS was collecting the relevant data. A major concern was that the data had to be at a scale that the residents could use effectively for addressing neighborhood level issues. Abundant GIS data on natural topography, administrative boundaries, infrastructure and demographic characteristics like ethnicity and population density is available for free or a nominal charge through the U.S. Census (http://www.census.gov), the U.S. Geological Survey (http://www.usgs.gov) and Esri, a primary commercial distributor of GIS software and data (http://www.Esri.com). However, most of this data is available at the block-group level, which is not specific enough for neighborhood level analysis. Data from commercial GIS vendors is often more detailed but it is expensive and geared towards business location decision making rather than neighborhood planning. Although the larger-scaled data is useful, neighborhood-scaled data is critical and the local government planning agencies are usually the best source for that.
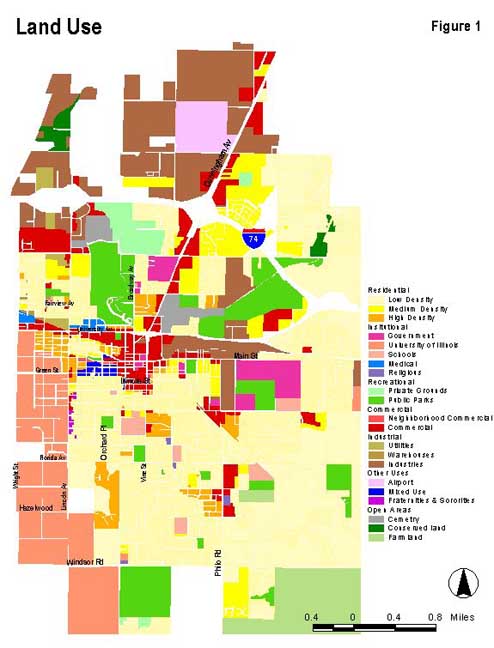
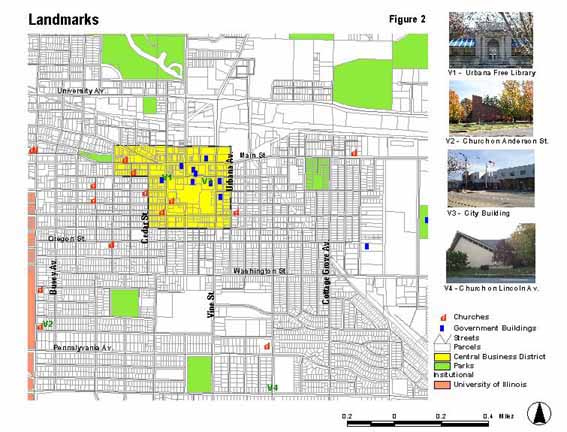
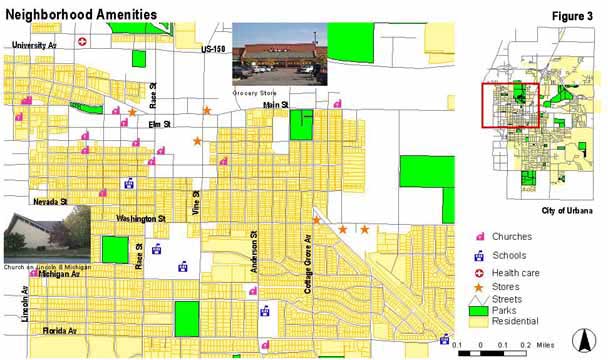
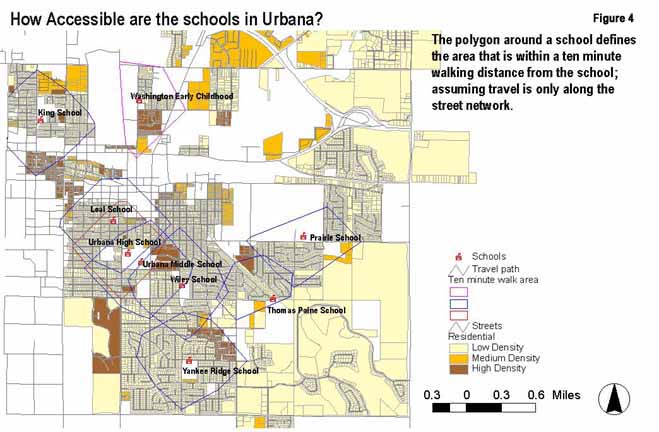
One of the reasons why Urbana was chosen as the prototype city was the availability of basic data layers from the city planning department. Street network, block boundaries and land parcels with associated attributes like land-use were obtained from the city. Additional information was collected from other local sources like the school district, the park district, police department and supplemented by field surveys. Digital images of buildings, streetscapes and cityscapes were also taken and linked to the maps to provide a realistic and 3-D representation of the urban fabric. The effort was to go beyond conventional GIS to incorporate variables that the residents would value, to present information in a lucid format and, to build as comprehensive an image as possible within the constraints of time and data availability. Arc View 3.2 was chosen as the software for building the GIS project because of its high degree of user-friendliness along with enhanced capabilities through extensions,. Different aspects of the community were presented by combining various data layers or “themes” to form maps or “views” in the Arc View project. Each view was displayed in a separate ‘window’ on the computer screen. For the purpose of resident surveys, ten such different views were constructed. These were –
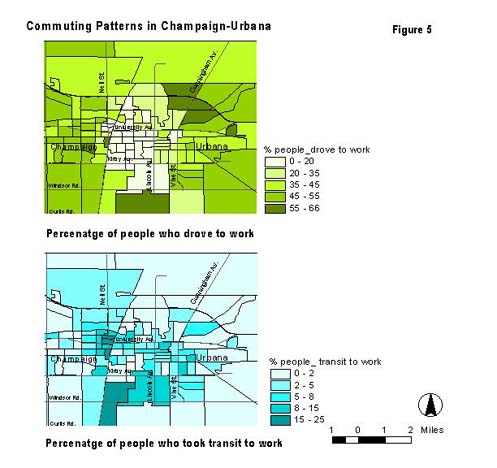
6. Commuting patterns to work (Figure 5), captured two aspects of the ‘travel to work’ patterns of Urbana’s residents – mode of transportation (personal auto, transit, walk/bike) and travel time to work. Mapping this data helped in differentiating certain areas in the city as ‘less auto dependant’ than the others. This data was presented for the entire Champaign-Urbana region because most residents commute between the two cities. Also, the data was shown at the census block group level, which is the smallest geographic unit that the data is available for.
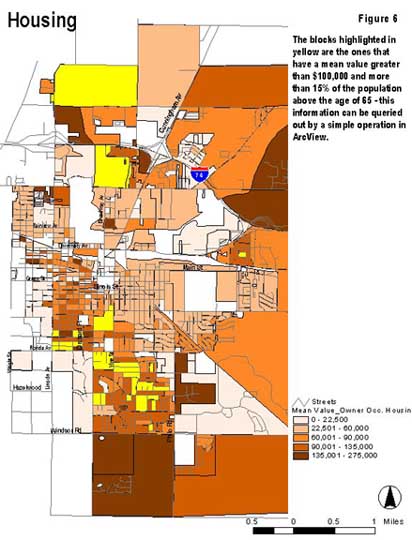
7. Housing (Figure 6), depicting housing density, mean value of owner occupied housing and the distribution of owner occupied and rental housing units in the city. This map brought out the income differential in the city represented by the range of values for owner occupied housing. Using this map as an overlay with other themes like population distribution by race, the residents could get additional insights in their community. The housing data was obtained from the 1990 Census block level data CD-ROM (1990 Census of Population and Housing Block Statistics CD-ROM) distributed by the U.S. Census Bureau. The data pertaining to the blocks in Urbana was extracted from the census CD and linked to the base map of the blocks in Arc View using the unique block id as the linking field. The relevant attributes were then displayed as different themes.
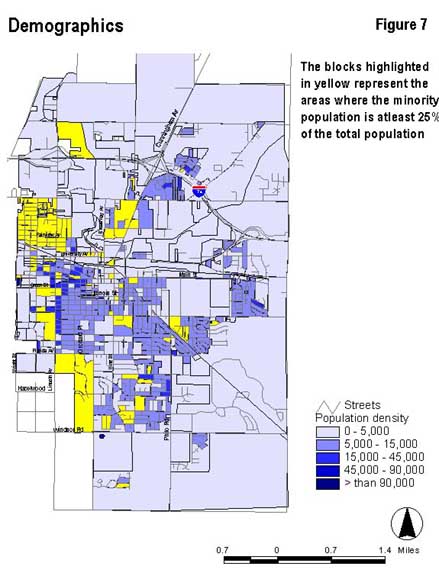
8. Demographics (Figure 7), displaying population density and distribution of people by race and age. This map when viewed in conjunction with some other variables like housing, or crime proved to be useful in analyzing several issues and concerns. The demographic data was also obtained from the 1990 Census block level data CD-ROM distributed by the U.S. Census Bureau.
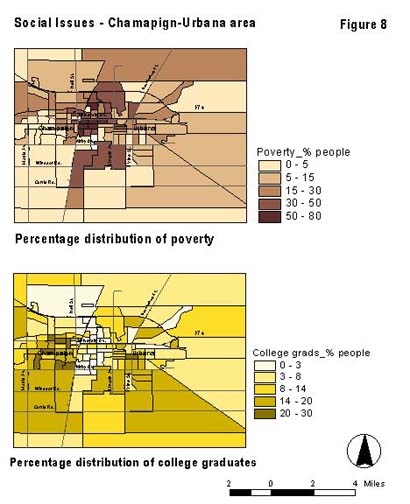
9. Social issues (Figure 8), displaying distribution of variables like poverty, unemployment and education levels in the city by census block groups.
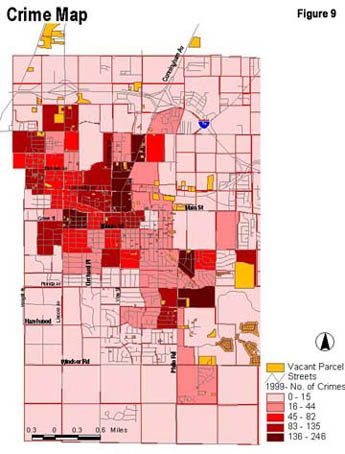
10. Crime map (Figure 9), showing the total number of crimes committed in the city during a year. A breakdown of the crime type into violent, theft/burglary, drug related and sex related crimes was also mapped to get a clearer picture of the nature and seriousness of offenses and their relative spatial distribution in the city. Crime data was obtained from the Urbana Police department. The police department records all the reported crime incidents in the city by the place of occurrence. The city is divided into several areas called ‘geo-codes’ for this purpose. The number of crimes committed by crime type in each geo-code in the city between January 1, 1999 and January 1, 2000 was obtained from the police department as a spreadsheet. The geo-codes were digitized into the database from a paper map and the crime data spreadsheet was linked to the geo-codes using the unique geo-code number as the linking field.
Several residents in the city were interviewed to test the effectiveness of the neighborhood GIS in gathering citizen input. The interview was conducted as an in-depth, structured session where the GIS facilitator would have sufficient time to explain the different views in the GIS project, demonstrate basic GIS operations and help the interviewee navigate through the data layers to respond to the survey and ultimately build his/ her own map of personal perceptions.
Because of these constraints, the sample for this survey was limited to 18 people. In an effort to make this sample representative of the whole city, interviews were conducted at two public places – the public library and the downtown shopping mall. A laptop computer was set up in a relatively high traffic area in these locations along with a sign inviting residents to participate in a ‘Neighborhood Mapping Project’. Eleven surveys were conducted in this way. A second approach was used to obtain responses from a targeted population: neighborhood organization members, city planning staff and city council members were contacted and invited to participate in the survey, and 7 interviews were conducted in this way . Most of the participants were professionals; 13 held white-collar jobs, three were blue-collar workers and the remaining two were homemakers. All respondents were white, although respondent ages varied from late twenties to fifties. A majority of the residents (10 out of 18) had lived in their Urbana neighborhoods for over ten years, 5 of them had lived there for over four years, and the remaining three for approximately two years.
Most of the interviews conducted were intensive varying in length from 30 minutes to 3 hours depending on the extent that the participant wanted to get involved. It was assumed that the participant did not have any prior experience with GIS therefore each interview began with some basic steps to build familiarity with the project and basic GIS functionality before moving onto evaluation of perceptions. The familiarization process consisted two steps. First the resident was introduced to the views in the GIS and the way the different variables are represented for example, parcels as polygons with the color indicating land use, buildings as point symbols, varying crime level through color gradation. The second step involved explaining the use of some basic GIS tools. It was explained how a map could be viewed at different scales by ‘zooming in’ and ‘zooming out’ or moved in any direction by ‘panning’, how distances and areas could be calculated, how attribute information could be obtained by clicking on any feature and how different images could be created by turning layers on and off and by copying and pasting layers from other maps.
This orientation was followed by the survey, which was based on the following three basic questions –
Although all the interviews followed the general structure outlined above, they were fairly open-ended in the sense that the participants were free to interact with the GIS as much as they liked and also to express themselves in any way they deemed fit - by building new maps, by drawing on existing maps, by verbal descriptions or any combination of these. Most participants showed a great degree of involvement - the length of the interview sessions varied from 35 minutes to 3 hours with the average being close to an hour.
Considering the nature of the research questions and the open-ended, intensive and selective methodology adopted for the survey, a qualitative approach was chosen for summarizing the resident responses. While quantitative methods of analysis rely on unambiguous responses to analyze a definite set of variables, qualitative methods enable the inclusion of open-ended responses and allow contextual modifications in the number and type of variables to be considered. Qualitative methods emphasize ‘the central role of subjective perception and the construction of personal meanings as determinants of how people experience reality’ (Banyard and Miller, 1998) and are therefore extremely useful when a few participants are involved and the questions are framed to elicit broad responses (Patton, 1990; Denzin and Lincoln, 1994 in Suchan and Brewer, 2000). All the individual responses from the survey were studied and analyzed in detail and then pooled together to present a collective image of perceptions and opinions representative of the group as a whole. Some of the individual responses have also been presented separately as maps (Figure nos. 10 -13) to give a picture of the nature of responses that can be expected using GIS. The survey findings have been summarized under different sub-sections to reflect resident perceptions on different aspects of their neighborhoods.
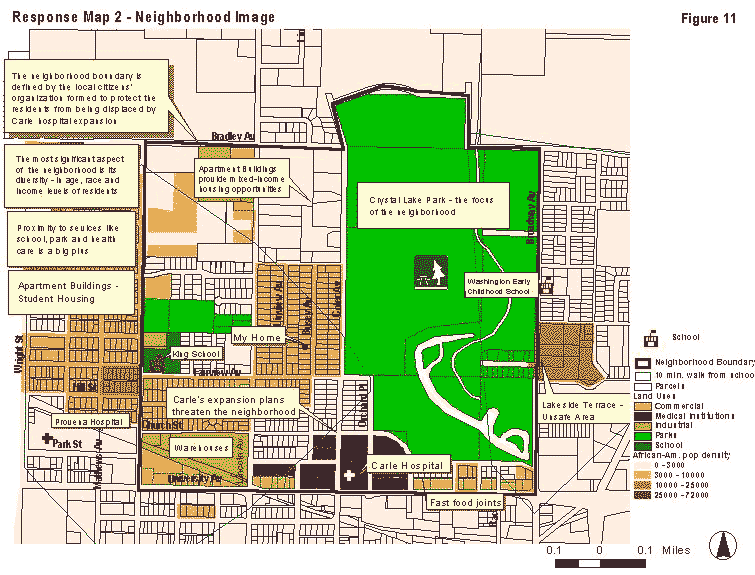
As researchers on neighborhood issues have noted earlier, most people tend to have unique perceptions of what constitutes their neighborhood. Every participant felt that they lived in a neighborhood and all of them excepting one, could define a specific physical area as their neighborhood (figure 10 and figure 11). The one person who couldn’t, felt that his neighborhood was not bounded by physical boundaries, it extended out to wherever there were friends in the city. This definition is reminiscent of ‘territorially detached’ neighborhoods described by McClenahan and Sweetzer (Olson, 1982). In the other cases, the size of the defined area varied tremendously from 10 acres to about 400 acres – while some people included only a part of one or two blocks as their neighborhood, for others it extended far out to include a large section of the city. The elements used by them to define the boundaries varied from physical features like street pattern, housing type; social relationships ranging from strong friendships to loose ties built on similar social level and lifestyle; individual activity patterns like walking area, sentiments of place attachment and inherent place characteristics like common history. These varying perceptions reflect the complexity of neighborhoods and re-emphasizes Bardo’s (1984) conception that a neighborhood can serve multiple functions for different people and therefore have multiple meanings. The people most knowledgeable about planning issues in the community i.e. the city planners, city officials and neighborhood leaders showed a greater propensity for using place characteristics (physical as well as social) like streets or type of people for determining neighborhood boundaries. These people work with formally demarcated physical areas as different neighborhoods/wards and their leaning towards physical elements is probably a reflection of that influence. Figure 11 is representative of such a response. The other residents, tended to have personalized definitions based on elements or activities that involved them more directly; for example, location of friends, degree of familiarity with the area as well as the people living there and the range of a daily/frequent activity like walking (figure 10).
Figure 10: Response map 1: neighborhood boundaries
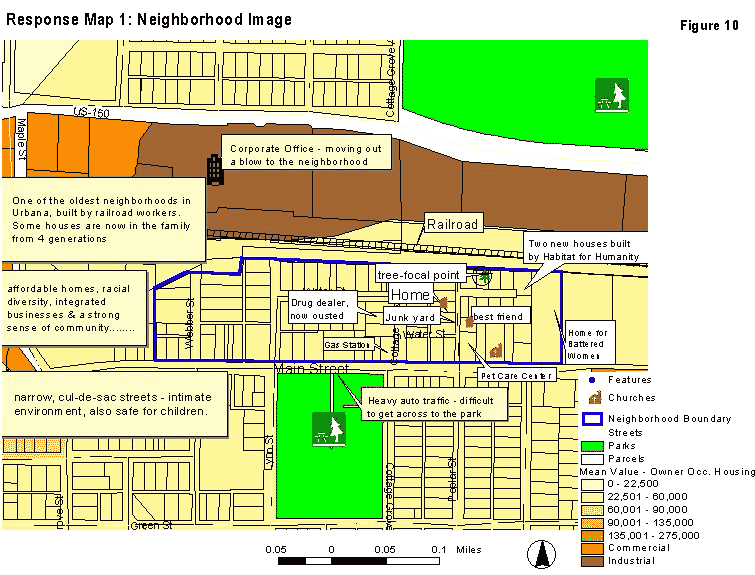
Figure 11: Response map 2: neighborhood boundaries
The residents were also asked to identify the elements that were most important to them in describing the character of their neighborhoods. The residents were asked to choose from the various GIS layers and encouraged to think beyond the existing representation to identify elements that are significant but were not represented.
The most important element that recurred in some form in every response was the location of the neighborhood with respect to other uses in the city. Type of development around the neighborhood and the corresponding effect on travel patterns seemed to be an important characteristic irrespective of whether the interviewee was involved directly in neighborhood planning. The relative importance of proximity to different uses however varied amongst individuals. For most people (13 out of the 18 interviewees), the distribution of neighborhood amenities like schools, parks, stores and religious institutions was important. Significantly, although the respondents did not define their neighborhood boundaries based on location of facilities, their presence or absence did affect their evaluation of the character of the neighborhood. Therefore, even though residents might not conceptualize their neighborhoods as Perry’s (1929) ‘neighborhood unit’, which is extremely popular amongst planners, they do value its underlying concept of accessibility to basic services. Other significant elements that helped the residents in neighborhood description were population characteristics like racial distribution, education and income level of people; housing characteristics like type and age of houses and crime levels.
Most of these elements were represented well in the GIS and the residents found it easy to build a picture of their neighborhood by combining the different themes. Neighborhood aesthetics was another valued characteristic – the architectural style of the houses, the tree lined avenues, the brick-paving on the streets, the colors and the textures were very important to the residents. This aspect was however rather inadequately portrayed in the present neighborhood GIS and calls for a better integration with multimedia techniques like 3-D visualizations or even traditional techniques like sketching (see Al-Kodmany, 1998; 2000 for more on this integration).
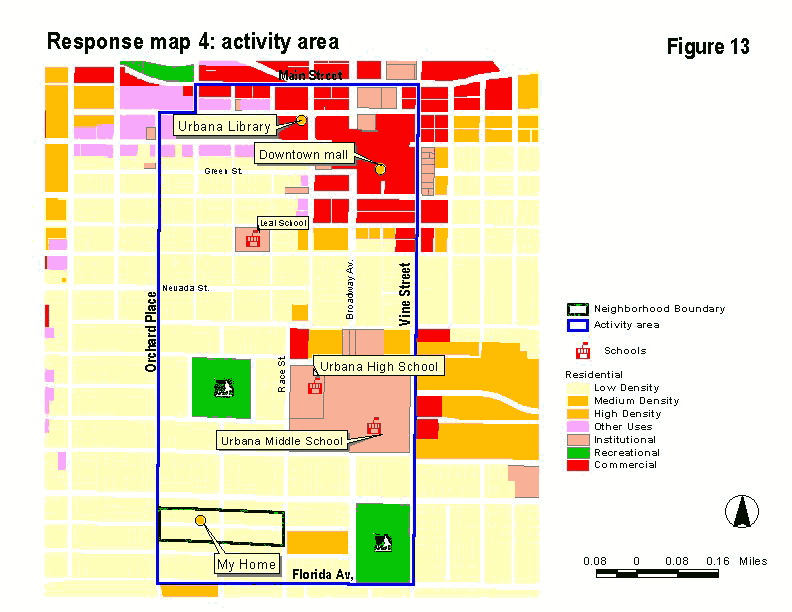
The GIS data layers that were the most useful in evaluating activity areas were those showing the street network, detailed land uses, and point locations of amenities and landmarks. The hot-linked images were found to be highly useful – images of buildings, street intersections and streetscapes helped respondents orient themselves in different GIS views and describe their routes specifically. Respondents also identified missing data that they believed would have been useful in evaluating activity areas; specifically, traffic counts on some major roads, and maps showing bike lanes and transit routes.
Figure 12: Response map 3: activity area
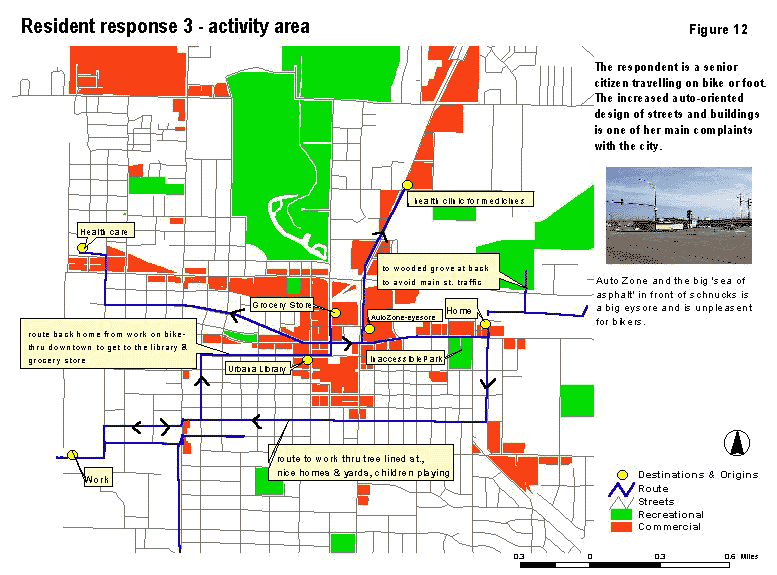
Figure 13: Response map 4: activity area
In this case, the existing GIS layers seemed to be somewhat inadequate in representing resident expressions. This was mostly due to the fact that like / dislike assessment tended to be based on very ‘broad’ and non-location specific elements, which are difficult to represent using GIS. However, these expressions and assessments can be collapsed together and included as new ‘value based layers’ in the neighborhood GIS. This would take it beyond a database holding factual information into a database containing dynamic insights into the character of the city.
Clearly, GIS offers several advances in eliciting community participation in planning. However, the Urbana exercise also brought forward some limitations and areas for further research and improvement.
As mentioned earlier, finding appropriate data is probably the most difficult part of building the neighborhood GIS. Although it is true that the use of GIS is increasing in US cities and a lot of them have parcel level data, but it is generally geared towards conventional utility and land management purposes and therefore not very helpful for community participation projects. Often, even if the data exists, it is not easily available or available only at a high cost. Also, it is very rare that all the relevant data will be available from one source; to get a comprehensive set of variables, one might have to depend on several agencies or sources. This brings its own problems in the form of data compatibility – if good metadata is not available, it might not be possible to use the GIS data from different sources in one image. In several situations, the only option for a community might be to actually go out and build its own database or to do extensive mapping to build on the existing GIS to make it relevant to their purpose. However, this process could be expensive and difficult to afford for several communities especially the ones with limited financial resources.
Building and managing a GIS database requires specialized skills and equipment. Even if basic GIS data layers are available from the city, it requires considerable amount of work to collect other data to augment the basic layers and manipulation in GIS to present the data in an easily usable format. Besides personnel skills, appropriate computer hardware and software is also required to build the GIS and to use it. Acquiring all this again involves considerable expenditure, which might be unaffordable for some communities.
Once the GIS database is in place, its efficient management also presents some practical challenges. A database for a city or even a part of it will be very large and complex therefore storage is an issue to be considered. Since the usability of the neighborhood GIS will be tied to the computers that the database is stored in, it is important that it is stored in computers that can be accessed by all the involved parties. The community members would also need to be trained such that they can use the neighborhood GIS efficiently and ultimately take ownership of it. This would require structured training sessions for the residents and sufficient motivation on their part to gain the necessary skills.
While GIS can be a powerful tool in the hands of the community giving them a new ability to express themselves and actively participate in the planning process, there is a fear that it can also marginalize some sections of the community (Clark, 1998; Harris and Weiner, 1998). To be able to use GIS or to even participate effectively in a group GIS session, residents require some formal training in its functionality. Even though GIS software is becoming increasingly user-friendly, it is not very friendly to people who might not have ever used computers before. Just the aura of ‘new technology’ that surrounds GIS might be daunting to several people in the community. The use of GIS therefore requires extra sensitivity towards such groups in the community to help them overcome their hesitation in using GIS and be an active participant. However, as pointed out by Leitner et al. (1998) this is not very easy to achieve. There are numerous cases where adoption of a new technology or expertise has created rifts in the organization. The NCGIA specialist meeting on ‘Empowerment, Marginalization and GIS’ held in Santa Barbara in October 1998, brought together research by several scholars on different dimensions of this issue (see http://www.ncgia.ucsb.edu/varenius/ppgis/papers).
The positive response of the residents who participated in the neighborhood GIS exercise in Urbana, and the enthusiasm of the city officials, suggest that GIS can indeed be effectively used for enhancing community participation in the planning process.
Several advantages of using GIS have come through this exercise in Urbana making the case stronger for developing GIS as a community participation tool –
It is true that there are still limitations in working with GIS as a community participation tool but as the technology evolves further to become more user-friendly and as GIS data becomes cheaper and more easily available, these limitations will become less significant and hopefully we will see more and more communities benefit from using it.
Al-Kodmany, Kheir. (1998). GIS and the artist: Shaping the image of a neighborhood in participatory environmental design. Position paper presented at Project Varenius Specialist Meeting: Empowerment, Marginalization and Public Participation GIS, Santa Barbara, CA [On-line]. Available: http://www.ncgia.ucsb/varenius/ppgis/papers
Al-Kodmany, Kheir. (2000). Extending geographic information systems to meet neighborhood planning needs: The case of three Chicago communities. URISA Journal 12, 3: 19-37.
Ammerman, Peggy. (1997). Sharing the wealth: Taking GIS data to the public. American City and County, October, 1997.
Banyard, Victoria L. and Miller, Kenneth E. (1998). The powerful potential of qualitative research for community psychology. American Journal of Community Psychology 26, 4: 485-505.
Bardo, John W. (1984). A reexamination of the neighborhood as a socio-spatial schema. Sociological Inquiry 54, 3: 346-358.
Bosworth, Mark and Donovan John. (1998). A Mapmaker’s dream: Public involvement applications utilization of GIS. Position paper presented at Project Varenius Specialist Meeting: Empowerment, Marginalization and Public Participation GIS, Santa Barbara, CA [On-line]. Available: <http://www.ncgia.ucsb/varenius/ppgis/papers>.
Clark, M. J. (1998). GIS – democracy or delusion? Environment & Planning A 30, 2: 303-316.
Couclelis, Helen and Monmonier, Mark. (1995). Using SUSS to resolve NIMBY: How spatial understanding support systems can help with the “Not in my backyard” syndrome. Geographical Systems, 2: 83-101.
Craig, William J. and Elwood, Sarah A. (1998). How and why community groups use maps and geographic information. Cartography and Geographic Information Systems 25, 2: 95-104.
Elwood, Sarah and Leitner, Helga. (1998). GIS and community based planning: Exploring the diversity of neighborhood perspectives and needs. Cartography and Geographic Information Systems 25, 2: 77-88.
Florence, John, Hornsby, Kathleen and Egenhofer, Max J. (1996). The GIS wallboard: Interactions with spatial information on large-scale displays [Online]. Available: National Center for Geographic Information and Analysis, University of Maine, http://www.spatial.maine.edu/~max/Wallpaper.html
Harris, Trevor and Weiner, David. (1998). Community integrated GIS for land reform in Mpumalanga province, South Africa. Position paper presented at Project Varenius Specialist Meeting: Empowerment, Marginalization and Public Participation GIS, Santa Barbara, CA [On-line]. Available: http://www.ncgia.ucsb/varenius/ppgis/papers
Hoefer, Richard A., Hoefer, Regina M. and Tobias, Ruth A. (1994). Geographic information systems and human services. Journal of Community Practice 1, 13: 113-127.
Howard, Daniel. (1998). Geographic information technologies and community planning: spatial empowerment and public participation. Position paper presented at Project Varenius Specialist Meeting: Empowerment, Marginalization and Public Participation GIS, Santa Barbara, CA [On-line]. Available: http://www.ncgia.ucsb/varenius/ppgis/papers
Hunter, Albert. (1979). The urban neighborhood: Its analytical and social contexts. Urban Affairs Quarterly 14, 3: 267-288.
Kim, Karl. (1998). Using GIS technologies to empower community based organizations in Hawaii. Position paper presented at Project Varenius Specialist Meeting: Empowerment, Marginalization and Public Participation GIS, Santa Barbara, CA [On-line]. Available: http://www.ncgia.ucsb/varenius/ppgis/papers
Leitner, Helga, McMaster, Robert, Elwood, Sarah, McMaster, Susanna and Sheppard, Eric. Models for making GIS available to community organizations: dimensions of difference and appropriateness. Position paper presented at Project Varenius Specialist Meeting: Empowerment, Marginalization and Public Participation GIS, Santa Barbara, CA [On-line]. Available: http://www.ncgia.ucsb/varenius/ppgis/papers
Myers, Jim and Martin, Michael. (1994). Metcalfe park neighborhood residents association housing GIS project: Applying geographic information systems to neighborhood planning. 1994 URISA Proceedings: 875-886.
Olson, Philip. (1982). Urban neighborhood research: its development and current focus. Urban Affairs Quarterly 17, 4: 491-518.
Parker, Cheryl. (1998). Living neighborhood maps: The next wave of local community development. Position paper presented at Project Varenius Specialist Meeting: Empowerment, Marginalization and Public Participation GIS, Santa Barbara, CA [On-line]. Available: http://www.ncgia.ucsb/varenius/ppgis/papers
Perry, Clarence A. (1929). 1974. The neighborhood unit. In Neighborhood and community planning, metropolitan America. Reprint, NewYork: Arno.
Shiffer, Michael J. (1998). Multimedia GIS for planning support and public discourse. Cartography and Geographic Information Systems 25, 2: 89-94.
Suchan, Trudy A. and Brewer, Cynthia A. (2000). Qualitative methods for research on mapmaking and map use. Professional Geographer 52, 1: 145-154.
Talen, Emily. (1999). Sense of community and neighborhood form: An assessment of the social doctrine of New Urbanism. Urban Studies 36, 8: 1361-1379.
Talen, Emily. (2000). The problem with community in planning. Journal of Planning Literature 15, 2: 171-183.
Talen, Emily. (2000b). Bottom-Up GIS: A new tool for individual and group expression in participatory planning. Journal of the American Planning Association 66, 3: 279-294.
Swasti Shah
MUP 2001, University of Illinois at Urbana-Champaign
Urban Planner
HNTB Architects Engineers Planners
100 Glenborough Drive, Suite 1300
Houston, TX – 77067
sshah@hntb.com