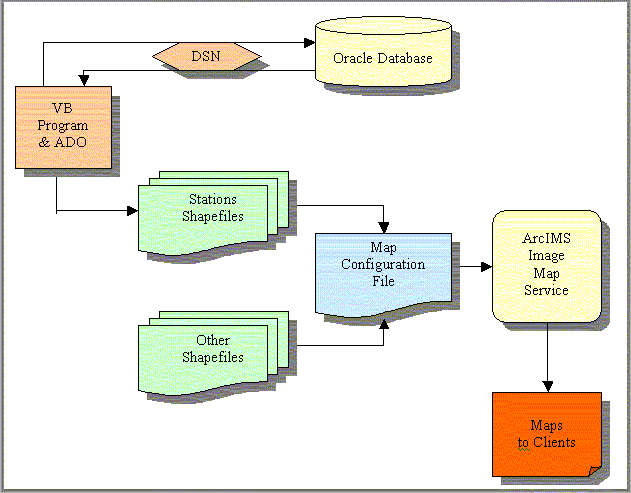
Figure 1. Serve components and processes.
By
Wei Sun, St. Johns River Water Management District
Peggy White, St. Johns River Water Management District
Kevin Brown, St. Johns River Water Management District
Abstract
This paper presents GIS as an essential information accessing and retrieval
tool for water management at the St. Johns River Water Management District.
The assessment looks at the integration of GIS with RDBMS in the development
and implementation of enterprise computing solutions that address the daily
operational requirements of water management in an integrated computing
environment. This project focuses on developing internet-based ArcIMS tools
connecting GIS data sets with the water management relational database
and accessing water management database tables through a GIS interface.
The St. Johns River Water Management District is responsible for managing ground and surface water resources in all or part of 19 counties in northeast and east-central Florida. Resource managers issue permits for various water use activities and activities that have the potential to adversely impact ground or surface water resources. Water resource professionals preserve or restore vital wetlands and water resources, and conduct research about the quality and quantity of ground and surface water supplies. Working together the District will ensure the sustainable use and protection of water resources for the benefit of the people of the District and the state of Florida.
Access to the enterprise database including GIS mapping, provides support for the daily operation of the District. In the past, maps and independent databases of information had to be maneuvered separately. While the staff could access some databases directly, they had to log onto a special system to do so. Custom software was installed on client computers to give users access to the database and mapping tools. Accessibility and complexity of software, training and demand for increased database access lead the District to develop a new approach to accessing critical data.
The District has made significant investments in database and application development, technical problem resolution, staff training, and computer resources. One of the more recent and most exciting investments has been the development of Internet based query tools. These tools provide streamlined methods for identifying, accessing, searching, and analyzing data from Oracle databases of interest for use in various professional functions by District users and its constituency. The ArcIMS based Internet database query tools are part of this project
Esri's Arc Internet Map Server (ArcIMS) provides the foundational technology for the creation of browser-based applications customized to meet user needs. The needs addressed include, visualizing database data and allowing the incorporation of spatial data and non-spatial data from the District's Oracle database. This paper discusses the functionalities required in these GIS Internet database access applications and the development approach for designing the prototype systems, and discussion of the characteristics of the system.
Functionalities
The objective of the GIS Internet database access application is to create a common application to access database and mapping using a single platform, and to dramatically improve access to the data in an Oracle relational database management system (RDBMS) through the use of an ArcIMS interface. The major functionalities include:
1. To visualize the database data. GIS technology is used to unlock the location component of database data and make them available for use in water management daily operations. The majority of water management database data is related to wells, pumps, hydrological monitoring stations, and environmental monitoring stations. The database already contains geographic components of these stations, the longitude and latitude. This application creates shapefiles programmatically from the database data, longitude and latitude, collaborated and projected. These are then served to the web to display as main map layers. These data layers are updated daily based on database updates. To convert the longitude and latitude numbers into more meaningful locations and visualize these stations on a map with geographic patterns dramatically improves scientific analysis.
2. To put the database data into a geographic context. The stations are not the only major layers to be displayed on our map. The map also has layers for land use, hydrography, vegetation, roads, basins, quad basins, planning units, and most important the imagery and digital raster graphics. With these layers, the wells and stations are put into the geographic context into which they exist. These layers enhance capabilities to analyze data in a spatial context. To put stations into comprehensive geographic context, greatly helps scientific analysis because nearly all the water related scientific analysis requires understanding the geographic environment. For example, land use is closely related to water consumption. Hydrography and vegetation are very important to ground water analysis. When stations and wells are displayed upon digital orthophoto, they are literally put into the close-to-real-world context. Users can see the environment where wells and stations exist from the digital orthophoto. This geographic context information is information outside the database. Putting these layers together with the stations and wells adds additional scientific value to the database access and gives more meaning to the data.
3. To enable interactive selection and query of the database from the map environment and to combine spatial selection with relational database query. This application enables users to query the database by selecting the stations on maps on any combination of geographic extent, data content, or predefined SQL queries. From the front, the map communicates with the database. On the back, the application actually combines easy-to-use selection tools to the ArcIMS map to interactively select stations from the map and bundle the selection records with the SQL query. This is then sent to the database for processing. Using map selections to query a database provides a much more dynamic query method. When users select stations from the map, not only do they get the database data, they also have the sense of where the stations are and what the environmental context is. It also makes it possible to use an area of interest to select stations without knowing the station names or IDs. It is a more intuitive method of making queries to the database than replying on the logical formulations of SQL statements. Even beyond that, a user can select the stations based on the area of their interest. No knowledge of SQL is required of the user. ArcIMS uses the area of interest to spatially select stations. The spatial selections are based on geographic data that are stored outside the database. For example, when users submit a query about stations inside a specific county, ArcIMS initiates a three step process: first, query the GIS data layer to find the county; second, use the selected county shape to spatially select stations within the county boundary; third, bundle the stations list into the predefined SQL to query the database. When making a query to the database, the SQL query is based on the station list returned from ArcIMS spatial selection, not the database table field value of county. This is a function that is useful if we do not have a county field in the database table. We could use any map layer to spatially select stations and then query the database. This applies to other area of interest selections, city boundary, site boundary, etc. Even though we do not have the city, site or other area of interest stored in the database table, we could query stations based on these areas of interest because the ArcIMS spatial query capability is added to the traditional SQL query. Integration of GIS data enhances the query ability adding powerful map selection functions for database query.
4. To enable multi-function and multi-format report and to combine database records with locations on map. Split unit reports as well as support for downloading data stored in the database are provided to augment the standard database query report creation and to link reports to maps,. Users get database reports as well as related station maps. Delivering the station map and data report together in one application is a major improvement to database access. Data reports and station maps provide the basic information needed by water management professionals. Integrating two functions into one application streamlines database access and geographic information access. Users can access this information without going into different types of software to create maps and to query the database. It saves time and effort for users to have this one-stop shopping application delivering both the reports and maps they need.
Another very important part of the data report is the downloading function. Users are able to download the database data directly from the application without using other tools. The data report not only serves as a database access tool but also serves as a direct data retrieving tool.
Application Development
The GIS Internet Database Access application takes advantage of ArcIMS and Internet database access. This application contains a multi-component architecture consisting of server, client, and data components. Upon completion, the system was developed using ArcIMS Application Service Provider with added function programmed with ASP (Active Server Page), JavaScript and DHTML. ASP is the programming language used for the database query and for creating dynamic web content). ArcIMS and customized function programmed with Javascript provide the mapping functionality of the system. Oracle database is the database used by the system.
1.Server components
The server components are used for handling database requests and administering
the ArcIMS site and NT service program to create and update shapefiles,
as illustrated in Figure 1. A DSN (data source name) is installed on the
server for access to the Oracle database. A machine data source name (DSN)
stores the location and ODBC driver type of the database connection in
the Windows Registry. An NT server service is created using Visual Basic
programs to read in database station longitudes and latitudes using Microsoft
ActiveX Data Objects (ADO) through DSN to create the shapefiles.
The longitude and latitude are projected into points. Station IDs
and station names are attached to points as basic attributes. As
the shapefiles are updated daily, the maps served to the web contain the
updated version of database data. The shapefiles are fed to a map configuration
file as the main map layer. The map configuration file is made up of other
shapefiles with the unique user-defined symbology. The map configuration
files are the input to ArcIMS Image map services. Maps are generated in
the server and sent to a client as GIS images. This process is illustrated
in Figure 1.
Figure 1. Serve components and processes.
2. Client components
The client component includes the ArcIMS client viewer for accessing,
viewing and analyzing geographic data; the selection engine for interactive
map selection, bundling the SQL query, and requesting database; and the
database report frame which contains database query reports, data download
link and live links to map and sub-reports.
2.1 Viewer:
The ArcIMS map viewer is used to access, view, and manipulate geographic
data. A typical viewer includes a map and some tools for viewing and manipulating
the map display. The ArcIMS viewers are HTML viewers that come with ArcIMS
and are generated using ArcIMS Designer. The viewers are modified using
HTML, DHTML and JavaScript for parsing selection records and communicating
and interacting with the data report frame.
2.2 Selection Engine:
The selection engine includes three parts: the selection tools
that interact with theviewer; ArcIMS to process the selection results;
and Active Server Pages to prepare the SQL query, make requests to
the database, and retrieve results. Selection tools include the following.
1) Selecting by area of interest tool that allows the user to select
a certain area of interest. For example the user could select a county,
basin, city, section/township/range, service area, project area, planning
unit, or quad to select all stations inside that specific area.
2) Selecting by stations tools that allows the user to select the stations
by inputting station names or Ids.
3) Selecting by rectangle tool provides for the selection of stations
by dragging a rectangle box over the map.
4) Selecting by buffered point tool allows for the input of a
buffer distance that selects stations inside the area buffered around
the selected map click point.
5) Selecting by buffered longitude/latitude tool allows users to input
the longitude, latitude and buffer radius to select stations inside the
area.
6) Selecting by area tool allows the selection of area polygon for
all stations inside the specific area. User selection is first handled
by ArcIMS, parsing the selected stations. Then the stations' name list
or ID list is passed to ASP pages. The ASP pages, which in turn, incorporate
the selected stations names or IDs with predefined SQL query clauses; and
then, dispatches the SQL query clauses to the Oracle database for processing.
Microsoft ActiveX Data Objects (ADO) is used to access and manipulate data
in a database server through any OLE DB provider. This process is illustrated
in Figure 2.
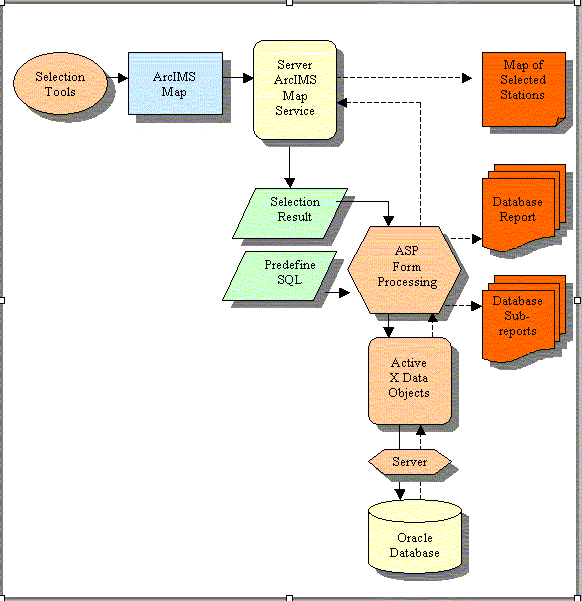
Figure 2. Client components and process
2.3 Data report:
Reports are delivered using three means, sending an image map, reporting
and retrieving database data, and inter-relating data records with the
map and sub-report. The database report communicates with the map. Selected
stations are visualized "where" located on the map. Database records
are linked to each station's location on the map and sub-report. When the
user clicks on an individual record, the map displays the related location
and zooms to the area. The sub-reports of that record also are brought
into the sub-report frame. For example, when users select existing CUP
projects on the map, they have the database reports with the database data
including the project ID, Permit Number, Project Name, Mailing Address,
Issue Date, Expiration Date, Acreage, Well Count, Pump Count, Connection
Count, and Water Allocation. The map will zoom to selected records and
display the selected project in specified symbology. The project ID of
each selected record also serves as a hyper-link. When the user clicks
on project ID, a sub-report of that project is brought into a sub-report
frame with the database data of wells/pumps/connection points of that CUP
project, such as Well/Pump/Connection Point ID, Capacity, Diameter, Depth,
Water Source and so on. The map will zoom to this project with it rendered
in specific symbology. The Well/Pump/Connection Point ID of the sub-report
also serves as hyper-link. When users click, the map will zoom to the specific
Well/Pump/Connection Point. There are download buttons built into the data
report and sub-report frames. When a user clicks on the download button,
the data displayed in the data report frame or sub-report frame will be
downloaded into users' machine in Microsoft Excel format. Active Server
Pages with form processing and ADO are used to build the data report and
sub-report. ADO is also used for Remote Data Service (RDS), which allows
users to move data from a server to a client application.
3. Data components
The data sources include geographic data sources for use with the ArcIMS
and data source that are in the Oracle database. The geographic data sources
include imager catalog, shapefiles and ArcSDE datasets.
4. Application Interface
This application is delivered to users via an Internet website as shown
in Figure 3.
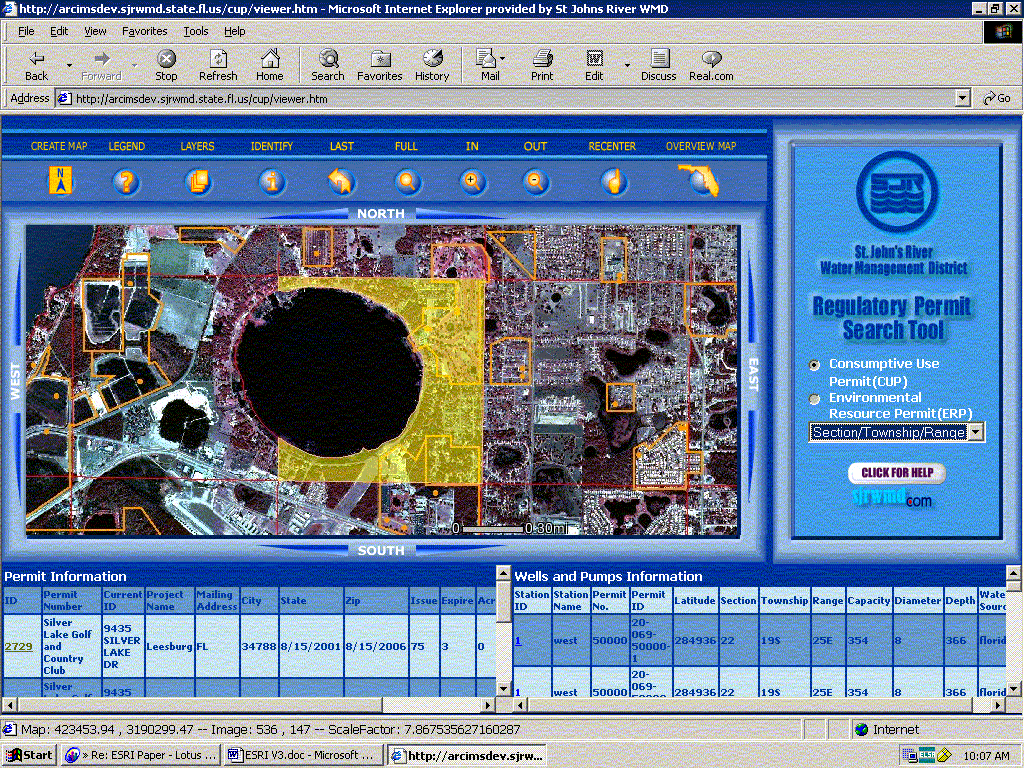
Figure 3. Application deliver web site
Conclusion
This project demonstrated the utility of Internet-based ArcIMS tools as an interface to the relational database and shows that this interface effectively supports the daily operation of the water management district. The methodology of using Internet-based ArcIMS tools for RDBMS access is effective, efficient and meets users' demands in four areas:
1. Integration of different data sources
The key feature of this application is the integration of data from
two different sources, GIS coverage and database data, into a single application.
It not only links the database records with the GIS data, but also allows
users to visualize the database data and put it into a geographic context.
It gets accurate data and services to the professionals who need it for
analyzing data.
2. Information availability
The Internet delivers the application online and makes it available
to more users. Utilizing the Internet for map viewing and data access and
distribution will significantly streamline our operations. This
serves the daily operational needs of the District and also makes
it possible for our communities and constituents to access and use
this information via the Internet.
3. All in one platform framework
It encourages the development, and monitoring of accurate database
data, as well as enabling data sharing with other divisions. It demonstrates
support for the enterprise data warehouse, as well as collaborative inter-division
initiatives.
4. Efficient and cost-effective service
Providing database applications over the Internet using ArcIMS allows
the end users to access this data with a standard web browser. Because
the data is centrally located, it is easily maintained and managed. Installing
and updating users software applications are eliminated, providing for
a more cost-effective computing environment.
Authors:
WeiSun
GISAnalyst, Information Resources
St.Johns River Water Management District
POBox 1429, Palatka, Florida 32178-1429
386.329-4826
wsun@sjrwmd.com
Peggy M. White
Director,Information Resources
St.Johns River Water Management District
POBox 1429, Palatka, Florida 32178-1429
386.329-4338
pwhite@sjrwmd.com
KevinA. Brown
AssistantDirector, Department of Information Resources
St.Johns River Water Management District
POBox 1429, Palatka, Florida
386.329.4894
kbrown@sjrwmd.com