Yield Monitor Analysis in Wheat Using ArcGIS
Dennis L. Wright Jr.
V. Philip Rasmussen Jr.
R. Douglas Ramsey
Doran J. Baker
Abstract: A midseason nitrogen (N) application in wheat may improve
both yield and quality of the crop and minimize N leaching into groundwater
supplies. An experiment using Remote Sensing and a Geographic Information
System (GIS) was designed to analyze various N rates in hard red spring
wheat during an entire growing season. The partners included the
Idaho Wheat Commission, the University of Idaho, and Utah State University
sponsored by NASA. The study site, located in Minidoka, Idaho, was
monitored with imagery from the air, tissue sampling on the ground, and
GIS data from a yield monitor during harvest. Remote Sensing was
useful in identifying N stress and a sprinkler malfunction during the growing
season. ArcGIS was helpful in isolating the causes for crop variability
on a field scale and quantifying yield loss due to the sprinkler malfunction.
Remote Sensing and GIS are tools farmers can use to ameliorate irrigation
and nutrient deficiencies during the growing season and understand crop
growth patterns after harvest.
Introduction
Geographic Information Systems (GIS) have been used for many applications
in natural resource areas including petroleum, mining, marine, forestry,
and agriculture with great success. Environmental concerns and the
decrease in land for agricultural use mandate that many farmers and ranchers
must become better managers in order to produce enough harvest and profit
for continued operation. Many forward-minded farmers have turned
toward technology as an important management tool. Technologies that
help growers today include Internet availability, electronic planting and
fertilizing records, Remote Sensing and GIS. Some GIS applications
in agriculture include yield monitoring, fertilizer maps, soil delineation,
profit maps, and record keeping.
The goal of this research was to use Remote Sensing and Geographic Information
Systems (GIS) to analyze the effects of different nitrogen (N) rates on
a center-pivot irrigated wheat field in Idaho in order to predict if a
midseason application of N would improve both total yield and quality of
the grain. Although the primary focus was to examine the effects
of various N rates in wheat, another important focus was to identify other
factors causing crop variability on a field-scale using Remote Sensing
and GIS. Imagery collected at key growth stages and GIS data from
a yield monitor mounted on the grower's combine were used to characterize
growth patterns over the entire study area.
Methods and Materials
The study site was located in south-central Idaho, along the Snake River
Plain on 60 ha in Minidoka County, Idaho (42º46' N, 113º27' W).
Average annual precipitation is 203 to 279 mm. Average annual temperature
is 7 to 11 ºC. The soil at the Minidoka site is predominately
Minidoka silt loam (Xerollic Duriorthid), with minor intrusions of Portneuf
silt loam (Durixerollic Calciothid). These soils are generally shallow
(150 cm or less) and overlay basalt uplands. The normal crop rotations
for wheat in southern Idaho are wheat/corn/alfalfa, wheat/fallow/wheat,
alfalfa/wheat/barley, potatoes/wheat/corn, and sugarbeets/wheat [Fuchs
and Hirnyck, 2000].
The site consisted of a standard center-pivot irrigated field.
The circle made by the pivot was divided into four quarters with four transects
in each quarter. Transect dimensions were 20 m wide each and the
radius of the field in length.
Four different rates of N were applied to each of the four transects
in each of the four quarters (Figure 1). The first rate represented
a region of no applied nitrogen (rate of nitrogen application = 0).
The second rate represented a region of under-applied N (rate = 40% of
normal). The third rate represented a region of over-applied N (rate
= 130% of normal). The fourth rate represented the "normal" N application.
Within each transect, five points were randomly selected to collect soil
samples, tissue samples, harvest samples, and pixel values from remotely
sensed imagery. Two of the quarters were managed by conventional
techniques to determine N stress (visual estimates of N stress by the farmer)
and the other two were managed using remotely sensed information to estimate
N stress.
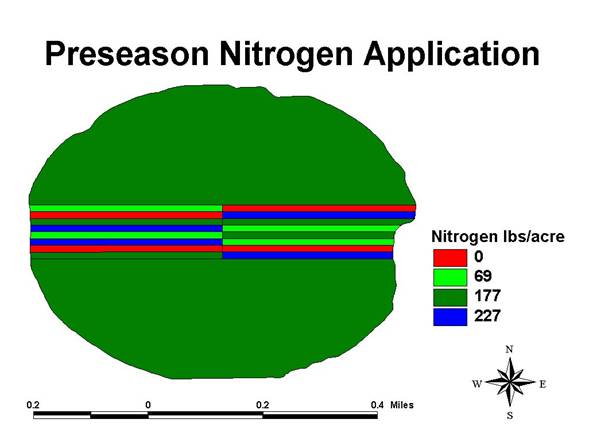
Figure 1. Study Site and N applications
Ground-truthing was performed during the months of May and June to correspond
with imagery and included (i) harvesting tissue samples for laboratory
analysis, (ii) acquiring digital photography to calculate percent cover,
and (iii) using a spectroradiometer to collect ground based spectral reflectance
measurements. All plant tissue samples were processed at Stuckenholz
Laboratories in Twin Falls, Idaho, using the specific ion electrode test
for nitrate-N and dry combustion for total N. Tissue samples were
taken at different locations around the sample points in order to decrease
trampling of vegetation.
Images were collected during May and June with a Real-time Digital Airborne
Camera System (RDACS) [Pearson et al., 1994]. Images from this sensor were
geometrically corrected and converted to a Normalized Difference Vegetation
Index (NDVI).
A combine equipped with an Ag Leader PF3000 yield monitor and a differentially
corrected GPS was used to collect yield data at a field scale. Yield
data were used to evaluate the influence of elevation by segmenting yield
and elevation using a classification of 5 natural elevation breaks [Coulson,
M.R.C. 1987]. Yield averages from each break were regressed to establish
the influence of elevation on yield.
Results and Discussion
As a result of regional energy shortage, the Idaho "power buyback" program
caused growers to cut back on power usage for irrigation. Water application
was restricted to 80% of normal. The grower who farms the study site
reported a 20% reduction in overall yield due to lack of water. This
reduction in plant growth affected nitrogen uptake, thus reducing our ability
to detect variations in N applications.
Imagery examined during the season revealed irrigation malfunctions
from a few sprinklers on the center pivot (Figure 2). The ring close to
the outer edge was the most obvious, but an inner ring close to the center
was also noted. The lateral strips (horizontal) in Figure 2 are the
transects with no applied nitrogen.
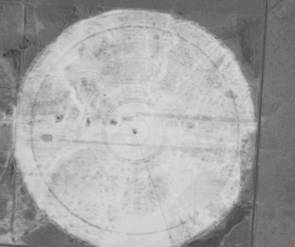
Figure 2. A midseason NDVI image from May 25th
Water Stress
The outer ring discussed in above and seen in Figure 2 was caused by an
undersized sprinkler head. The nozzle was replaced at the heading
growth stage of the crop. GIS analysis from the yield monitor data
revealed the area of the field affected by this undersized sprinkler head
was 1.7 ha, and as a consequence the yield decreased by 670 kg/ha in that
area (Figure 4). The stress caused by the smaller ring was not corrected
during the growing season. The area affected by the smaller ring
was 283 m2, and the yield decreased by 2010 kg/ha in that area.
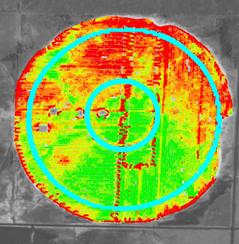
Figure 3. Rings of water stress highlighted in blue on the yield
map.
Nitrogen Stress Analysis
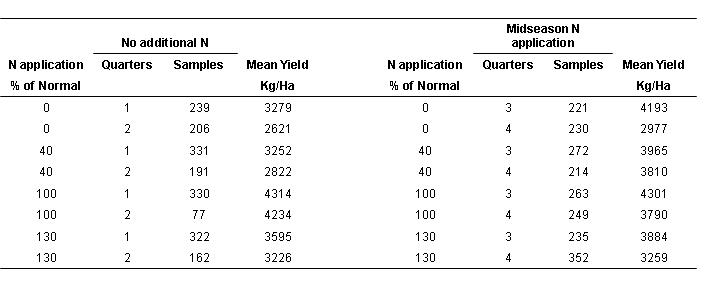
Yield from the quarters managed by conventional techniques (visual estimation
of N stress) ranged from 2621 to 4314 kg/ha (Table 1). The quarters
managed by conventional techniques had no additional N added. The
yield from the transects in quarter 2 was lower than transects in quarter
one due most likely to topographic effects (water variation, slope, aspect,
soil type, texture, etc.). Quarters 3 and 4, managed by remote sensing,
exhibited much less yield variance compared with the variances of quarters
1 and 2, most likely due to the midseason N application. The 0 applied
N on quarter four was an exception because the transects were situated
at a higher elevation and were directly affected by stress due to topographic
effects. These results suggest remote sensing can be used to give
an estimation of N at midseason to improve yield uniformity at harvest.
Table 1. Harvest data from the Yield Monitor
Effects of Topography
The possibility of variation due to elevation was examined in ArcGIS in
order to understand other factors affecting yield variance. An elevation
map was derived from data collected from the GPS on the yield monitor.
Elevation data was examined using a 5-class natural breaks (Jenks) classification
of elevation in ArcMap. Results from this analysis showed the study
site was 805 m in diameter and varied in elevation by 12 m, and that this
elevation difference had a significant effect on yield (Table 2).
The strong correlation between yield and topography (r2 = 0.92)
is shown in Figure 4. Topography directly affected the growth
of wheat, by restricting water flow up to the areas of higher elevation
due to lower pumping pressures. The reduced rate of water delivery
affected the plants directly, as well as the nutrient content of the soil.
Table 2. Comparing elevation with yield
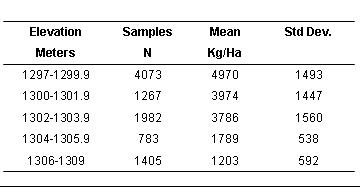
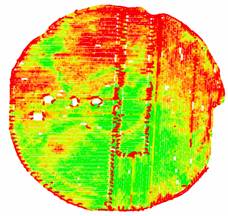
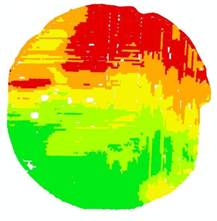
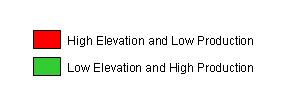
Figure 4. Yield map versus an elevation map of the Minidoka, ID
study site.
Conclusions
The focus of this experiment was to identify different N rates and other
crop stresses in wheat using Remote Sensing and GIS. If N stress
can be identified using imagery, a midseason N application can improve
both grain quality and yield in wheat. Remote Sensing was useful
in identifying N stress and sprinkler malfunctions during the growing season.
ArcGIS revealed the close trend of yield and topography and was used to
quantify wheat yield loss due to sprinkler malfunctions. Three important
causes of variability at the study site were; (i) topography, (ii) irrigation
malfunctions, and (iii) varied N rates. Remote Sensing and GIS are
important tools farmers can use to mitigate irrigation and nutrient deficiencies
during the growing season and understand crop growth patterns after harvest.
References
Coulson, M.R.C. 1987. In the matter of class intervals for choropleth maps:
With particular attention to the work of George F. Jenks. Studies in Cartography,
Monograph 37, Cartographica, 24(2), 16-39.
Fuchs, S.J., and R.E. Hirnyck. 2000. Crop profile for wheat in Idaho
[On-line]. Available at http://cipm.ncsu.edu/cropprofiles/docs/IDwheat.html
(verified 16 April, 2002).
Pearson, J. Grace, G. May. 1994. Crop Stress Detection Using Airborne
Multispectral Digital Cameras. ASPRS/ACSM (1994), copyright ASPRS/ACSM
[On-line]. Available at http://www.odyssey.ursus.maine.edu /gisweb/spatdb
/acsm/ac94058.html (verified on 5 May, 2002).
Acknowledgments
Special thanks to Mike Larsen and Duane Grant who provided the study site,
NASA who made this experiment possible and the ARC and AG20/20 staff from
NASA Stennis, who helped with imagery and technical concerns. Thanks
also to ITD Spectral Visions, who provided the imagery and a quick turn
around when it mattered most.
Author Information
Dennis L. Wright Jr., Program Coordinator
NASA Affiliated Research Center
Utah State University
4140 Old Main Hill
Logan, UT 84321
Phone: (435)-797-0496
Dennisw@cc.usu.edu
V. Philip Rasmussen Jr., PhD.
NASA Geospatial Extension
Plants, Soils, and Biometeorology Dept.
Utah State University
Logan, Utah
R. Douglas Ramsey, PhD.
Director, Remote Sensing and GIS laboratory
Natural Resource Dept.
Utah State University
Logan, Utah
Doran J. Baker, PhD.
Director, Rocky Mountain Space Grant Consortium
Electrical Engineering Dept.
Utah State University
Logan, Utah