ArcFM 8 Water : the solution for the European drinking water company
Authors
Rene Horemans
Bart Reynaert
Paper Abstract
A Belgian drinking water company, Pidpa, has chosen Esri as the strategic partner to work out a data-centric GIS solution for the management of its drinking water network. The objective is to use ArcGIS 8 and ArcFM 8 as an open and generic GIS application with strong emphasis on integration with other information systems e.g. SAP. Pidpa aims to work together with other water utilities to define a standard European data model. The paper describes the challenges and issues for its GIS implementation, the steps taken toward the standard European data model and the vision to use a generic water utility tool for the European market.
Pidpa - the company
Pidpa is a progressive European company, that produces and distributes high quality drinking water throughout the Antwerp province in Belgium (Flanders). We are active in an area of about 2581 km˛ (1000 sq miles), in which we provide more than 1.1 million people with drinking water 24/7. This makes us one of the largests drinking water companies in the Flanders region.
The mission of Pidpa is to distribute high quality drinking water to our customers at a continuous and sustainable rate, because we strongly believe everyone has a right to this vital and primary necessity of life. To accomplish this, we have to maintain a network of 12.000 km (7.460 miles) of water mains in city as well as rural areas. Through 25 water production centers, we yearly produce about 63 million mł (16,6 billion US gal) of water. We mainly work with groundwater that’s pumped up and treated in several steps to maintain a constant quality of our end-product.
An end-product that’s permanently checked in our own laboratory. On a daily base, several water samples are taken on different points in the network and checked to make sure potential water quality problems are detected in an early stage. When some calamities do happen, we are equipped to react quickly to isolate problems in the network, and switch the network to minimize the number of affected customers. And, if necessary, we have alternative ways of distributing drinking water to those customers in the form of small water bags of which we have set up an emergency production line.
But Pidpa’s activities don’t stop at the Flanders borders. We have a vision to develop a global water policy. In co-operation with other organisations, we want to share our knowledge and expertise to make sure that sustainable development in the water sector will still be possible in the future. We do this through active participation in local, European and world-wide organisations and making our customers aware of the value of fresh drinking water. We are even regularly involved in projects abroad to help people accomplish their goals in water production and distribution. e.g. a Pidpa supported a laboratory in China. In the spring of 2003, Pidpa is opening an edutainment-center called Hidrodoe, open for the public with emphasis on the sustainable nature of water.
We invite you to learn more about Pidpa on our website : http://www.pidpa.be and soon at http://www.hidrodoe.be
Why GIS ?
Notwithstanding Pidpa was founded in 1913, and the fact that we have a long history with existing methods and procedures, Pidpa is a progressive utility company that takes a good and efficient service to its customers and partners very seriously. To keep maintaining our water network succesfully, it’s necessary to have accurate and exact information of the location and characteristics of every water main that is in use. This being one of the main reasons to implement a gis : to continuously improve our water network management capabilities.
We have a bit of history in GIS with the start of an IBM GFIS system about ten years ago. But, due to several reasons, this system was never further developed at Pidpa into a company wide multi-user application. So, in 1998 we issued and RFP for a new GIS. Not an evident action for Pidpa, at that time a company in which in house development in an IBM mainframe environment had always been the answer. But following the principle of ‘buy what you can find and only make yourself what you can’t find’ we went looking for rich generic software that would be useable by many and only needs customizing, no actual structural programming. A bit comparable to the ERP philosophy propagated by companies like SAP, from which we have also recently implemented the financial, logistics and HR-modules.
The first contacts with US based constructors learned us though that we do things slightly different in Europe. In an area with dense and old city infrastructure where digital basemap data is not always available, there is a strong need for support of a combined use of raster and vector data, together with specific dimensioning tools. We also needed a Wintel-based solution that could work based on a centralised DB structure, capable of supporting a LAN as well as a WAN with limited bandwidth.
An important strategic demand for Pidpa was that the software had to be open, market standard based and with a large user base. We believed, and still do, that the issues we were confronted with, when implementing a gis and converting a lot of analog data in this gis-implementation, are also issues that will return in other European (water) companies. It is important to bundle & re-use existing knowledge and expertise. Esri Netherlands and Esri Inc. shared this strategic vision and were willing to actively participate in the creation of a functional rich generic multicompany out-of-the-box solution for the European water industry.
Lessons learned
The cooperation with Esri has resulted in a state of the art ArcGIS 8.2 implementation, which has already proven to be a powerful and versatile platform. Due to the efforts, skills and willingness of all parties involved, it was possible to achieve the project goals and proceed in the joint vision to create a solution not only for Pidpa, but for the European water market.
But the road wasn’t always easy and the effort was underestimated by all parties. We started out in the project with a first test-environment based on ArcInfo 7.2, of which we soon realised that it wasn’t the right solution for Pidpa. This technology wasn’t fully capable at that time to support our needs in dimensioning, connectivity & contingency rules and large b/w raster datasets. This setback in the project and some uncertainty at Esri whether to make a specific vertical water market solution or an integrated standard ArcGIS solution with add-ons for the utility sector, were factors in a substantial project delay.
Also working with multiple partners that had a shared responsability, wasn’t always easy. Besides the language barriers, communication and synchronisation were sometimes difficult between all parties involved.
We can now say that a lot of issues were solved and found a good solution in the core software. But some issues are much more difficult to solve then initially foreseen. Performance and printing issues in the use of a large combined raster/vector dataset is not yet optimized in our environment.
Data conversion : a major issue
In the past, all information about our water network was maintained on paper and mylar maps. We had an archive of about 3000 oversize A0 size maps on scale 1:1000 and 175 overview A0 size maps on scale 1:5000. For a complete detailed information about every single piece of our network, we also had about 90.000 A4 size mylar synoptical drawings (no scale). All of these maps were stored in large map drawers, with a copy in each Pidpa office. Evidently this distributed analog way of working created problems to keep all these maps up-to-date and syncronised. Evolving to a centralised gis solution where everyone looks at the same dataset and all edits are done only once, was the only feasible solution.
This large amount of paper and mylar maps were a challenge to all parties involved. All maps had to be scanned, and after some processing stored in a file structure and georeferenced into a grid (Image Catalog) for scale 1:1000 and 1:5000. The goal here was to create one hybrid
seamless map, that could be used in ArcGis to enter new network data and vectorise existing data on the scanned maps. We won’t be vectorising the entire topo-data, but will be acquiring this basemap data from official organisations in Belgium over the next 10 years.
In addition, about 7% of our area was already available in vector format from our IBM GFIS system and needed to be converted. We had to go a long way with Esri to accomplish this, but we can say eventually the necessary results were reached, so we were able to integrate this data in our new datamodel.
Last part of data that needed to be converted is topographical data, we acquired from CARDIB, a Belgian governmental organisation, that made large scale reference map of some municipalities in our distribution area. This detailed and topographically correct basemap data, will be used in the gis as a replacement for a number of scanned map sheets.
Generic datamodel for the European Drinking Water company
It was very important to us to create a rich and generic datamodel that could be used as a base by more companies than only Pidpa . We’ve spend many days working on this datamodel that’s based on the Esri Water model, but refined using our knowledge of the European Water Industry. The model we now have is quite big with a large number of possible features and attributes that can be stored. All being items that can occur in our and other drinking water networks.
Since the model is made and maintained in Visio, it is easily possible to implement this datamodel and use whatever features that are needed. In the generic European solution context we propagate this model as an open base-model, that can be used and implemented by other companies in Europe. We invite other companies to contribute to this model to enrich it even more.
Implemented solution : ArcGIS 8.2 & ArcFM 8.1.3
We now have an ArcGIS 8.2 implementation up and running as the base solution to accomodate up to 11 concurrent editors that use the ArcInfo functionality, and up to 7 concurrent viewers that use the ArcView functionality. The entire graphical part of water network maintenance is now done with gis (except the synoptical sketches that are drawn in an AutoCAD implementation).
Additionally, all these users also use ArcFM 8.1.3 from Miner & Miner. ArcFM offers some extra handy user-friendly tools like :
As shown in the schematic above, there also is a small amount of custom tools developed by Esri. Most of these tools have the status of a sample tool that one day might become part of the core software functionality, and are described more in detail a bit further in this paper.
This software implementation is based on a central SQL*Server 2000 database, in which we now store all vector data, and in the near future we will also store our 3000 raster maps that are part of the hybrid seamless map.
Hardware & a Citrix thin-client solution
Pidpa has two main offices that are situated about 30 km apart and are linked by a 2 Mbit leased line. A capacity that’s not exclusively available to gis, but has to be shared with a large number of other office applications like SAP, CIS, MS-Office file traffic etc. for about 100 people.
Since a lot of gis-users had to be able to work from the remote office, we chose a Citrix thin client solution. A difficult implementation, but after the system was finetuned and some Citrix/Esri software related issues were resolved, we can now say this is a wonderful solution for companies that have to coop with bandwidth limitations. Another advantage of the Citrix configuration is the centralised application setup. When a new release needs to be implemented, it’s just a matter of upgrading the central application server and at the next logon everyone can use the newly installed functionality. All the user needs, is a Citrix client installed on his machine.
In our configuration for 11 concurrent editors and 7 concurrent viewers, we chose two Dell 4-way iP Xeon 700 machines with 1.5 Gb RAM as the application servers. The database server is a 2-way iP Xeon 700 machine with 1.5 Gb RAM that’s directly connected to our central storage (SAN) to store the database and raster data.
Custom Tools
ArcGIS and ArcFM are both products that are described in detail in many papers and documents, and need no further description. In this section we want to give an overview of the custom developed tools by Esri Inc. and Esri Netherlands that are part of the Pidpa implementation and run on top of these two applications.
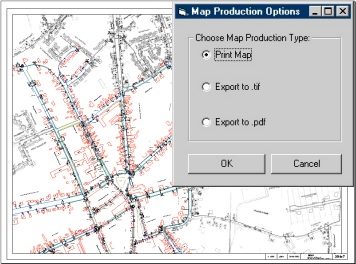
Map production tool
We have been used to work with standard defined maps for a lot of years at Pidpa, a habit that is hard to immediately leave and go to a paperless situation. The standard printing functionality in ArcGIS didn’t provide for standard pre-defined map sheet printing, so a map production tool was created. With this tool, it is possible to select one or more frames from a map grid (we have two, one for scale 1:1000 and one for scale 1:5000). These selected grid-features will be the base to generate always the exact same area on a map sheet. We use a Stored Template as a base for the map generation to have a logo and frame around the map, which is completed by information like the user, date generated and map number. The tool is based on an .ini file, in which it is possible to set different settings for page format, scale settings etc. and which layers should be switched on for the print.
In the tool there’s also a possibility to use map blowups, that can be positioned permanently by an editor in the default database so, every user can get the same blowup. Specific about our blowup system, is that it doesn’t just zoom, but it also gives the possibility to display different layers than used in the map extent.
In the map production tool, there’s an option to directly print to a large format printer, create a print file for later printing through a batch procedure separatly from the gis, or export to .pdf of .tif G4 file format.
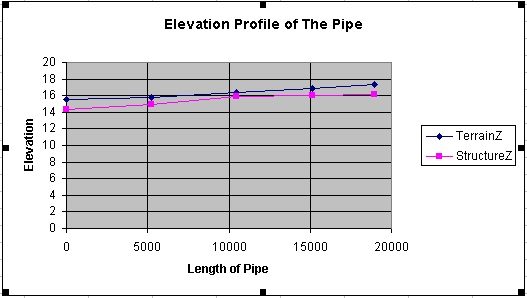
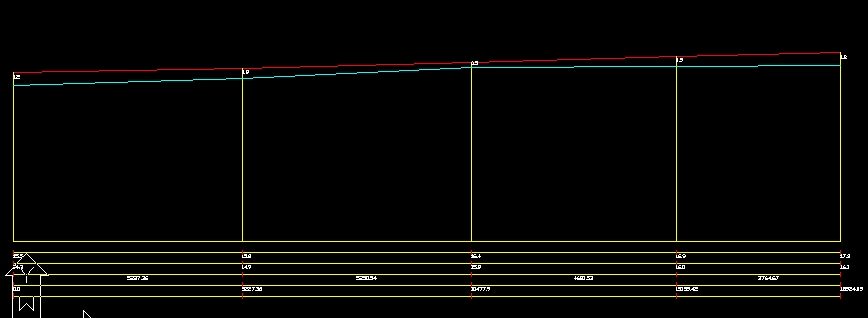
Profile tool
We have a custom made profile tool, that works based on an .ini file in which the layers are mentioned that contain extra depth points to create a length profile. The profile is created based on values in the gis, but the graphical part is generated by the graph module in Excel and then exported to a .dxf file. The result will be used further in AutoCAD drawings.
XShapes
At Pidpa we have always used maps on scale 1:000 and overview maps on scale 1:5000. Due to specific problems such as two water mains that are close to each other and would become one big fat line on scale 1:5000, Esri has developed a specific tool. Goal of this tool is to maintain a second feature for each water main, and other major parts in the network, with a minimum of effort for the editor. In the gis it’s no problem to zoom in and out, but given the fact that at the moment we’re still working with paper maps in the field, this functionality was necessary.
Each time we draw a main, valve or hydrant, automatically there’s an extra feature created for display purposes on scale 1:5000. These automatically generated features are put into position by the editor, and stay linked to the original main base-data that was drawn on scale 1:1000.
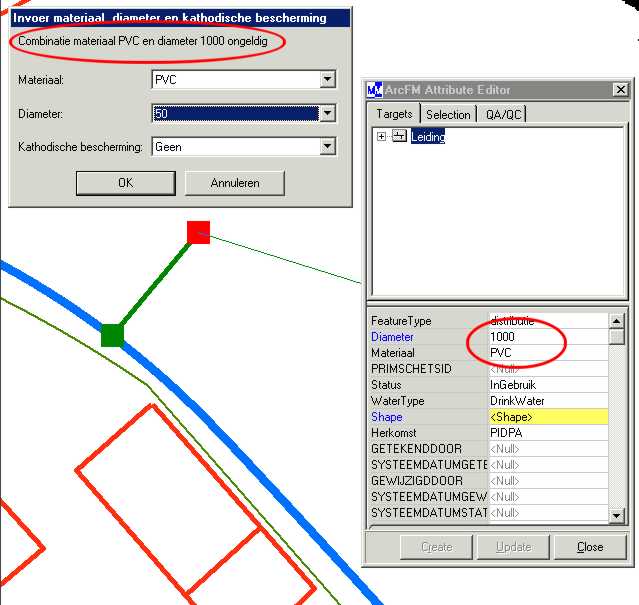
EditorExtension
The Editor Extension was created by Esri NL to make sure that all data entered in the database is as correct as possible. The editor extension contains what we call contingency rules, a functionality that wasn’t available in the standard product range at the time of implementation. One of the main things that was constructed here, is the possibility to check, based on tables in an access database, which diameter/material combinations are possible for water mains.
Another functionality of the Editor Extension is, that when a valve, hydrant or other network part is placed, they can be rotated automatically into the right direction. This functionality was expanded with an extra tool that makes it possible to easily flip a symbol from one side of the main to the other.
There’s also an extra function to delete water mains. In the standard software it was possible to delete a water main, while there were still valves, hydrants etc linked to that main. This is prohibited by the editor extension. When a user tries to delete a main, he will be made aware that he needs to use a special tool that deletes the water main together with the items that are attached to it.
Versioning
The versioning structure we use, is based on one central production version (sde.default) that’s permanently available for viewing and can be used as a base for editing for each editor. But no one can edit directly on this sde.default version. For each job that needs to be drawn, an editor will create a new protected version that’s based on the sde.default version. In his own version he performs the necessary edits and, when the job is ready, he saves his version.
When this is done, he notifies a supervisor that the work is finished and ready for QA/QC. The supervisor then takes ownership of this version through a specific function written by Esri NL. When the edits are approved, the supervisor reconciles the version to the sde.default version, resolves occuring conflicts and posts the version through a custom written post-to-sde routine. When this is done, the supervisor deletes the edit version.
When there should be extra edits necessary in this version by the editor, the supervisor also has the possibility to use the give ownership function and return the version.
CIS interface
There is an interface made to our Customer Infomation System on IBM mainframe that’s linked to a DB2 database. By connection id’s, which are put on the map, we can use this function to get data out of the DB2 environment through ODBC . In an .ini file a query can be constructed to get the necessary data out of the database.
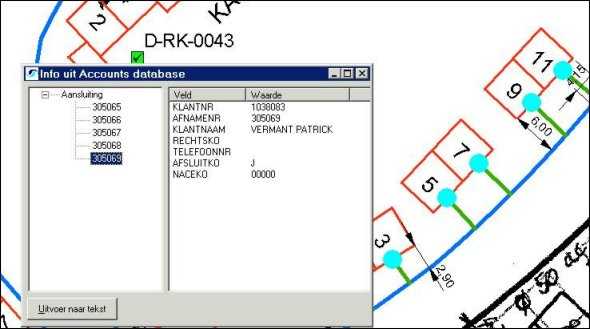
This is just a basic interface that will need expanding in the future.
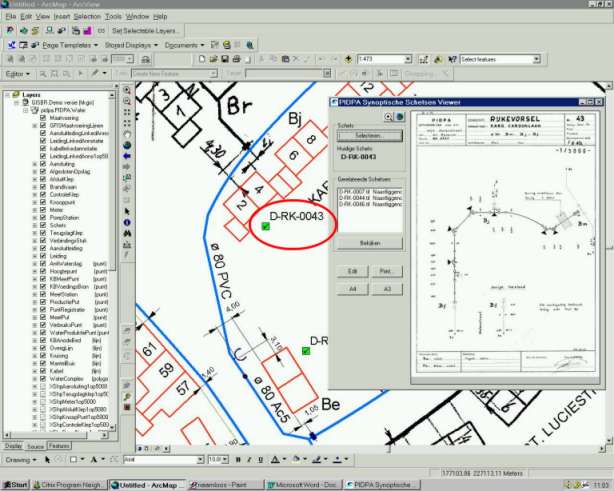
Synoptic sketches tool
As mentioned before, we have about 90.000 synoptical drawings in raster format that need to be accessible from the gis. We are working on a gradual vectorisation of this 90.000 drawings, but this is a slow, time-consuming process. A viewer was built by Esri NL in which municipality name, main type and sketchnumber are the parameters on which a sketch can be selected. When a certain sketch is selected, the viewer determines whether there’s a .dwg sketch available that can be shown in an embedded .dwg viewer. When there is no .dwg file available, a .tif file will be shown.
All sketches are linked to each other through referrals. It took us about a year to catalog all references between sketches, but they now are all available in one linked list of sketches . When a certain sketch is shown, a list of sketches that are linked will be available. By clicking on one of the listed sketchnumbers, another file is opened. This gives us the necessary means to ‘browse’ through the library of sketches.
Main Isolation Trace
When there’s a breach of a water main we want to be able to use the gis to determine which valves should be closed to isolate that specific water main. But also as a result of that action, which other water mains will go dry and which customers are affected by the problem in the network. Something we can’t use just yet, because most of our data is still in raster format, but it will be very usefull in the future.
Pressure Zone Trace
This tool allows the user to select a point along a mainline to indicate a main that is part of a larger pressure zone. It trace the water network in all possible directions until either sources of water or assets that isolate water flow are found. The user will have the option to assign a pressure zone identifier to the highlighted junctions.
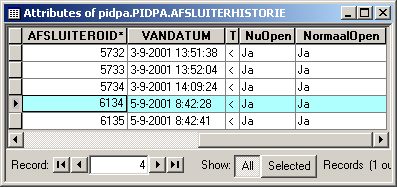
Valve History Table
For each valve we can store a current status and a default status. The current status field is linked to a valve history table. Each time we change the status of a valve, the tool writes a record to this table. So, it will be possible to retrieve the status of all valves on a certain date.
The road ahead : interfacing to other information systems
We’ve always made an important issue out of linking the gis-data to other information systems that are in use troughout the company. After all, the majority of data that’s available at Pidpa, can in one way or another be linked to a gis-feature. Being it connection numbers, sketch numbers, order or project numbers from SAP or a simple street somewhere in our distribution area, it all has a geographical component.
At the moment we already have an active link to our library with synoptic sketches and it is possible to get customer information through an interface to our CIS. But we want to go much further than that in a second phase of the gis-implementation. The CIS-interface will be further developed and there will be an integration with our SAP environment. Several SAP-modules are up and running and provide us with a vast database of information. It’s only logical that we try to link and even integrate the gis with SAP on different levels. Sharing data between these two environments, and optimizing workflow over the boundaries of information systems where users can easily get to the data they need in a user-friendly environment, is a major goal for the future. At the moment we are looking for companies that have experience in such a gis-sap integration that are willing to share their experiences in how this can become reality.
Using gis-data in advanced hydraulic modelling software, is one of the more ambitious goals for the future that will be worked on in phase 2 of this implementation. We want more than a one way export possibility for gis-data and want to further use the results from analyses and simulations made in an hydraulic modelling software in the gis. So, an integration of data between these two systems is the ultimate goal.
Another future goal is to implement an ArcIMS based solution to make the GIS-data accessible to all users in the company through a flexible browser-based interface. An interface in which the complexity of the ArcGIS implementation is reduced to a more widely distributable level. At first a solution to be used in an intranet context, but later on also in an internet context to let external parties access our geodata online.
Last but not least, we are also planning to make the gis-data digitally available in the field through a user-friendly interface on hand-held terminals or ruggedized laptops installed in cars. There is still a long way to go to accomplish this, so a phased approach is probably the best solution in which we’ll evolve from viewing gis-data locally in the field over on-line querying to even editing or redlining data in the field and automatically entering that data later on into the central database. A project with ambitious goals that will not only know the gis-component, but will need integrating with other information systems.
For more information about the implemented GIS at Pidpa, please feel free to contact us :
| Rene Horemans : Bart Reynaert : |
GIS Project Manager ICT consultant |
|
Pidpa Desguinlei 246 B-2018 Antwerpen Belgium |
Tel. +32 3 216 88 00 Fax. +32 3 260 60 03 e-mail gis@pidpa.be |
Pidpa will be participating at the
17th European User Conference : Bruges (Belgium) 14th – 16th October 2002