AMIS: Least Cost Path Analysis For Transportation Planning
Background and Context
This paper
describes the design and evolution of a GIS-based corridor route planning tool
called Analytic Minimum Impedance Surface (AMIS). The requirement for AMIS was specified by a
local State Highway Agency (SHA) which requested an
GIS-based analytic tool that would facilitate choice of a route corridor for
the proposed interstate highway running through southern
Process Goals
To better achieve these specific outcomes, the corridor-planning tool was designed by the University of Kentucky Transportation Center according to a process grounded in decision theory literature. We began with the assumption that a well designed decision support tool for participants in such a process should help them determine criteria of significance, assess the importance of each criterion and also, in some cases, allow them to quantify tradeoffs between each pair of criteria. It should provide an output, usually a priority setting, with respect to the various user-defined inputs. It is not intended to form a rigid a priori framework to be imposed on participants. A formal system with such properties is termed a Decision Support System or DSS (Miser and Quade 1985).
We engineered a DSS based on the concept of the least cost path. However, the notion of cost, or its spatial equivalent of impedance, was treated as a complex, multidimensional and not necessarily monetarily-based variable. This impedance variable was composed of the sum of a number of individual impedance elements, each of which was an attribute with a location. The GIS was used to sum the value of all impedance elements for every cell in the corridor study area. The result is a continuous geographic surface that summarizes scores pertaining to routing preferences and obstacles. This surface contains the detailed information needed for coherent planning and the combinatorial scoring useful for exploratory corridor testing. For example, the GIS automates the process of finding the least-cost path between two specified points and offers scaled, graphical output of the result. The GIS software selected to run the least cost path model was Esris Arc/Info and Arcview. This decision was based on the grid-based tools available in both Arc/Infos GRID extension, as well as within Arcviews spatial analyst. Additionally, this simplified development and data transfer concerns since the SHA also had an installation of Arc/Info already in place.
To address the project goals specified above we conjoined a rigorous spatial analytic framework, in the form of a raster-based GIS, Arc/View, with a robust rational choice decision methodology, the Analytic Hierarchy Process or AHP (Saaty 1980). This is the origin of the term Analytic Minimum Impedance Surface, AMIS. Functionally, AMIS therefore combines the data-handling and geographic analysis capabilities of a GIS with the structured input and scaling tools of Multi-Criteria Decision support software. AMIS breaks new ground by combining system priorities, such as economic development and connectivity improvement, with varied but specific on-the-ground features, such as wetlands, schools, median incomes or areas where endangered species are located. Both the system priorities and features can be user-specified. Input is in both written and electronic data format, while the output is displayed on standard GIS software. While AMIS was conceived for a specific project, its modular design allows easy transferability to other contexts.
Another goal of formalizing the selection criteria was to increase stakeholder satisfaction with the development and provide a less contentious and fractious outcome. Decision theoretic literature contends that policy decisions are often based on invisible or surrogate criteria that is, participants may not be offered a framework that permits articulation of their true goals, or in other cases, support or resistance for a project is couched in tactical terms. For example, specific locational choices may be protested although opposition is in reality formed in principle to the developments goals rather than its specific form. In many cases this has led SHAs to regard public input as problematic and negative, rather than as a constructive idea.
Predicated on the belief that public involvement is a critical and a highly desirable component of any transportation modeling system, articulating and clarifiying individual values and views is, therefore, of fundamental importance. Yet, in the absence of a formal, analytical framework for capturing and incorporating these values, competing and often fractious views render goal-setting intractable, or result in compromises which are viewed as unsatisfactory even by those who contributed to them. One of the major reasons for this outcome is that the weighting system is often not rendered explicitly, and participants are left wondering whose views have more weight, and why (Keeney 1988). It is therefore helpful to structure the problem in such a way that participants feel they are making a genuine contribution to goal-setting, and that their individual voices all count. (Keeney and Raiffa 1993). To do this, we employed a hybrid Analytic Hierarchy Method. We term the resultant process hybrid AHP since it combines both classic AHP methodology with a traditional weighted mean approach.
Furthermore, iterative adjustment of model parameters based on expert opinion usually produces more satisfactory outcomes. We believed that these features of the method would reduce apprehensions that participants may have regarding the black box phenomenon that is, an uncertainty based on feelings of lack of knowledge and powerlessness. Previous experience with the application of multicriteria techniques to large-scale, complex and contentious public policy and environmental management problems supports this view (Ridgley and Rijsbermann 1992).
AMIS was therefore built by means of an iterative process that incorporated input from as many sources as possible. In its prototype form, this represented input from a variety of federal and local government SHA representatives, including Engineers, Planners and Environmental specialists. This process took place over a period of approximately six months, with sets of meetings being held to move through the design stages. Facilitation methodologies were employed at each of these meetings to maximize stakeholder input.
The Design Process
AMIS was built in two stages. First we designed and computed the multicriteria priority model and then we computed the GIS impedance surface. The multicriteria priority model was structured around a three-layer information hierarchy comprised of:
Ë surface data elements (originally 69 of these).
Ë affinity groupings of the 69 data elements (5 total)
Ë FHWA Purpose & Need categories (8 total)
The multicriteria model was designed to assign each of the elements a final impedance score that could be assigned to a specific feature in Arc/Info.
The initial 69 elements represent two data origins. First, we began with a number of elements that had already been identified as important during preliminary planning for the proposed interstate highway. These were already available in specific databases. We added to these elements identified as conceptually desirable and then attempted to identify specific data sources for the additional elements. During the following iterations, data limitations encouraged the rejection of 19 of these elements. There were two reasons for these modifications. In some cases, good quality coverage (uniformity) could not be assured for the entire study area. Other elements were identified during the review process as overlapping and reductive selections were made. The final AMIS contains 50 data elements.
A series of three meetings were
held. First, the participants were asked
to specify an exclusive membership for each of the 69 elements in a category
called an affinity grouping. This
required definition of five appropriate classes. The outcome of this stage is specified in
Table 1. Then the individual elements were each assigned an impedance score
from 1-10 points. Mean impedance scores
were then calculated for each element (Table 2 shows a sample of these). At the following meeting, affinity groupings
were categorized in order of importance for each of the
Three P/Ns were specified for this corridor, which meant that we were able to incorporate these directly into the model. We then averaged the priority setting for each of the affinity groupings to scale the raw elemental impedance scores. This produced a unique impedance score for each element that represents a combination of its individual raw impedance and the priority of its affinity grouping. This affinity group priority was determined both by pairwise comparison among other affinity groups within single FHWA P/N and also by the relative priority of the P/Ns deemed applicable to this interstate corridor.
Pairwise comparison was used for both of these steps. For the pairwise comparisons, we presented choices in the form of a continuous, unbroken line marked only at its endpoints. These preference orderings were gridded to produce an integer score from 1 to 10, and each of the preference pairings were summed for all meeting participants.
At all stages of the elemental
specification and scoring, work was conducted in a facilitated workshop
setting. This allowed participants from
diverse knowledge bases to educate and inform each other, creating a base of common
understanding that resulted in greater agreement about priorities. This structured approach to participation
helps create an atmosphere of informed judgementjudgment
and yields information that is arguably superior to simple survey-type
preference gathering. In other research
we have found that facilitated group sessions do in fact increase understanding
and agreement within a public group about preferences. Thus it increases the
reliability and accuracy of mathematically averaged scores (Bailey, Grossardt, and Brumm 2002).
To perform the AHP computations, the Java-based web software HIPRE was used. This offered an advantage over proprietary software such as ExpertChoice in that being web-based it was accessible by all stakeholders. Regardless of location, each stakeholder could view graphically the preference orderings generated by the AHP and perform dynamic sensitivity analysis (Figure 1 for example). The final Analytic Impedance Value was then ready for input into the GIS.
The GIS database for AMIS was constructed to the same resolution as the underlying terrain data, USGS 30 meter digital elevation models (DEMs). This was selected to simplify data conversion and also to approximate an absolute minimum width for an interstate highway corridor. Although a larger cell size would have more accurately depicted the actual right of way required for a highway corridor, it would also have meant that the effective scale of the data would be reduced with concomitant accuracy loss. The 30 meter size was therefore selected as a necessary compromise.
Data for the GIS came from a variety of sources within the state and federal government. Most of the data was obtained directly from state agencies via the WorldWideWeb. Nearly 80% of the data could be assembled for analysis of a similar route within two weeks. Thus, the AMIS approach offers a much more rapid assessment than conventional contracting processes. Some of the data was more sensitive and required non-disclosure forms, to protect the location of fragile resources from public release.
All of the vector data was converted to raster grids within Arc/Info. The integer value of each grid cell was taken directly from the calculated AHP values for that data layer. Once all the raster layers were completed, Arc/Info then added the values of all cells in the corridor study area. The result is a cost surface, representing the sum of all the calculated costs on a per-cell basis.
Figure 1: Cost Surface Map
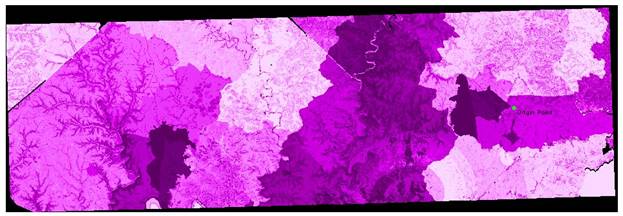
This cost surface was then used within GRID to create a least-accumulative-cost distance map to a source cell. Using the Costdistance command, this layer then represents the total cost from the source cell, or origin point for the route, to any other point within the study area. So, if the cell immediately adjacent to the origin point had a total (summarized) cost of 100, it would be a cost of 100 to travel to that cell from the origin. If the next cell in a particular direction had a cost of 150, then the accumulated cost to get to that cell, 2 cells from the origin, would be 250, and so on. This travel cost surface is then used to determine the least cost path between the origin point, and points anywhere on the surface. The end result is a route of grid cells, one cell wide, that delineates the least cost path between the two points. Using Avenue scripts within Arcview, the routing function is invoked with a button, which then allows the user to specify where in the corridor the route should terminate. Arcview then determines the least cost route to that cell and draws it onscreen as a graphic element. Choosing different endpoints is possible with a mouse click, but choosing a different origin point requires recalculating the least-accumulative-cost distance surface.
Advantages
AMIS offers both process and analyses advantages over more traditional, unstructured methods of corridor selection. First it encourages the explicit incorporation of specific systemic goals in the initial stages, such as FHWA Purpose and Need categories. This opens a discussion that helps clarify the goals of route planning. Second, the formalized approach to priority-setting reduces the potential for conflict and enhances the consensual strength of the outcome. Third, planning priorities can be customized for individual projects, or planning priorities can be mixed over different sections of the same route.
AMIS is designed to be formal in its application, but flexible in its scope. So while the process is the same for different corridors, the values chosen and the comparative priority of goals might not be. AMIS thus offers a customizable framework around which specific projects are built. Not all of these features have been employed in the prototype model, for logistical and practical reasons. Nevertheless, they are important for future development of the system.
Features and Output
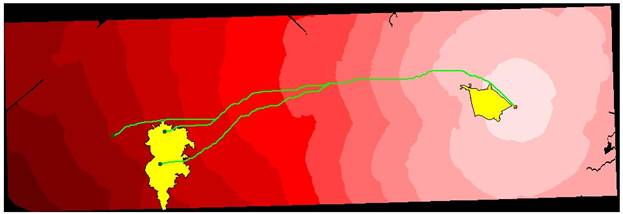
AMIS can specify an optimum corridor. Besides simply providing a "best path" based on the data, AMIS can be used to explore the costs of various trade-offs against the rest of the cost surface. For example, the total offsetting costs for accomplishing a particular routing (say, near a tourist attraction) can be estimated through adjusting the attractor value assigned to the feature until the optimum route chooses that path. Alternatively, a set of required coordinates can be specified to AMIS and it will produce the optimum path that includes these specified locations. AMIS can also be used to evaluate the overall score of specified paths, and determine the number and nature of features contained within a proposed corridor. This is particularly useful in the context of complex problem solving outside the bounds of surface features.
Figure 2: AMIS routings from one origin point to three separate destination points
Users and Uses
AMIS has the potential to be implemented immediately for a variety of uses. For example, for new corridors AMIS can be used in a long-range planning sense to explore the early implications of potential corridor locations. It can also explore modification options for existing corridors, such as road rehabilitations, by mathematically summarizing potential obstacles and issues near a current corridor. Paper maps cannot juxtapose any two data layers real-time as AMIS can.
Public Information Gathering and Dissemination: In a public meeting, the relative importance of known features, or the existence and importance of new information about the landscape can be solicited and incorporated in a measured and fair manner, reducing conflict later on.
AMIS currently exists as a coherent and unitary Geographic Information gathering and processing tool, from which the outputs can be produced by UKTC personnel. But within the current conceptual framework, there are a number of specific implementations of AMIS that could be created for particular purposes beyond those originally specified. These include:
i. Design: In terms of road topology, AMIS can be configured to allow design engineers to find the path of least horizontal and vertical curvature across the landscape. It can provide the initial overview of wetlands, geology, historic and archeological barriers to a corridor. Other packages could be coordinated with AMIS to compute the cut and fill of a given roadway, depending on the accuracy of underlying data. Changes in route could be quickly and efficiently evaluated, reducing down time from unexpected changes.
ii. Planning: AMIS could be used to solicit and incorporate public input on the relative importance of various cultural, natural, and tourism features of a locality. Even consideration of Community Impact and Environmental Justice criteria (FHWA 1996) could be accommodated within the structure of AMIS. While certain of these concerns are already included under the current implementation, future versions would allow real-time incorporation of public preferences into the model for immediate feedback, perhaps through web interfaces. The logic of decisions being made could be documented to reduce potential public misunderstanding of the project process.
iii. State-Wide: AMIS could serve as the common Geographically-referenced information resource for a given project from the ADD to Planning to Design to Construction. Secure websites could be constructed through which all the pertinent information could be accessed by professionals.
Project Outcome Summary
Although we believe that AMIS offers a number of advantages over traditional corridor selection methods, there are several shortcomings to the prototype version. In the AMIS build process, we discovered the FHWA Purpose and Need requirements after we had specified the elemental affinity groups. Introducing these into the analysis resulted in an out-of-sequence three level hierarchy. Further, because of budgeting constraints, the interfaces are quite spartan and seamless software integration was not an affordable option. Parts of the tool were assembled from freeware to save money. Therefore, accessibility is poor, transparency is limited and so the tool is unwieldy. This was also reflected in the SHAs view that the tool was logically too demanding for presentation and explication in public forums in its current form.
Effort should now be directed at implementing AMIS with appropriate software that fully integrates the build process and provides a smooth all-in-one corridor comparison and optimization tool. To accomplish this, desirable technical enhancements include integration of data handling to permit one-step AMIS build all the way from the initial preference hierarchy through the final GIS platform output. This task requires matching of software data-handling and formatting capacities and is likely to prove intensive.
References
Bailey, Keiron, Grossardt, Ted and Brumm, Joel. (2002) Community Design of a Light Rail
Transit-Oriented District Stage I Report for Transit-IDEA T-33.
Expert Choice (2000) http://www.expertchoice.com
Grossardt, Ted, Brumm, Joel and Bailey, Keiron (2000) Whose Road?: Translating shared meaning into a line on the ground, Presentation, Association of American Geographers annual conference, Pittsburgh, April 5 2000.
HIPRE. http://www.hut.hipre.fi/
Keeney, Ralph (1988) Structuring Objectives for Problems of Public Interest, Operations Research 36(3): 396-405.
Keeney, Ralph and
Raiffa, Howard (1993) Decisions with
Multiple Objectives: Preferences and
Value Tradeoffs,
Miser, H. and Quade, E. (eds)
(1985) Handbook of Systems Analysis: An Overview of Uses, Procedures, Applications
and Practice,
Ridgley,
Mark and Rijsbermann, Frank
(1992) Multicriteria
Evaluation in a Policy Analysis of a
Saaty, Thomas L (1980), The Analytic Hierarchy Process, NY, McGraw Hill.
Table 1: Original Criteria Grouped by Affinity
|
Environmental |
Man-made public features |
Dirt and rock |
Socioeconomic |
Regulatory practices |
|
Unique habitat |
Hospital |
Oil and gas wells |
Land value |
Picnic area |
|
Large viewshed |
Water tank |
Mine |
Poverty rate |
National properties register |
|
Archaeological feature |
School |
Strip mine |
Median income |
State park |
|
Historic feature |
Public Water Supply |
Quarry |
Population growth rate |
Wild and scenic river |
|
Streams |
Airport |
15-25% Slope |
Community impact |
Public campground |
|
Wetland |
Sewage treatment |
10-15% Slope |
|
Wildlife management area |
|
Prime farmland |
Church |
5-10% Slope |
|
Endangered species |
|
Fish hatchery |
Pumping station |
Slope |
|
National forest |
|
Springs |
Cemetery |
Slope |
|
Superfund site |
|
Sink holes |
Pipeline |
Rock base |
|
Close to natural attractions |
|
Known caves |
Golf course |
Mixed/unknown base |
|
National park |
|
Underground fuel tank |
Powerline |
Soil base |
|
Military installation |
|
High probability of caves |
Armory |
Soil classification |
|
|
|
EPA project sites |
Railroad |
|
|
|
|
Low probability of caves |
Power plant |
|
|
|
|
Tire dump |
Water filtration |
|
|
|
|
Landfills |
Radio tower |
|
|
|
|
Hazmat |
Dams |
|
|
|
|
|
Electric substation |
|
|
|
Table 2: A Sample of Original Raw Impedance Scores for individual elements
|
Four F Property (National Register) |
51.9 |
|
National Park |
46.8 |
|
Endangered Species |
36.1 |
|
Military Reservation |
33.3 |
|
Superfund |
31.5 |
|
Wild and |
24.8 |
|
25%+ Slope |
24.5 |
|
Threatened+Endangered Habitat |
24.4 |
|
National Forest |
23.7 |
|
State and |
19.7 |
|
State Park |
18.6 |
|
Historical Feature |
18.5 |
|
Dams |
13.9 |
|
EPA Project Sites |
13.9 |
|
Wetland |
12.7 |
|
Public Water Supply |
12.2 |
|
Railroad |
12.1 |
|
High Probability of Caves |
11.9 |
|
Campground |
11.6 |
|
BREAK IN DATA: ELEMENTS EXCLUDED TO SAVE SPACE |
|
|
Electric Substation |
5.2 |
|
Pipeline |
5.1 |
|
Population Growth Rate |
4.9 |
|
Powerline |
4.6 |
|
Mixed/Unknown Base |
4.4 |
|
|
4.3 |
|
Soil Base |
4.1 |
|
10-15% Slope |
4.1 |
|
Strip Mine |
4.1 |
|
Rock Base |
3.9 |
|
Soil Class |
3.8 |
|
Bridge Crossing |
3.5 |
|
5-10% Slope |
3.1 |
|
Golf Course |
2.9 |
|
Low Proability of caves |
2.5 |
|
0-5% Slope |
1.8 |
Table 3:
Ë System Linkage
Ë Capacity
Ë Transportation Demand
Ë Legislation
Ë Social Demands or Economic Development
Ë Modal Interrelationships
Ë Safety
Ë Roadway Deficiencies
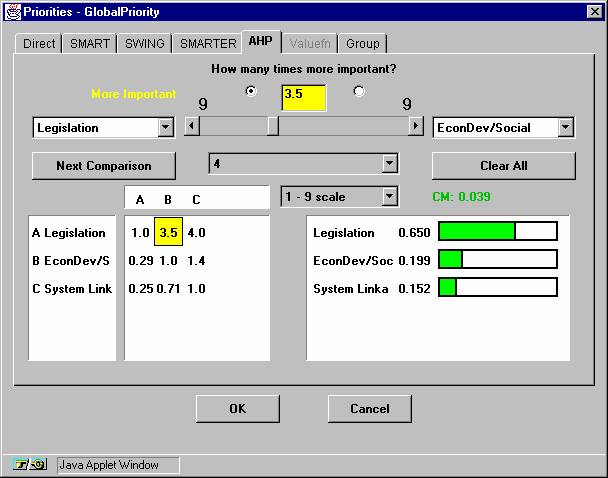 |
Appendix 1: Example output from HIPRE showing FHWA P/N system prioritization for the proposed interstate highway.
Appendix 2: Final AMIS scores for the 10 elements with highest impedance
 |