Our step-by-step GIS approach for mapping hazards from ground failure caused by liquefaction during large earthquakes emphasizes integration of original digital geologic mapping with numerous sets of base data and subsurface data. Digital Quaternary geologic maps, shallow groundwater contour maps, and liquefaction hazard maps, were constructed at a scale of 1:12,000 for all alluviated areas within Ventura County, California. Our map database, currently being incorporated into the County of Ventura's county-wide GIS, is a county-wide resource for mitigating potential risks to critical lifelines, petroleum pipelines, and other facilities supporting the large population and active oil industry in the Oxnard-Ventura area.
The structural integrity of a building, lifeline utility, or transportation system within a region impacted by a large earthquake is directly dependent upon both the resistance of the structure to seismic waves generated by the earthquake and the resistance to ground failure of the materials beneath, or surrounding, the structure. Hazard maps showing the distribution of liquefiable sediments, termed liquefaction susceptibility maps by Youd and Perkins (1978), currently are the main tool used for evaluation of regional liquefaction hazard. We have developed maps of Quaternary deposits and liquefaction susceptibility for Ventura County in southern California (Figure 1). The maps are in the form of a GIS database, produced from 1:12,000 to 1:24,000-scale original mapping, covering Ventura County. The digitized maps are in fully scaleable, seamless format to allow ready use by a wide variety of end-users. The database currently is being incorporated into the County of Ventura's countywide GIS system for characterization of potential seismic hazards to pipelines and associated facilities, as required by recent State legislation. The County's GIS database will be available to County agencies and local municipalities for countywide land-use planning (i.e. evaluation of future development decisions), and for emergency response planning.
Our mapping encompasses the communities of Ventura and Oxnard on the Oxnard Plain, communities within the Santa Clara River Valley, and other populated valleys in Ventura County (Figure 1). Extensive property damage within Simi Valley and communities along the Santa Clara River resulting from the 1994 Northridge earthquake, caused in part by local ground failures and lateral spreading, showed that liquefaction poses a significant region-wide hazard within the County. Accurate, regionally-consistent maps of liquefaction hazard are needed for planning and regulatory agencies to make informed decisions regarding land-use practices in Ventura County. In addition, critical lifelines, petroleum pipelines, and other facilities supporting the large population in the Oxnard-Ventura area potentially are exposed to liquefaction hazards.
Our study is part of a comprehensive, integrated seismic hazards mapping program in Ventura County. Digital geologic mapping produced for this study provides baseline data from which the California Geological Survey (CGS) Seismic Hazards Mapping Program currently is developing official regulatory liquefaction zone maps (e.g. Hitchcock et al., 1999; Wills and Hitchcock, 1999). CGS's liquefaction hazard zone maps are adopted and used by local jurisdictions in regulating development. Liquefaction susceptibility maps produced for this study are not meant to substitute CGS's official zone maps or for site-specific studies. However, the susceptibility mapping is detailed and accurate enough to be used within GIS to evaluate the relative severity of hazards within the County of Ventura, and to focus subsequent more detailed studies in the most critical areas.
Liquefaction-related ground failure historically has caused extensive structural and lifeline damage in urbanized areas around the world. Recent examples of these effects include damage produced during the 1989 Loma Prieta, 1994 Northridge, 1995 Kobe, and 1999 Turkey earthquakes. These and other historical earthquakes show that the distribution of liquefaction-related damage is not random, but generally is restricted to recently alluviated areas that contain low-density, saturated, granular sediments. Extensive young gravel, sand, and silt deposits in the Oxnard Plain and along the Santa Clara River, shallow groundwater, and the presence of nearby potentially active faults, indicate that parts of Ventura County are particularly susceptible to liquefaction-related hazards. During the Northridge earthquake, liquefaction occurred at the mouth of the Santa Clara River in Oxnard/Ventura, in Simi Valley, and along the Santa Clara River between Fillmore and Newhall (Barrows et al., 1995). Settlement and lateral spreading caused by the earthquake resulted in rupture of an oil pipeline near the I-5 crossing of the river, directly east of Ventura County, and initiated an oil spill that contaminated large portions of the river downstream.
The potential for liquefaction depends on both the susceptibility of a deposit to liquefy and the opportunity for ground shaking to exceed a specified threshold level required for liquefaction to occur. Liquefaction susceptibility is the relative resistance of a deposit to loss of strength when subjected to strong ground shaking. Loss of soil strength as a result of liquefaction during an earthquake can result in ground failures at the earth's surface. These failures, including localized ground settlement and lateral spreading, can cause significant property damage. Physical properties of surficial deposits govern the degree of resistance to liquefaction during an earthquake. These properties include sediment grain-size distribution, density, cementation, saturation, and depth. Sediments that lack resistance (susceptible deposits) commonly include saturated, sandy young deposits. Sediments resistant to liquefaction include older deposits that are dry or sufficiently dense.
The Oxnard Plain near Ventura and Oxnard, much of the Santa Clara River Valley, and portions of other populated valleys in Ventura County are underlain by historic and Holocene sediments deposited by fluvial processes. These sediments consist primarily of saturated sand and silty sand that are highly susceptible to liquefaction where saturated. Other areas of Ventura County contain coastal alluvial floodplains and estuarine sediments, natural beach deposits, and stream deposits. Experience from historical earthquakes shows that late Holocene sediments deposited in all these environments are highly susceptible to liquefaction (DuPre and Tinsley, 1990). In addition, development of the Oxnard Plain and Santa Clara River Valley has led to artificial filling and urbanization of large tracts of land. Areas underlain by non-engineered fill, particularly hydraulic fill, also locally may be susceptible to liquefaction.
Historic and geologic evidence of large earthquakes in Ventura County, and evidence of past liquefaction during these earthquakes, demonstrates that the opportunity exists to produce liquefaction in susceptible sediments in Ventura County. Liquefaction occurs over widespread areas during long-duration, strong ground motion generally exceeding 0.15 g peak ground acceleration (PGA). These ground motions typically are produced by large-magnitude earthquakes, exceeding magnitude (Mw) 6.5. Given the widespread occurrence of active faults in Ventura County, we anticipate that virtually all parts of the County likely could be exposed to long duration ground shaking strong enough to produce liquefaction in the foreseeable future. Major fault zones capable of producing large earthquakes in or near the study area include the Oak Ridge fault, the Simi-Santa Rosa fault system, the Santa Ynez fault, the Red Mountain fault, the Santa Susana fault, and the San Andreas fault.
Our digital mapping of surficial deposits in Ventura County is produced in, and adapted to the needs of, GIS to provide a regionally consistent map base. Our methodology emphasizes layer-based interpretation of detailed Quaternary mapping, calibrated by quantitative evaluation of borehole data, as the basis for delineating liquefaction susceptibility (e.g. figure 2). Geologic maps enable extrapolation of sparsely distributed boring log data, thus providing a means to consistently map liquefaction hazards over large areas. Thus our maps, and accompanying databases, are designed to provide the framework for evaluation of county-wide liquefaction hazards and allow the incorporation of future, more site-specific geologic and geotechnical data.
Geological, geotechnical, and hydrological data compiled during the course of the study was integrated in ArcView 3.2 and subsequently formatted to meet requirements of CGS's Seismic Hazards Mapping Program (Real, 1993). The geotechnical and seismic response properties of Quaternary geologic map units were determined by quantitative analyses of the compiled geotechnical data for each map unit. This information is integrated with groundwater data to produce hazard maps (e.g. Figure 2).
The liquefaction hazard maps developed for Ventura County show areas of deposits susceptible to liquefaction-related ground failure on the basis of Quaternary geologic mapping, groundwater levels, historical occurrences of liquefaction, and analyses of borehole (SPT) data. Liquefaction susceptibility is classified on the basis of three factors: (1) total thickness of loose sandy deposits within 40 ft (12 m) of the earth's surface, (2) depth to the zone of saturation, and (3) estimated threshold ground shaking values required to initiate liquefaction. Geologic criteria used in the absence of boring data include the age and texture of the deposit based on Quaternary geologic mapping, occurrence of historical liquefaction, and estimated depth to groundwater (Figure 3). Quaternary geologic mapping performed as part of the hazard mapping process differentiates deposits on the basis of age and depositional environment - two of the criteria necessary to identify loose, cohesionless sand likely to liquefy during large earthquakes. Because deposits typically become more consolidated with age and therefore less likely to liquefy, relative ages of deposits are used to estimate liquefaction susceptibility where reliable borehole data are lacking.
Liquefaction susceptibility ratings include: very high, high, moderate, low, and very low. A "very high" rating typically is assigned to areas of known liquefaction occurrence, saturated artificial fill, and late Holocene saturated, granular deposits. A "very low" rating typically is used for units that pre-date the latest Pleistocene (>15 ka), units that are not determined to be liquefiable under 0.3g or greater PGA from geotechnical analysis, or areas where groundwater is below the critical depths of 30 to 40 feet for deposits of historic, Holocene, or latest Pleistocene age. Susceptibility ratings of "high," "moderate," and "low" were determined by (1) a liquefaction threshold analysis where borehole data are available, and (2) a criteria matrix based on age of deposit and depth to groundwater for areas of insufficient geotechnical data
Deposits most susceptible to liquefaction in Ventura County are non-engineered artificial fill emplaced over estuarine sediment, and latest Holocene stream deposits. Other susceptible deposits include Holocene estuarine deposits, Holocene stream terrace deposits, Holocene beach and dune sands, Holocene undifferentiated alluvium, and Holocene basin deposits. Communities within or adjacent to areas having moderate to very high liquefaction susceptibility include nearly every city in Ventura County.
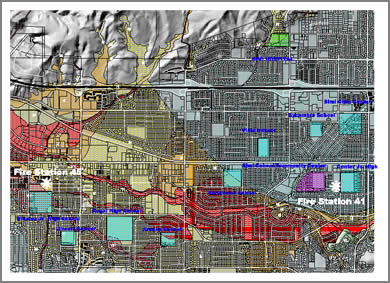
Planners and emergency response personnel with non-technical backgrounds need real world maps that depict likely consequences of liquefaction. Our mapping, combined with street base layers and other GIS data, can be used to focus mitigation efforts prior to an earthquake and guide emergency response and recovery efforts following an earthquake.
Our research was supported by the Resource Management Agency of the County of Ventura, the National Earthquake Hazard Reduction Program under grant # 99-HQ-GR-0117, the National Science Foundation (NSF), under NSF award EAR-9416756, and by the professional development fund of William Lettis & Associates, Inc. We wish to thank those who graciously provided access to borehole logs and other information for Ventura County. These individuals include Ralph Loyd of the California Geological Survey, George Berg of the City of Simi Valley, Jim O'Tousa, Al Echarnen, Glen Luscombe and La Vern Hoffman of the Ventura County Public Works Agency, Tim Sandoval of the California Department of Transportation, Ed Low of the California Department of Water Resources, Randa Gill and colleages of the City of Oxnard Public Works Department, Vern Gill of the City of Fillmore Building Division, Brad Bossell of the City of Santa Paula Engineering Division, Doug Beach of the Leaking Underground Fuel Tanks (LUFT) program in County of Ventura, and Tom Blake of Fugro, Inc. We thank Allan King of the US Forest Service and the Dibblee Foundation for releasing unpublished geologic maps of portions of northern Ventura County and acknowledge the significant contribution of Thomas Dibblee's published and unpublished mapping to our mapping of Quaternary geology in Ventura County. We also thank Jeff Bachhuber, Keith Kelson, and Janet Sowers of William Lettis & Associates, Charles Real, Wayne Haydon, Keith Knudsen, and Mark DeLisle of CGS, and John Tinsley of the U.S. Geological Survey, for helpful advice. The liquefaction evaluation approach described in this report incorporates, and builds on, previous published and unpublished contributions by Jay Noller, Jeff Bachhuber, Keith Knudsen, and Janet Sowers.
Barrows, A. G., Tan, S., and Irvine, P., 1994, Investigation of surface geologic effects and related land movement in the city of Simi Valley resulting from the Northridge earthquake of January 17, 1994: California Division of Mines and Geology, Open-File Report 94-09, 41 pages. California State Mining and Geology Board, 1997, Guidelines for evaluating and mitigating seismic hazards in California; California Department of Conservation, Division of Mines and Geology Special Publication 117, 74 p. California State Mining and Geology Board, 1998, Guidelines for delineating seismic hazard zones: California Department of Conservation, Division of Mines and Geology Special Publication 118. DuprŽ, W.R., and Tinsley, J.C., 1990, Geologic controls on liquefaction-induced ground failure in the Monterey Bay area, California, during the Loma Prieta earthquake, October 17, 1989: Geological Society of America, Abstract with Programs, v. 22, no. 7, p. A188. Hitchcock, C.S., Loyd, R.C., and Haydon, W.D., 1999, Mapping liquefaction hazards in Simi Valley, Ventura County, California: Environmental & Engineering Geoscience, Vol. V, No. 4, p. 441-458. Kennedy, S.A., and Matti, J.C., 1999, Data-base model specifications for digital geologic-map data bases produced by the Southern California Areal Mapping Project SCAMP), version 2.0a: U.S. Geological Survey Open-File Report 99-145, 45 p. Seed, H.B., and Idriss, I.M., 1982, Ground motions and soil liquefaction during earthquakes: Earthquake Engineering Research Institute, Engineering Monograph v. 5, 134 p. Tinsley, J.C., Youd, T.L., Perkins, D.M., and Chen, A.T.F, 1985, Evaluating Liquefaction Potential, in Ziony, J.I., ed., Evaluating earthquake hazards in the Los Angeles Region - an earth-science perspective: U.S. Geological Survey Professional Paper 1360, p. 263-316. Youd, T.L., 1973, Liquefaction, flow and associated ground failure: U.S. Geological Survey Circular 688, 12 pp. Youd, T.L., and Perkins, J.B., 1987, Map showing liquefaction susceptibility of San Mateo County, California: U.S. Geological Survey, Map I-1257-G. Wills, C.J., and Hitchcock, C.S., 1999, Late Quaternary sedimentation and liquefaction hazard in San Fernando Valley, Los Angeles County, California: Environmental and Engineering Geocience, Vol. V, No. 4, p. 419-439.