Barbara M. Parmenter
Community and Regional Planning Program
The School of Architecture
The Univesity of Texas at Austin
Abstract
Visualizing places and the way they evolve is a fundamental
part of what planners, urban designers, landscape architects, and geographers
do. Without being able to visualize a region as a whole, it is often difficult
for citizens to plan for the future. This paper describes the design and construction
of a GIS database that visualizes the history of landscape changes in
Acknowledgements: The data layers discussed in this paper were developed
by students in a Community and Regional Planning Applied GIS class, spring semester,
2002, at the
Introduction
In 1892, Patrick Geddes set up a �Civic Observatory and Laboratory" known
as �the
The constant theme in Geddes� work was the necessity of involving citizens
in the careful empirical study of economics, culture, and environment together
as the basis of sound planning. His promotion of the civic survey influenced
decades of town planning methods and in
A Return to Place-Based Planning
Over the last decade, the planning profession has been challenged from several
directions to re-engage both planners and citizens with the artful physical
shaping of communities that was once one of the profession�s strengths. The
popularity of new urbanism, whatever its many faults, demonstrates that
a focus on the tangible three-dimensional substance of community life at the
very least stirs the public�s and the media�s imaginations. The definition of
sustainability as being based on three components (environment, economy, and
equity) also requires a tangible connection to our living space rather than
sole consideration of resource allocation (
But to understand our future options in a way that builds upon the full dimensionality of a particular place we must regain the �synoptic� vision that Patrick Geddes espoused. This includes exploring how places have evolved and what that evolution presents in terms of diverse opportunities and problems across the landscape. True place-based planning requires the fourth dimension of time. Historical explorations of morphology, economy, ethnography, and ecology are critical for understanding variations between places and within places, and for recognizing specific opportunities for change or continuity. �Yet planning sees itself largely as a present and future-oriented professional science, and considering the kinds of time and budget pressures under which planners work, there is scant opportunity for detailed historical exploration.
A virtual outlook tower? �Building a temporal database for the
One place where we are afforded this kind of luxury, to get our historical
bearings, take time to explore without a rigid agenda, and read broadly, is
in our educational system. And here again, Geddes has preceded us to the same
conclusion. His constant calls for �civic surveys� in the schools influenced
the British school system for decades, and were echoed in the
In looking for examples of this kind of work elsewhere, projects in the
Yet the regional view is only one scale in which planners and citizens are interested, and it is a difficult scale for studying the interplay the physical and socio-economic contexts in detail. Urban cultural geographers have tackled these issues and, in my opinion, offered useful avenues for further exploration (Ford 1994; Arreola and Curtis 1993). In our initial exploratory efforts, I left it up to class participants to propose data development efforts that would examine the city at a finer scale. Below I briefly discuss both the regional data development and the more exploratory efforts.
Regional scale data development
I chose to follow the Urban Dynamics template as a partial basis for our historical
database. The USGS is engaged in a project to study the Edwards/Trinity Aquifer
(ETA) that includes much of the
Framework layers - these cover most of
These data layers, some of which are still being completed, provide a good regional view. We encountered a number of issues identified in the literature for other urban dynamics mapping projects, particularly the problem of being driven to some extent by available source material. Satellite imagery was used for the land cover mapping; hence we have no land cover prior to the use of satellite sensors. Experiments with land cover digitizing from geo-referenced aerial photos proved that this method would be prohibitive at a regional scale in terms of time investment. Nonetheless it is quite possible to do for smaller neighborhood analyses. The historical topographic maps are from slightly different years for each time period (1950s, 1960s, 1970s, 1980s) and there is not a complete set for the entire region.
For the major roads layer we took a different approach than other projects
reported in the literature. We initially tried several approaches, including
1) digitizing fresh from the historical DRGs, and 2) adding temporal attributes
to the current road centerline data set based on visual comparisons against
the DRGs. Both methods were somewhat inaccurate and time-consuming, but the
second approach had the most promise. We soon discovered, however, a tabular
database at the Texas Department of Transportation that had dates for all state-maintained
road construction activities (by what TxDOT calls �control sections�) going
back to 1920. We were able to acquire the control section routes in ArcInfo
format, and eventually join the database to the control section features so
that we can specify and map both date of initial construction and major modifications
for major roads in the
The graduate students working to develop the land cover and urban built-up layers did an excellent job but were stymied by data acquisition issues. The available data sets were not ideal in terms of time series or season, and there was a great deal of discussion concerning which of the several land cover classification schemes to use. In the end they decided to use a modified version of the USGS� National Land Cover Data classification scheme (USGS 2001) as follows:
The students also attempted to derive urban built-up zones from the historical DRGs for years prior to satellite imagery availability. The initial results were promising, but interpretation issues arose that still need to be resolved. The USGS 1:24,000 topographical maps have pink tints for built-up areas; outside these areas, individual structures are shown. It is easy enough to extract the pink tint, but more difficult to determine what other areas should be included. Although these earlier layers showing urban built-up land are interesting, the more important period influencing current growth (going back to the 1980s) can be shown using the satellite imagery, and we will concentrate our efforts there.
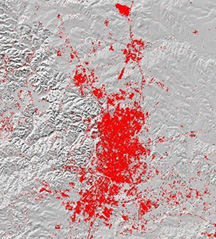
Urban Built-up Land 1983
Urban Built-up Land 2000
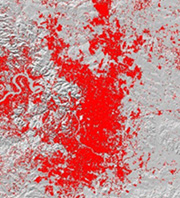
While these data layers provide excellent visualization and general analysis opportunities, we concluded that a more appropriate time series for satellite imagery in terms of both year and season will be necessary for further research requiring high accuracy. Nonetheless, to my knowledge, the historical land cover and urban built-up data layers are the best data yet showing land cover change through time in our region.
The census tract data layers for 1970 and 1980 were created from aggregating
1990 census tracts back up to their earlier tract boundaries based on paper
maps of
The digital elevation model and data layer for areas excluded from development
are both for a single time period (as required by the Clarke Urban Growth Model).
It would be interesting to have terrain models for different time periods but
this is beyond the scope of our time investment possibilities. The excluded
areas include parks, for which it would be relatively easy to add date of establishment
(although many parks were designated as such early on but not actually developed
as parks until decades later). Other excluded areas include water bodies, conservation
trust lands, and other lands purchased by local agencies for environmental protection
purposes. In
Exploratory data development
While adhering to existing templates for the �framework� data development,
I encouraged students to experiment in developing data layers to facilitate
more detailed urban historical analysis. We followed no set template; instead
we simply wanted to play with different possibilities. Different data layers
cover varying parts of the
Exploratory thematic layers:
Historical maps and aerial photos:
These materials combined with current data sets widely available in the region can provide at least the beginnings of virtual view of our city and region and show some of the changes that have taken place. But the larger aim is to provoke questions and ideas that then require more in-depth exploration in the community and its history. The following are just a few examples of what can be done.
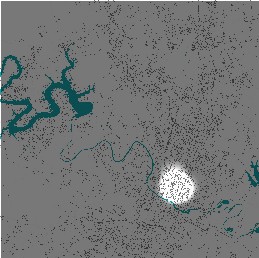
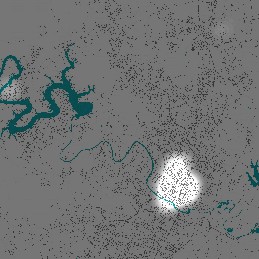
Analysis example � downtown floodplain development
One student in the class created a presentation showing the transformation
of the
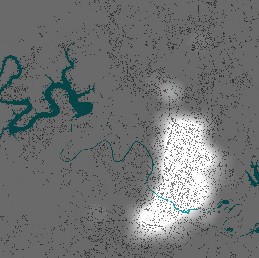
Analysis example � grocery store development
Another team of students wanted to examine the spread of commercial and institutional development. To focus their efforts on something feasible for a semester�s work, they chose to map grocery stores, schools and medical facilities for a variety of time periods. Working mostly from city directories, they were able to use scanning and optical character recognition software to create tabular data sets that included facility name and address for the different periods. They then address-matched these using our current street centerline files and were relatively successful, achieving 80% or more matching rates. They then used ArcGIS Spatial Analyst to create density maps. This data can be used to examine economic changes through time, and also equity questions in terms of access by different communities with varying income and ethnic characteristics. We can also combine this data with photographic surveys to look at the morphological evolution of commercial strips and nodes.
Grocery store density 1890
Grocery store density 1930
Grocery store density 1980
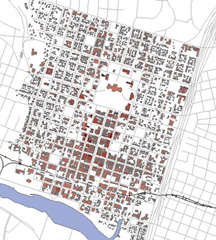
Analysis example � downtown core development
A third team focused their work on digitizing building footprints for the downtown
Austin core, a grid originally laid out in 1839 to be the capital of the Republic
of Texas. The basic source for these data layers were Sanborn Insurance Maps,
which are now available in black and white digital format online from University
Microfilms (UMI) by subscription (UMI 2002).� The Sanborn Maps, originally drawn
for insurance purposes, include a wealth of information about type of business,
fire and flood hazards associated with a particular parcel or structure, and
number of stories. The downtown team converted the digital maps from .pdf to
.tif format, geo-referenced them, and digitized building footprints, adding
number of stories as an attribute. By using an estimate for typical story height
(12 feet) for extrusion purposes, the students were able to produce 3-D images
of downtown
Downtown 1900
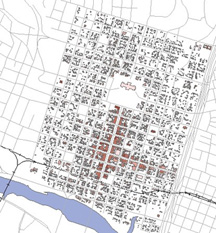
Downtown 1961
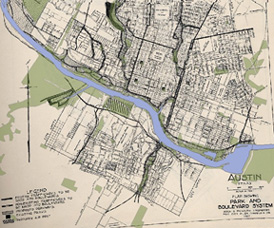
Analysis example � history of planning activities
Looking for historical data sources, I acquired several previous comprehensive
plans for
1928 Parks Plan overlaid with current city parks layer
Conclusion
With the possible exception of the land cover change data sets (required for calibrating models of future land use), the kind of data we are developing in this project are not critical to anyone�s daily professional duties, including planners. Nonetheless, they can be powerful tools, and perhaps most powerful for the education not just of planners but of citizens in general. For that reason, university planning, geography, and urban studies programs are an appropriate context for this kind of project. For students (and community residents) who are always questioning why things were done this way or that, why some plans fail and others succeed, these data sets and accompanying texts are potentially very useful. Combined with more detailed looks at specific areas using older and current aerial photos, we can begin to discuss to how and to what extent formal planning interventions have affected the city and its surroundings. Rather than simply bemoaning urban sprawl, we can challenge students to look at an urban fringe area in 1951, consider population and employment growth at the time, and think through how it might have been done differently and what impacts that would have had. Why was it done the way it was, and could it have been done differently? What does that tell us about our planning efforts today? We can examine street patterns, lot size, and structure types in subdivisions from different periods, and through field investigations, devise qualitative and quantitative indices about how well these different places function from economic, ecological, equity, and aesthetic perspectives.
If we take up Patrick Geddes� challenge, we also need to extend access to these data layers and visualization projects to younger students and to the community at large. Current educational theory calls for place-based education, where students use their own community for interdisciplinary investigations (Smith 2002). Current planning theory and practice requires widespread community participation in all phases of plan-making. Again, neither K-12 schools nor public agencies have the budget nor time to produce such data sets. But we do have the resources in our universities, and the development of these kinds of historical GIS data sets is educational in and of itself, forcing in-depth investigations of community history, data sources and data development techniques. By undertaking these kinds of projects and sharing them with our communities, we may achieve at least in part the �synoptic� vision that Geddes hoped us to have.
References
Acevedo, W., Foresman, T.W., and
Buchanan, J.T. 1996. �Origins and
Philosophy of Building a Temporal Database to Examine Human Transformation Processes.�
Proceedings, ASPRS/ACSM Annual Convention and Exhibition,
Arreoloa, Daniel D., and Curtis, James R. 1993. The Mexican Border
Cities: Landscape Anatomy and Place Personality.
BES. 2002.
Campbell, Scott. 1996. �Green Cities, Growing Cities, Just Cities? Urban Planning and the Contradictions of Sustainable Development.� Journal of the American Planning Association, vol 62(3): 296-313.
CAP-LTER. 2002. Central Arizona-Phoenix Long-Term
Ecological Research Web Server. Available Online: http://caplter.asu.edu/
(Accessed
Ford, Larry.
Geddes, Patrick. 1968. Cities in Evolution: An Introduction to the Town
Planning Movement.
Grove, J.M. and Burch, W.R. Jr. 1997. "A Social Ecology Approach to Urban Ecosystem and Landscape Analyses." Journal of Urban Ecosystems 1(4): 259-275.
Hester, David. 1999. �Modeling
Koch and Fowler. 1957.� A City Plan for
Meller, Helen. 1993. Patrick Geddes
: social evolutionist and city planner.
Moody, Walter D. 1916. Wacker�s Manual
of the Plan of Chicago: Municipal Economy.
Rodwin, Lloyd and Sanyal, Bishwapriya, eds. 2000.
The Profession of City Planning, Changes, Images, and Challenges: 1950-2000.
Smith, Gregory A. 2002. �Place-Based Education: Learning to Be Where We Are.� Phi Delta Kappan. Vol 83(8): 584-594.
UMI. 2002. Digital Sanborn Maps. Available online: http://sanborn.umi.com/ (Accessed
USGS. 2002. Urban Dynamics Research Program: Analysis
of Land Use Change in Urban Environments. Available online: http://landcover.usgs.gov/urban/intro.html
(accessed
USGS. 2001.