Go with the Flow – Maintaining a Utility GIS
by David S. Coleman, II
Abstract
With GIS becoming such an integral part of water and
wastewater utility operations, it is essential that the database remains
current and accurate. Thus, it is
important to have a well-executed maintenance process. Many factors should be considered, such as
data collection, data entry, workflow, and quality assurance.
As a consultant working with Esri software for several utilities, I have experienced many successes and encountered some pitfalls with GIS implementations and their subsequent maintenance. In this paper I will discuss some important considerations for an ongoing GIS program.
Introduction
Geographic Information Systems (GIS)
have become a widely used tool in the utility industry in recent years. Utilities are using GIS to perform
day-to-day functions, such as operations and maintenance. In addition, they are using GIS help keep
better records, make better decisions, analyze their existing and potential
customer base, and plan for future expansion.
With GIS becoming such an integral part of utility operations, it is
important to streamline the updating procedure so that the timeliness and
accuracy of the database are of the very highest quality.
Figure
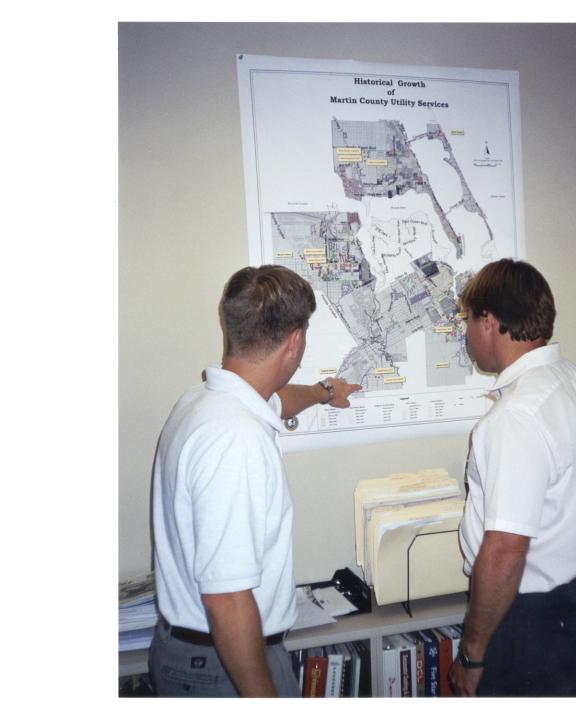
1. Maps produced by GIS are valuable tools that aid in decision-making.
Using a GIS system to store utility data allows for data to be analyzed, viewed, and queried. It provides a single source of data for utility personnel (and ultimately the public) in which they can quickly retrieve information about their entire system or a specific part of it. No longer is it necessary for utility workers to spend valuable time searching through numerous sheets of as-built drawings to find information. Now they can access all the data directly from their office or field computers using GIS technology.
However, a GIS cannot be relied upon if it is not kept current. Without time and effort being devoted to maintenance, a GIS can wither away. Interestingly, the GIS that is relied upon will remain valuable.
The many ways GIS is looked upon and handled at utilities is quite varied. Certain practices can lead to a successful GIS – or its lack of success. Being a consultant working with several small- to medium-sized water/wastewater utilities has allowed me the opportunity to compare how utilities handle GIS. The use of GIS ranges from non-existent to complex and heavily depended on. The stage of GIS ranges from pre-conception to fully mature. Who handles the GIS ranges from outside consultant to internal staff to nobody at all. With all these differences, there generally is a person or group who is pushing for the GIS and will ultimately make it successful or more successful than it already is.
These differences make writing a paper such as this
very challenging. Certainly there is no
one plan that can satisfy all utilities.
I present the components of a possible plan below, but it is up to the
reader to determine what will work in their unique situation. At a minimum, it is the intent of this paper
to point out many issues involved in a maintenance plan so the reader may gain
a new perspective and perhaps decide implement new practices. Finally, this paper points out that there is
often no clear-cut right or wrong with many considerations, rather what choice
works best for this organization. This
“go with the flow” approach can sometimes yield the best results for a given
organization maintaining a utility GIS.
Considerations for an Ongoing GIS Maintenance Plan
The GIS Manager
Any GIS maintenance plan needs a GIS
manager. This can be someone with that
exact title and sole duty but at minimum it should be someone who is
knowledgeable in GIS and works closely with the GIS often. It may be someone who works within the
utility. It may be someone who works
for the GIS department of the governmental entity. It may be an outside consultant.
Regardless, there has to be someone to coordinate the many activities
associated with maintenance and to make certain decisions.
Accuracy
One of the first considerations in the maintenance plan should be accuracy, primarily horizontal. A utility will weigh the importance of accuracy differently depending on factors such as current and future accuracy of basemap, current and future applications of GIS used, method of data collection, and budget. Of course, there is a direct relationship between accuracy and cost (i.e., as the level accuracy increases, the cost will increase). Other factors can also come in to play. Thus, a utility will ultimately have to determine the accuracy they desire.
The accuracy of the current basemap is one driving force in determining the accuracy of utilities. Having too high of accuracy relative to a basemap can lessen return on investment. For instance, if it is known that the county basemap is horizontally off by up to 50 feet, having a water main located to 1 foot could be considered wasted effort. When the water main is viewed on the basemap, it will not appear in its proper location. However, many municipalities are experiencing an upgrade to a basemap that is accurate to within 3, 6, or 10 feet. If this is the current level of accuracy or is known to be in the future, it may be appropriate to collect data equal to the basemap accuracy. With sub-meter GPS so ubiquitous today, this can be very practicable.
The method of data collection is another factor. If GPS is readily available more choices must be made. Will GPS be the primary method of data collection, will it be used to solely check positional accuracy, or will it be used for quality control. In any case it is a valuable tool. If GPS is not available, source drawings should be the primary source of data. Using both tools in concert may be the best solution.
Finally, the GIS applications desired can help determine the accuracy desired. If the GIS is primarily being used for planning, utilities mapped with low positional accuracy can be quite useful. However, if field crews use the GIS to locate underground utilities, only the highest positional accuracy is sufficient.
Data Collection and Organization
As with creating a new utility
database, the initial steps for updating are the same. First, the process of data gathering and
assessment must take place. Source
drawings or “as-built” drawings are collected and provide the most complete and
accurate information on the utilities.
These drawings are reviewed and organized by the GIS staff. The GIS staff may meet with the engineering
staff to discuss the area in general and any anomalies that may be found. In the past, utilities often relied on the
drawings as their sole data source.
Now, an alternate method or one that can be used in concert with the
source drawing is the use of GPS as a data collection tool. If the proper equipment and personnel is in
place, this may be a very efficient way to collect GIS data.
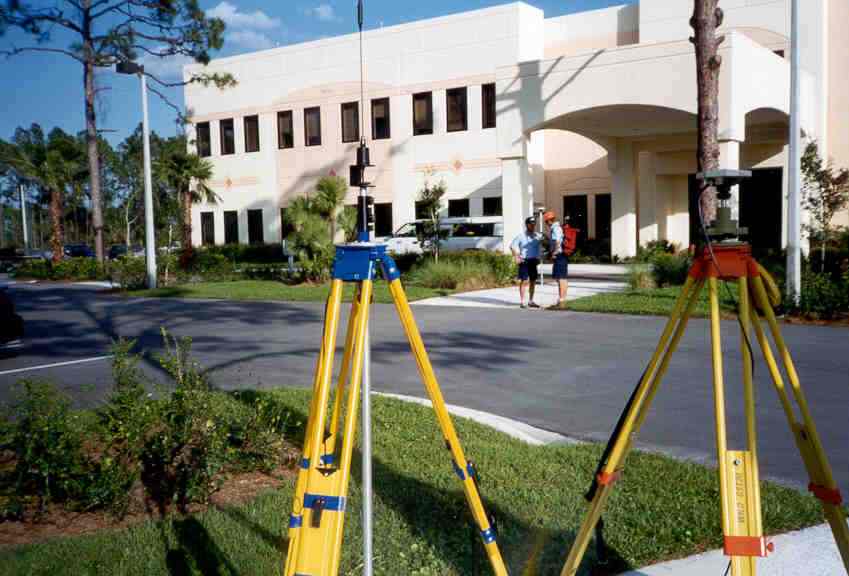
Figure
2. The use of GPS to collect GIS data
makes is often more accurate and more efficient than more traditional methods.
In any case, the assignment of the source drawings
to the GIS proves to be very beneficial.
The source drawings, originally created by the engineer, provide
detailed information that can enhance the GIS.
While all the information on a source drawing could theoretically be put
into GIS format, it is not practical.
The geographic features such as force mains should be input in the GIS
with limited attribute information, such as pipe diameter, material, etc. This leaves the balance of the information
to be retrieved from the source drawing.
This can be accomplished by scanning the source
drawing document and linking it to the data features it represents. In order to do this the drawing name should
be input as an attribute in the tabular portion of the data features. The name acts as metadata and provides a link
to the source from which that particular utility feature was digitized. This will enable the user to automatically
bring up the related as-built drawing by querying the database or a using a
“hotlink”.
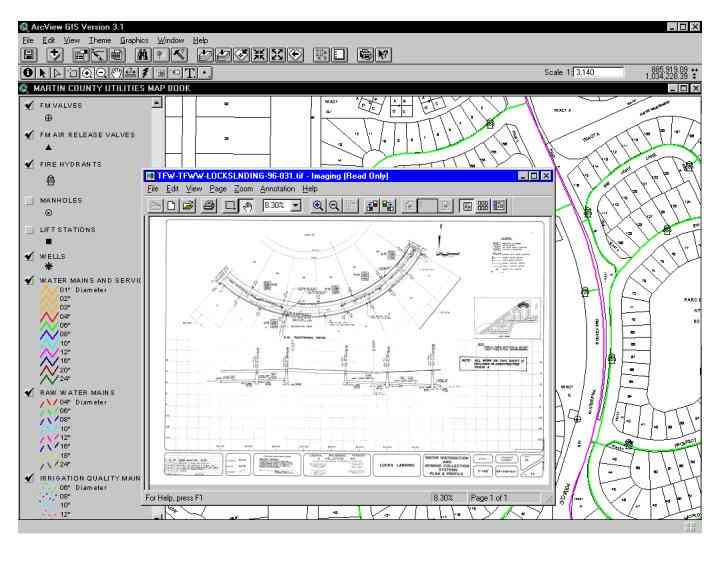
Figure
3. Source drawings can be linked to GIS
features via a “hotlink”.
The drawings should be assigned a unique label
depending on the drawing characteristics.
These characteristics included project type, area identifier, project
name, date installed, and sheet number from the drawing set. This descriptive
information gives the user valuable information about the drawing and its
general location within the project area.
These labels can be attached to the as-built drawings and then scanned. The as-built drawing labels can also be used
as attribute information for each utility feature that is digitized into the
GIS system.
An example of a drawing label would be as follows:
WWX-MNC-HP-02-1999. The first three
characters indicate what type of utilities the drawing shows. In this case, WWX indicates wastewater,
whereas WXX would indicate water and WWW would indicate water and
wastewater. The second set of
characters display the location within previously designated service areas or
subdivided areas of the county. These
subdivisions of the service area can be based on geography, Public Lands Survey
System (PLSS), or an arbitrary grid.
The project name was identified in the next set of characters. In this case we inserted “HP” in all of the
labels to indicate the Holiday Pines project update followed by a more specific
project name found on a given set of source drawings. Following the drawing name is the page number from which that
particular information is referenced.
And finally, the last four digits depict the year of the as-built
drawing.
Parameter |
Description |
Example |
Project Type |
Water, wastewater, both, etc. |
WWX |
|
Area Identifier |
Utility management area |
MNC |
|
Project Name |
Name of project from engineering drawing (road, plat, plat with phase) |
HP |
|
Sheet Number |
Sheet number in a series |
02 |
|
Date Installed |
Date project was installed |
1999 |
Updating the Database
Data conversion can be accomplished several
ways. One method is to use on-screen
digitizing. This involves use of the
as-built drawings as tools for inputting the utility system into the GIS. Feature locations and attributes are taken
directly from the drawings and translated into the GIS database. Data input to GIS can also occur by
downloading GPS data and tabular data entry.
Ultimately all positional and tabular data should reside in the GIS.
Depending on availability and accuracy, ideally a
combination of parcel map and orthophoto can be used as a background for the
utility feature input. A highly
accurate and detailed basemap that includes right-of-ways, edge of pavement,
lots, and building footprints will greatly add to the success of the
conversion. At times, a digital
orthophoto can be used as the to determine locations of features based on
landcover, occupation, or by seeing the actual features themselves. Further information that is useful is
annotated information such as lot numbers and street names.
Measurements are taken from the as-built drawings
and transferred to a highly accurate basemap ensures that the final utility GIS
database will be the best possible representation of the utility system on the
ground. Likewise, any highly accurate
GPS data collected will match well with the basemap.
Updating the GIS will vary somewhat depending on the
data format and software in use, but many of the concepts are universal. For example, ArcGIS can be used to update a
geodatabase GIS system. This example is
used below.
Starting out, the update involves setting up a
personal geodatabase. This is
accomplished by using the ArcCatalog module.
The personal geodatabase file structure consists of feature datasets and
feature classes. The feature datasets
are the general category of the files it stores. For example, two feature datasets can be constructed within the
geodatabase: water and sewer. These
feature datasets contain feature classes.
These feature classes are the actual “themes” that contain the utility
data.
Digitizing can be also streamlined with the help of the snapping environment in ArcMap. In the past, using other programs for data entry, snapping point features to line features was more time consuming. For instance, manholes and valves are located directly on the lines and should be snapped to their respective mains. With the snapping abilities of ArcMap, the user has direct control of the snapping environment and features in the database. ArcMap also allows for a quality check during the data input stage by its ability to accept user assigned rules to point and line features. This function of ArcMap increased the accuracy with which features were digitized and saved time in data input.
Another innovation in new software such as ArcMap that streamlines data input and improves accuracy involves attribute domains. This feature allows for a pre-defined set of attributes and rules for each feature class. When starting to digitize a particular as-built sheet, all the relevant attribute information can be set up for the feature classes prior to digitizing. These attribute domains are set up in ArcCatalog. A domain allows one to set up attributes and rules for each field in the table. For example, in our geographical area a large percentage of gravity sewer main diameters are 8 inches, and most fire hydrant mains are 6 inches. Also, most mains are constructed of PVC material. Once a feature is digitized into ArcMap the attributes you set up are automatically added to the tabular information. Thus, when digitizing begins, there is no need to input attributes for many features because their attributes were previously defined. If there are features on the drawing that are different from the standards set in the domain, they can be manually updated to reflect their true conditions.
It is also possible to set up ranges for the
attribute data. There is an advantage
to this when it becomes necessary for manual input of attribute data. It ensures that logical values are stored in
the database, reducing technician error.
For instance, it is possible to set up a selection of choices for pipe
material to be PVC or DIP, so misspellings or other values are not allowed. Sizes for mains can also contain range
information, which can be pre-set to allow any values needed (e.g., 1-inch
services to 24-inch mains, but not 25-inch or higher). These specialized functions of ArcCatalog
improve accuracy, which in turn allows for more successful queries of the
data. These functions also speed the
process of data input.
Maintenance Schedule
There are primarily two ways to approach GIS maintenance and each have advantages. First is ongoing maintenance. This typically occurs anywhere from daily to bi-weekly and requires a GIS specialist on staff. The GIS specialist will input data as soon as it is received, which includes additions or changes to the system. Data can come from as-built drawings or GPS field data collection. This method may be appropriate for a utility that services a slow growth or built-out area. The advantage here is certainly a very up-to-date GIS.
A second method is intermittent maintenance. This frequency of update can be driven by time or by data. For instance, a GIS update can be scheduled as a monthly or quarterly event. Or in the case of a data driven maintenance schedule, an update can happen as soon as there is a substantial quantity of data to update. In actuality a combination of these two sub-types can exist. If a consultant or GIS specialist in a GIS department is doing the update, this method may work better. This method yields an easier way to track the amount of data updated, which can be the basis on which to compensate a consultant (e.g., added 20,000 linear feet of water main, 40 fire hydrants, etc.). This method can be more efficient to a utility that in a fast growing are because updates are done in bulk. Users of the system should be notified of the update schedule and when the update has occurred.
Maintaining External Data
While a utility is
primarily concerned with its mains, manholes, and valves, its GIS cannot
survive without maintenance of basemap and other “external” or “outside”
data. External data is data that is
created and maintained by another entity.
In a true enterprise GIS system, much of external data maintenance
should take care of itself, particularly data layers maintained by the entity
itself. However, it turns out that many
utilities have to fend for themselves and others should at least be very
cognizant of external data. A GIS
specialist or consultant for the utility should devote part of their time to
making sure that the utility has the information it needs. For instance, if the property appraiser’s office
is constantly updating its data, the utility should have access to it at least
to follow its intermittent maintenance schedule. Ideally, a direct link can be made to the data.
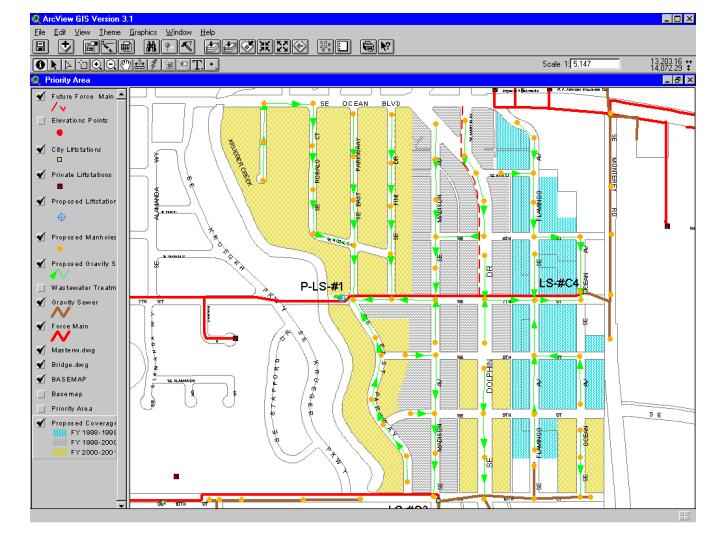
Figure 4. External data,
including critical base information, must be maintained for an optimal GIS.
The external data to
consider is virtually endless. It
extends from the more obvious data that people in the local entity create to
data that is collected by regional water management districts, state
governments, federal agencies, etc. In
addition, many commercial outfits collect data that can be of use to the
utility. A list of all possible outside
data to incorporate should be compiled along with an estimated schedule of
update. Subsequently, the GIS manager
should inform users and potential users of this data and make important data
available to the users.
Problem Resolution
Users of the system will invariably find errors or problems with the data or the system itself. Any errors found in the GIS can be put in a file to be fixed at time of next update. It may be best to request users to fill out a form that describes the error. Or, users should give specific information as well as a draft-quality map illustrating the problem. In either case, it is wise for the user to make it known who they are in case further questions arise.
Enhancements to System
There will come a time
when enhancements need to be made to the system. These may include software upgrades, hardware upgrades, changes
to user interface, or changes to data format.
Users will generally adapt to minor changes in the system easily. Enhancements to the system will be better
received if there is prior notification along with a reason for the
change. At the time of the change, it
is imperative to disseminate an explanation of the differences users should
expect. In the case of major changes to
the system these same guidelines should apply, along with a training session
and/or the availability of technical support.
Quality Assurance / Quality Control (QA/QC)
QA/QC should
be undertaken prior to release of any routine updates or enhancements to the
GIS. To ease this process a checklist
can be very helpful. If possible, a
person other than the one(s) who updated the information should do the
QA/QC. Assuming they are experienced or
properly trained, they will be able to identify problems and inconsistencies
better. The checklist may go over items
such as:
·
Completeness of
update – geographical area
·
Completeness of
update – features
·
Completeness of
update – tabular
·
Original data
integrity
·
Positional
errors in relation to orthophoto, accurate basemap, existing utilities
·
Attribute
errors
In addition
a beta test should be performed, particularly if there were changes to the
hardware, software, or interface. In
the beta test a typical user will use the new system and hopefully uncover any
bugs that exist. Once the QA/QC and
beta test are complete, the data can be released.
Metadata and Transaction
Records
Metadata, or
data about data, should also be kept with the data files themselves. Standards have been adopted by the Federal
Geographic Data Commission and can be found in a document entitled “Content
Standards for Digital Geospatial Metadata.”
This document describes in detail the many items that should be included
in metadata, such as data quality, attribute accuracy, and the other key
elements that describe data. This
metadata should be kept with the data and updated when changes occur to the
data. By doing so, people referencing
the data in the future can find out what they need to know about the data,
which will in turn help ensure proper use of the data. Fortunately, as the importance of metadata
has grown, so has the ease of which to incorporate it. For instance, ArcCatalog has an interface to
create and update metadata.
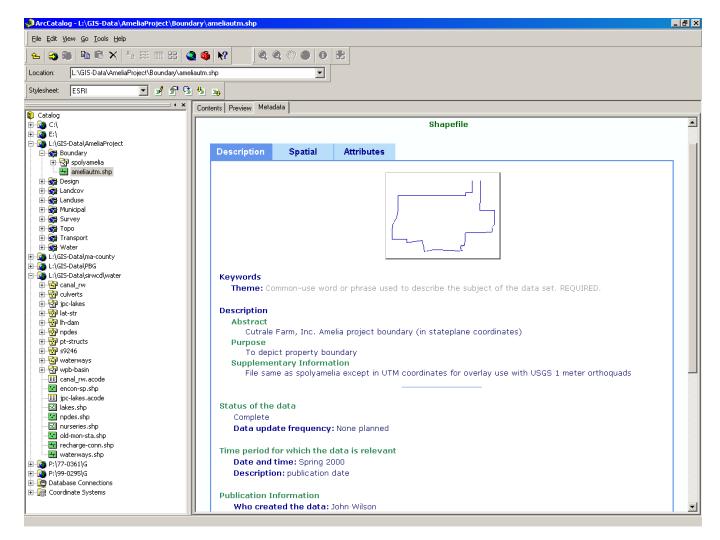
Figure 5. With ArcCatalog,
metadata can be created and updated.
Within the
organization, another helpful tool is a data update log. A log can be very useful to keep important
information, such as an inventory of what was updated, who did the update and
when. In a sense, a log is
metadata. However, the log is primarily
for an overview of all data files (unlike metadata, which describes individual
data files). Thus a log is useful as a
supplement to metadata, so an organization can look in one place to see
information regarding the update of all files.
Data Access
Data access is a critical issue for GIS projects. Where the GIS will ultimately pay for itself is with the availability of the data to staff members at all levels to make maps and queries to aid in operations, planning, and decision-making. For instance, we have set up systems for utilities so utility personnel answering public calls can quickly and easily view and print maps and as-builts for a given area, helping them answer questions while on the phone with no need to do research and call back. If field person needs to go to the site, a printed map with notes on the situation is already available to them.
The primary method of data access should be through a user-friendly GIS interface. Programs such as ArcExplorer offer GIS data to users with little experience using GIS. In addition, these programs are available at low or no cost. Probably the best method of data access for non-GIS professionals is the Internet and local intranet. An easy to establish and useful site might include static images or PDF files. A more advanced site can offer an interactive GIS invisibly to the user through a Web browser. Users in the field may also benefit from a handheld computer with ArcPad and GPS for many field activities.
Users without direct access to the master database with a wired or wireless connection can access the data by getting copies of the database at given intervals. These copies on media such as CD-ROM will allow users without connections or users in the field to utilize the system.
Finally, various levels of access should be given depending on the users experience and needs. For instance, those who do not to edit information should not have access to do so, or at minimum understand that they are not to do so. This will reduce potential confusion on who edited a particular item and may reduce errors by those not properly trained to edit the GIS data.
Conclusion
Utilities vary in the level in which they use GIS, however the vast majority are making efforts to advance their GIS. In order to be successful, a good maintenance plan that considers the many important issues should be established. A plan that aims for the ideal, yet compromises in areas where necessary because of budgets, manpower, accuracy issues, etc., is more likely work in a given organization. This “go with the flow” approach is one of the keys to successfully maintaining a utility GIS.
Acknowledgements – Thanks to
Henry Mogilevich and Tom Vokoun for contributions to this paper.