This paper describes the GIS at the City of West Linn. West Linn is located in Clackamas County, Oregon and is within the Portland Metropolitan area. The City of West Linn is approximately 8 square miles and has a population of 23,000+ people. This paper describes the GIS products and tools that have put in place to provide a useful, centralized GIS. Brief discussion is given on development and deployment, map products, MapObjects application, and web. Working with limited resources, this paper describes providing a GIS to several disciplines throughout the City including Planners, Engineers, Public Works field personnel, Police, and City Managers.
West Linn is located in the northwest corner of the United States. The Pacific Northwest includes the states of Washington, Oregon, and Idaho. West Linn is located west of the Cascade Range, in the Portland Metro Area, approximately 20 minutes from downtown Portland as shown in Figure 1. Mt. Hood is approximately 50 miles east and the Pacific Ocean is approximately 75 miles west. The Willamette River follows the eastern boarder and the Tualatin River is to the south. The older areas of the City are near the rivers and newer development is occurring in the interior, higher elevations of the City. West Linn has primarily Residential development with few areas of commercial and light industrial development. Mt. Hood is the highest location in the state of Oregon at 11,240 feet. West Linn's annual rainfall is approximately 47 inches.
Figure 1. Location of the City of West Linn
The City of West Linn manages the storm water that is collected by curb inlets, roof drains, ditches, and catch basins. This also includes detention facilities including ponds and wetlands, as shown in Figure 2.1. The terrain is steep in some locations and these facilities allow the rainwater to flow down the hills slowly so that wash outs are kept to a minimum. This storm water is a separate system from the sanitary sewer system and the storm water flows directly into the Willamette and Tualatin Rivers. The City of West Linn also provides drinking water to the residents of West Linn. Rosemont Reservoir is located at the highest point in the city (760 feet) as shown in Figure 2.2. The reservoir is approximately 100 feet high. There are six reservoirs in the City. The water is drawn from the Clackamas River. Finally, the City of West Linn manages and maintains the City's Sewer System. There are nine pump stations in the City. Pumping is required when the sewer pipes can no longer flow by gravity through the line. A sewer pump station is shown in Figure 2.3. These are called lift stations because they pump the sewage to a higher level where it can flow again by gravity. The City has 110 miles of sewer pipes with about 2.3 million gallons pumped per day.
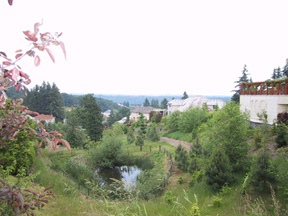
Figure 2.1. Storm Water Facility
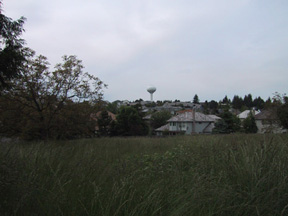
Figure 2.2. Water Reservoir
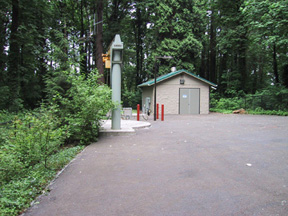
Figure 2.3. Sanitary Sewer Pump Station
There has been new residential development in the Portland Metro Region over the years, including the City of West Linn. Some of this new development is high density housing as shown in Figure 3. This type of development is preserving some of the farmlands and natural resources from development by putting more homes in a smaller land area. There are over 20 parks in the City of West Linn. There are more than 430 acres of parkland and over 150 acres of designated open space in the City. The largest park is Mary S. Young State Park. It's over 130 acres and is located on the Willamette River.
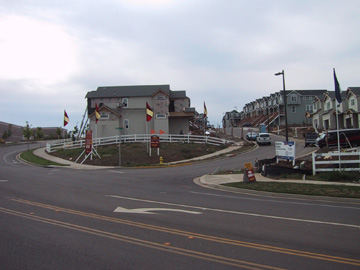
Figure 3. High Density Residential Development
The GIS at the City of West Linn was started in 1996 with the development of a ground control network and generation of ortho-rectified aerial photography. In 1998 the City hired a GIS Coordinator to develop the program further. Kathy Aha, the GIS coordinator, has been with the City of West Linn for over four years. Her background includes 10 years GIS work experience in local government using ArcInfo/AML, ArcView/Avenue, MapObjects/Visual Basic, HTML, and cartography. Lee Sickler, the GIS technician, was hired in late 2000 and has 10 years experience in local government also using ArcInfo, ArcView, and cartography.
The current GIS structure is shown in Figure 4. The main GIS computer server is an IBM X series 230 Pentium III, 1GHz with 1GB RAM, and six-18 GB SCSI drives with a gigabit NIC. The core GIS team consists of the GIS Coordinator and the GIS Technician. There are a few GIS "Power Users" that use ArcView, but the majority of the City staff use the SnapMap application that was designed and developed by the core GIS team. Additionally, there are mobile GIS units and a GIS web page.
Figure 4. GIS Structure
The core GIS team develops many standard and custom paper map products. These maps can be viewed at the 2002 Esri International User Conference Map Gallery display and future posting of the display PDFs on Esri's home page located at http://www.Esri.com/.
The City of West Linn's GIS web has GIS map available in PDF and JPEG formats. The URL is http://www.ci.west-linn.or.us/GIS/gisindex.htm. Aerial photography, the City Atlas, Land Use Activity, and Utility Systems are available for viewing. Additionally, project maps are posted to the web page, including a wetland inventory project.
The core GIS team has developed the SnapMap application in Visual Basic/Esri Map Objects as shown in Figure 5. Staff throughout City Departments use this desktop GIS application. There are currently 50 SnapMap Users, including 6 mobile computers. SnapMap is very easy to learn and use. That's the key; SnapMap requires very little training. Additionally, it can run on most of the computers at the City. Minimum requirements for SnapMap are Pentium I, 233 MHz, 32 MB RAM, Windows 95, 800x600 screen resolution. Suggested computer specifications are Pentium III with 64 MB or more of RAM, Windows 98 or NT.
Figure 5. SnapMap Application
Geographic Information available through SnapMap includes:
City Boundaries: City limits, neighborhood associations, public works districts, police districts, urban growth boundary, historic district, water pressure zones, storm water drainage basins, and map grid systems.
Environmental: Four foot interval 1996 contours and spot elevations, Five foot interval 2000 contours, creeks, rivers, and streams, 1996 flood line and property and road flood information, soil types, wetlands, wildlife habitat (in work).
Land: Historic landmarks, open space, parks, paths and walkways, places, business license locations, zoning, comprehensive plan, land-use, buildable land inventory (including information on build-out potential), development tracking..
Property: Master address file, individual apartment addresses, city owned property (by type classification), plat outlines and names, structures, tax lots (coordinate geometry based and includes county assessment information), historic lot lines, easements, and GPS control network.
Streets: Edge of pavement, closed streets (unimproved right-of-ways), private streets, address street centerline, freeways, ramps, bridges.
Utility: Sanitary sewer system (including facility numbering system, rim and invert elevations, manholes, cleanouts, pump stations, etc.), water system (including line size, meters, valves, hydrants, etc.), storm water system (includes piped facilities, open water ways and ditches, detention ponds [both private and public], manholes, etc.), abandoned utility facilities.
Text Annotations: street names, address numbers, tax lot annotations (including lot numbers, taxlot numbers, line measures, plat names, etc.), and all utility annotations.
Ortho-rectified Aerial Photography: 1996, 1999, and 2001 (One foot pixel).
Scanned Images: as-built construction drawings, assessor tax maps, recorded plat maps, 1966 planimetric maps, and other project maps.
Search Functions: searching by address, street name, map grid number, place name, tax lot number, plat name, sanitary sewer basin or facility number, or property owner.
Other SnapMap Tools: map zooming, panning, identify, measuring, set scale, reset
Here's who using SnapMap:
Public Works: Originally an ArcView application was developed by working directly with the first line supervisors and field crews for an interface that would work for them. The SnapMap application mimics the original ArcView application, so it was an easy transition of them to learn to use SnapMap.
Front Counter: SnapMap is used at our City Hall front counter to help the public with building permitting, planning, and engineering related questions and issues.
Office Staff: SnapMap is used by other departments within the City, like Parks, Planning, Building, and Engineering.
Managers: The Department Managers are using SnapMap; it is very easy to learn and they can print their own maps. This frees up time for the GIS core team for application development and custom map production.
Utility Locates: There is a mobile version of SnapMap that is used by the City's Utility Locate Staff. This person uses the application in their vehicle to find approximate location of Water, Storm Water, and Sanitary Sewer facilities so they can mark the locations in the public right-of-way. A Panasonic Toughbook Computer is used that has a touch screen and allows the operator to interact with the tools and map with a stylus. The computer is mounted in the vehicle, but can easily be removed for updating the system.
Police: The Police Officers are using SnapMap in their offices. It has become a business tool that is used on a daily basis. Additionally, they are using SnapMap in their patrol vehicles also on Panasonic Toughbook Computers.
Emergency Operations Center (EOC): SnapMap is available on all the EOC computers. The Emergency Operation Center is activated if there is a major emergency like floods, winds storms, earthquakes, or other disasters. SnapMap and large GIS wall maps are used to find and track addresses and other locations in the City.
Developing a successful GIS is a juggling act. Some of the City staff still needs assistance using the GIS, so the core GIS team provides training and guidance when necessary. The SnapMap application has been designed, written, and deployed by in-house resources. The GIS data is well organized so it can be wrap up in a single package. Consistency and accuracy of the GIS data are very important since staff relies on the GIS as a business tool. Keeping the GIS map layers up to date doesn't happen overnight . The GIS Team has worked very hard to update the GIS map layers. The City of West Linn's Utility Systems that were years out of date are being updated and enhanced by the GIS Technician. Additionally, this couldn't happen without the work of other regional government agencies. The City's GIS Coordinator has worked directly with Clackamas County GIS to develop an accurate tax lot base as shown in Figure 6.1 and 6.2. Furthermore, Metro, the Regional Planning Agency, has led the way with RLIS and RLIS-lite products.
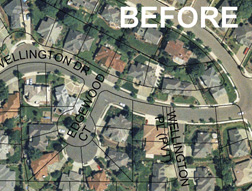
Figure 6.1. Development of an Accurate Tax Lot Base, Before
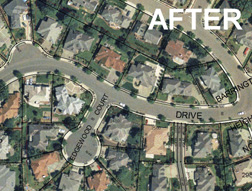
Figure 6.1. Development of an Accurate Tax Lot Base, After
The author would like to acknowledge the follow people and organizations for their participation and support in the development of the City of West Linn's GIS:
Dennis Wright, City Engineer, City of West Linn
Lee Sickler, GIS Technician, City of West Linn
22500 Salamo Road, No. 800, West Linn, Oregon 97068
Clackamas County GIS
121 Library Court, Oregon City, Oregon 97041
http://www.co.clackamas.or.us/gis/
Metro's Data Resource Center
600 NE Grand Ave., Portland, Oregon 97232
http://storefront.metro-region.org/drc/
Oregon Department of Corrections, Inside Oregon Enterprises
2767 22nd Street SE, Salem, Oregon 97302
http://www.doc.state.or.us
David Smith and Associates
1734 SE Tacoma, Portland, Oregon 97202
http://www.easystreet.com/~dsapdx/
Kathy Aha, GIS Coordinator, City of West Linn
22500 Salamo Road, No. 800, West Linn, Oregon 97068
http://www.ci.west-linn.or.us
kaha@ci.west-linn.or.us