Robert Pincus
Business Systems Analyst
County of Riverside TLMA - GIS Applications
Phone: (909) 955-1875 Fax: (909) 955-6879 rpincus@co.riverside.ca.us
This paper discusses the Avenue scripts written to support the County of Riverside's Redistricting process. The underlying geographic unit of the ArcView Redistricting project and scripts was the Census Block and it's associated population data. By selecting groups of Census blocks and summarizing the population of the selected set, users were able to quickly identify the effects of Census block reassignment on a Supervisorial District. As selected sets of blocks were assigned, the population and configuration for each Supervisorial district could be compared and further modifications made. Scripts were also written to save the various proposals for reference or further modification.
At the County of Riverside, GIS staff was involved with the 1990 Census and the Board of Supervisor's Redistricting process. In 1991 County GIS Applications Staff developed a mini-computer based ArcInfo AML application for this process. While working with a 20 member Board appointed redistricting committee, the redistricting effort took 10 months. This committee reviewed various scenarios during this period of time and over 250 different map sets were distributed. The redistricting process in 1991 cost the County over $250,000 in staff time and other resources in order to complete the redistricting process. Several special interest groups considered challenging the redistricting process and resulting districts in court, but they soon concluded that it would be very difficult to review and or challenge due to the size and scope of the GIS work that was completed.
In 1998, County GIS participated in the Census Bureau's LUCA Program (Local Update of Census Addresses), in preparation for the 2000 census. Through this process, the County reviewed over 1,500,000 addresses from various record sets from the County and local agencies. Approximately 32,000 newly verified addresses were submitted under the LUCA process. The County also submitted a large number of jurisdictional boundary changes that affected 40 LUCA source maps. These programs and other components are described on the Agency Web page at the following address: www.tlma.co.riverside.ca.us/census.html
County staff involved with the 1991 redistricting process recommended to the Board of Supervisors and the Executive Office that a citizens redistricting committee not be appointed, as it was in 1991, so that the 2001 redistricting process could be accomplished quickly and at a lower cost. Additionally, this would allow the technical aspects of the process to be accomplished prior to the public hearings. After much discussion, the Board of Supervisors accepted the staff's recommendation. County GIS staff started working immediately on the Tiger Line files and the PL 94-171 file that was released by the Census Bureau on 4/2/2001.
In March 2002, the Census Bureau released population counts for California's counties. The numbers indicated that the County of Riverside was the fastest growing county in the state. Between 1990 and 2000 the population increased by 32 percent. While this did not affect the redistricting process, GIS staff did respond to numerous requests from county departments, agencies, and the public and news groups to provide census information.
Staff members from the Executive Office, County Counsel, TLMA GIS and Legislative Assistants representing each supervisor formed a committee to proceed. On April 10, 2001, the committee met and formalized a plan of action and a schedule to handle all aspects of the project. An additional requirement to the process was that the Supervisor's Districts be adopted no later than August 21, 2001 so that the Registrar of Voters could adequately prepare for the November elections.
What was most important to GIS was to make the Census data usable, formalize a set of tasks that needed to be accomplished and develop scripts and Applications to start the redistricting process. With a growth rate of 32 percent countywide, it was expected that the population of the Supervisorial districts would change considerably. Once census numbers were released at the block level, we were able to determine the scope of the redistricting process and the amount of work that would be required to modify the districts for a draft plan that could be taken to hearings. One objective of this redistricting plan was to reduce the number of cities that were split by Supervisorial districts.
Over the next two months the redistricting committee met on a weekly basis to discuss proposals, modifications, and changes as additional information became available. Each Board Legislative Assistant provided considerable input from the supervisor they represented in regards to any change in boundaries that would be considered or proposed. By the middle of June, the committee had developed a draft version of the redistricting plan that balanced the population in all districts.
When crafting the new supervisorial district boundaries, GIS staff had to take into consideration the location of every supervisor's place of residence. A supervisor's place of residence must be within the district they represent. This complicated the process due to the fact that three county supervisors actually lived within the City of Riverside, just a few miles apart. Therefore, GIS staff had to be rather creative in the way they crafted the new district boundaries. The boundaries that were crafted looked very strange, but met they did met the criteria.
Then in late June, in the middle of the process, one county supervisor announced that he would not be seeking re-election. He happened to be one of the supervisors living within the City of Riverside, just a few miles from the others. His decision changed everything, for a couple of reasons. It gave the supervisors and their staff an opportunity to recreate the districts in a way that wasn't available before. It was also an opportunity to redistrict the City of Riverside. The supervisors expressed a desire to represent the City of Riverside with two districts rather than three. Everyone participating in the process agreed that this idea made sense. Therefore, the redistricting committee was directed to develop new proposals that reflected the supervisor's objectives and desires.
In late June, the committee crafted a proposal in preparation for the public hearing process and was published in local papers. The Agency posted downloadable versions of the proposed district boundaries on it's Internet website for viewing by the public. Various formats were made available on the website from PDF to JPG and from sizes 8.5x11 to large plotter format. An ArcIMS interactive mapping solution, displaying the proposed boundaries, was also available on the agency's website, created by the applications group. This proved very popular and experienced a high number of "hits" through this phase of the redistricting process.
"The Census Bureau's mission to count and profile the Nation's people and institutions does not require very high levels of positional accuracy in its geographic products. Its files and maps are designed to show only the relative positions of elements" (Source: www.census.gov, Tiger FAQ's).
County GIS staff transformed census 2000 data used the following methodology:
· Download the DBF and UPL data files from the US Census Bureau website.
· DBASEINFO command to convert the DBF template files to INFO template files.
· ADDFROM the population data (DBF files) into the INFO template file.
· Download Tiger Line shape files (census blocks) from Esri.
· SHAPEARC the block Shapefile to a census block coverage.
· PROJECT the coverage to NAD83_Stateplane_California_VI_Fips_0406 (Feet).
· CLEAN the coverage.
· REGIONPOLY the coverage to create polygon topology.
· TRANSFORM the block coverage using 12 strategically placed tics in both the block and the Supervisorial coverage.
· BUILD the block coverage for poly.
· UNION the block coverage with the SUPERVISORIAL coverage.
· COPYINFO the block coverage.pat and call it (coverage.pat2 as a copy).
· SORT the coverage.pat by STFID, AREA.
· SORT the coverage.pat2 (copy) by STFID, AREA (D).
· ADDITEM SUP-ID and S-NAME to the block coverage.
· Add RELATES X, Y to relate the coverage.pat and its copy.
· CALC SUP-ID = Y//DIS-ID
· MOVE Y//NAME TO S-NAME.
· Open the transformed block polygon coverage in ArcView. In legend editor, select for unique value (sup-id). Those polygons whose sup-id = 0, of which there were ten, were assigned to a Supervisorial district based upon spatial analysis.
· Join the population data INFO file to the block polygon coverage.
· Summarize the population data to generate "Existing Population by Supervisorial District".
County GIS developed a methodology to be used if and when block splitting became necessary. Some block splitting was necessary in 1991, in cases such as city boundaries splitting census blocks. Time-consuming block splitting was done only when absolutely necessary as mandated by the Board of Supervisors. Analysis of the census blocks that are split by the Supervisorial boundaries is as follows: Each split census block is evaluated using parcel data, assessor data and aerial photos. The aerial photos show where the homes are located and the assessors data linked to the parcels reveal attribute data associated with each structure identifiable in the photos. The homes within these blocks have been identified according to the number of bedrooms, square footage, and structure value. The number of structures identified as homes or residences in each half of the split census block are summed and a ratio formulated. The population calculated for each half of the split census block is proportional to the ratio of homes in each.
The first Public Hearings on the proposed supervisorial district boundaries, was held by the Board of Supervisors on July 10,2001. In support of the hearing process, GIS staff utilized a laptop with ArcView 3.2a and PowerPoint Slides. The PowerPoint presentation and the ArcView project was developed to illustrate the proposed changes to the Supervisors districts. The ArcView project and slides were projected on a large screen during the hearings. A considerable amount of public testimony was taken during this hearing and the hearings continued to the next board meeting. During the first hearing, staff members from GIS and the County Surveyor's office recommended a series of small technical changes to the boundaries for the purpose of writing a proper legal description. The recommended changes did not have an impact on the population numbers.
At the next public hearing on July 17,2001, additional changes to the proposed boundaries were presented by the Registrar of Voters and County Surveyor for consideration by the Board. The Registrar of Voters had an election to prepare for and they had recommended changes to boundaries based upon the location of precincts around the county. GIS staff and the CEO's office again presented a PowerPoint presentation and an ArcView project for purposes of discussion and illustration.
In the next set of hearings on July 24,2001 small changes to the proposed districts were recommended by the redistricting committee and reviewed for the public. Again these changes and maps were projected on a large screen and ArcView and PowerPoint were used to show the changes and effects on the population numbers for each district. Some of the changes proposed moved cities from one district to another, which changed the population counts within the districts by very large amounts. The Board approved several proposed modifications and other changes to the boundaries and a "Recommended Plan" was approved by the Board on July 31,2001.
The approved redistricting plan was placed on the TLMA GIS website on August 2, 2001. An ArcIMS application was developed so that the public could view in higher detail specific changes to the district boundaries. Ordinance 813 in support of the Board's action and a legal description were written and maps were created and posted @ www.tlma.co.riverside.ca.us to adopt the new districts. The new district boundaries were then approved by the Board of Supervisors on August 14,2001 with the adoption of Ordinance 813. The final versions were then posted on the Agency's Internet website.
As usual, with any project of this size and scope, more work needed to be done in support of the changes made by the adoption of Ordinance 813. Listed below are just a few of the items the GIS team was tasked to do:
· Internet Website and ArcIMS
Update the Internet Website to reflect the adopted status of the ordinance, provide a variety of options to retrieve the information through electronic methods, and reduce the amount of staff time spent distributing this information to the public. Additional existing web applications need to be modified as well as a new module created based on discussions with the County PIO. Create an Internet application that can be queried using an APN or street address, to give users a visual representation of which Supervisorial District they live in.
· Maps
Even though the Internet website will have maps that can be downloaded and printed, standard maps will have to be created and made available for sale at both the Public Information Counter, 2nd Floor, and the office of the Clerk of the Board. All standard supervisorial district maps previously created, must be updated.
· Legal Descriptions/Ordinance
Make available text versions of the legal description.
· Documentation
Notes, copies of maps and all other records summarized and filed in chronological order and stored on CD, stored in an accessible location.
· Geo-Info
A consistent naming convention for existing supervisorial district coverages and shapefiles will have to be formulated to reflect dates of modification, etc. Create metadata for the data dictionary consistent across all platforms such as Librarian, Informix, Oracle, and SDE. Finally we need to review all GIS systems and archive any supervisors shape files or coverages with the old data convention. Geo-Info and other applications need to be set up to use the new naming conventions and report both 1991 and 2001 versions.
· Development Cases and Projects
Review all systems utilized by the Agency and its Departments to assure that projects, cases or other items that indicate supervisor's districts reflect the correct district. The applications groups in IR and GIS will need to work together to resolve and identify any problems in those areas. Transportation projects and TIP will need checking as well for any areas that have changed districts.
GIS Staff created a customized ArcView project to aid in the redistricting program. Because Supervisorial staff would be working together with GIS Staff, the ArcView project did not have be modified significantly.
Figure 1 shows the ArcView project that was used during the redistricting process. All of the staff meetings were held inside the County Administrative Center building in Riverside. One laptop was networked to the County's Windows NT Terminal Server via a Citrix connection.
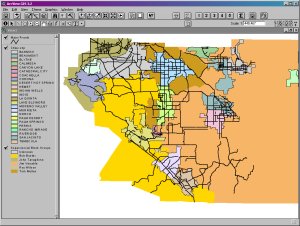
The key component for the ArcView Redistricting Project is a coverage of census block polygons called BLOCKS. The BLOCKS coverage is census block polygons joined to the PL 97-171 (unadjusted) population data from the census bureau
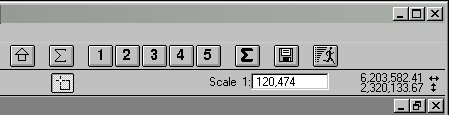
Figure 2 shows a close-up of the customized buttons for the ArcView project.
I'd like to acknowledge the following contributors to this paper presentation: Pat Egetter Information Technology Officer III, William Mumbleau GIS Managing Supervisor, and Jeff Letterman Senior GIS Specialist.
The redistricting project was completed in approximately 4 ˝ months compared to 10 months in 1991. The redistricting process used in 2001 was considerably more efficient. County GIS delivered the project for $108,000 in comparison to the $254,000 expended in 1991. Taking into account inflation and cost of living, it is clear that current technology played a major role in reducing costs and staff time necessary to complete the redistricting project.
· "County Redistricting Plan and Process", April 10,2001, an internal County Document created by Pat Egetter Information Technology Officer III for GIS. County of Riverside Transportation and Land Management Agency (TLMA).
· County of Riverside Board of Supervisors District Website, May/June 2001 to Present @ www.tlma.co.riverside.ca.us/districts/index.html, maintained and supported by the County of Riverside TLMA on behalf of the Board of Supervisors.
· The U.S. Census Bureau website at www.census.gov