Elevation, slope and aspect significantly influence vegetation heterogeneity in mountain ecosystems. Remotely sensed surface reflectance, if used to analyze such heterogeneity, is substantially affected by differences induced by slope and aspect.
A GIS combining digital elevation models (DEMs), Landsat-7 imagery and georeferenced field data was built to map the distribution of vegetation in two community-based conservancies in the Hindu Kush cordillera of Pakistan.
DEMs were used to divide satellite imagery into high and low sun illumination categories before image classification. Field verification and empirical rules relating to the altitude and aspects at which different vegetation types occur were then used to refine the landcover classification.
Northern Pakistan is physically diverse with elevation ranging from 2000m to 8000m. Such a high topographic relief results in significant vegetation diversity. Of particular interest is the difference between warm southerly facing slopes and cooler northerly slopes. Mapping this vegetation diversity with satellite image classification techniques is complicated by the high topographic relief. The interaction between the sun angle and the slope and aspect of the ground surface result in significant shadowing effects in the reflectance data. The use of digital elevation models (DEMs) to minimise terrain shadow effects in satellite imagery has been documented both in Pakistan (Millington and Jehangir, 2000) and abroad (McDonald et al., 2000). Such remote mapping methods are required where the rugged terrain and harsh climate limit field observations.
The objective of the current study is to document baseline landcover types in two areas of the Hindu Kush mountains in north-western Pakistan, as part of the UNDP/GEF funded Mountain Areas Conservancy Project (MACP). The aim of the project is biodiversity conservation through community managed sustainable use of natural resources. These conservancies are complexes of a few contiguous watersheds (valleys) where the human population lives mainly in the valley bottom. Communities share natural resources such as forests for fuel wood and range lands for livestock grazing in each watershed. Different land features of these valleys are important habitat for many resident and migrant fauna species which need sustainable conservation (NWFP Wildlife Department, 1999). Baseline landcover maps will assist field conservationists to plan conservation measures and land use activities according to available natural resources and local community needs, and to monitor the impact of conservation practices on these major landcover types after 5 – 7 years.
In the current study, a combination of satellite image classification, Digital Elevation Model (DEM), ground truthing and empirical rules based on local knowledge of the ranges of certain vegetation types were used to build an accurate landcover map. Sun illumination data can be calculated from the DEM and the sun's elevation and azimuth at the time of the satellite overpass. The non-vegetated areas were first separated using a vegetation index filter. The sun illumination data was then used as a mask to separate the vegetated areas into two, namely sunlit vegetation and shaded vegetation.
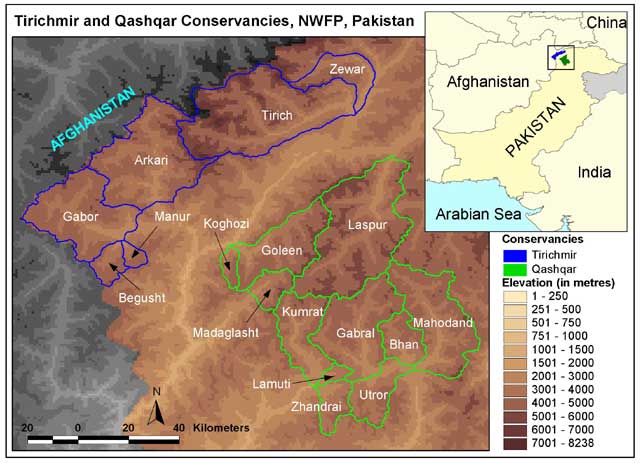
The two project areas of the current study are the Qashqar and Tirichmir conservancies in the North Western Frontier Province (NWFP) of Pakistan (Figure 1).
Figure 1. Qashqar and Tirichmir conservancies, northern Pakistan, showing individual valleys. Tirichmir conservancy and the northern valleys of Qashqar (Laspur, Goleen, Koghozi) fall into the dry temperate climatic zone, while the southern valleys of Qashqar fall into semi moist temperate zone.
Qashqar conservancy lies between 71°54'N to 72°50'N and 35°16'E to 36°16'E and covers an area of 453,650 sq. km. Elevation ranges from 1600m (near Koghozi town) to 6542m (Booni Zom). In the upper catchments, slopes of up to 80° can occur. The central high alpine zone (mostly above 4,500m) of the conservancy divides it into two different vegetation zones. The southern part of the conservancy is under the influence of both the south-west Indian monsoon and Mediterranean weather systems so the climate is transitional between semi moist temperate to dry temperate, while the northern part of the conservancy is in dry temperate climatic zone with more precipitation (snow) during the winter season due to Mediterranean westerly winds (Khan, 1991). This climatic difference influences vegetation cover. The main conifer species are Picea smithiana, Cedrus deodara, Pinus wallichiana, Pinus roxburghii (dominates in southern part of the conservancy) and Juniperus communis (dominates in the north). Dominant broadleaf species are Quercus baloot (in southern Qashqar), Populus alba and Populus ciliata (in the north) and Salix denticulata. The dominant shrubs and herbs are Rosa webbiana, Juniperus macropoda, Artemesia sp. and Hypophae rhamnoides (mainly in the north) and grasses.
Tirichmir conservancy lies between 71°12'N to 72°28'N and 35°48'E to 36°38'E and covers an area of 347,900 sq. km. Elevation ranges from 2160m to 7690m at Tirichmir peak (highest peak of Hindu Kush cordillera). In the upper catchments, slopes can also be as high as 80°. The whole conservancy falls in the dry temperate climatic zone where precipitation pattern is completely based on Mediterranean westerly winds during winter. The dominant conifer species are Juniperus communis and Juniperus macropoda while dominant broadleaf tree and shrub species are Populus alba, Populus ciliata, Salix denticulata, Rosa webbiana, Artemesia sp., Ephedra sp. and Hypophae rhamnoides.
The Landsat-7 ETM+ (Enhanced Thematic Mapper) scene for the region covers both Qashqar and Tirichmir conservancies. A recent late summer scene with minimal cloud cover was required and the scene acquired on 6th August 1999 was purchased. The digital elevation data (DEM) was obtained by on-screen digitizing of contour lines from scanned 1:100,000 scale Russian topographic maps.
The topographic maps were rectified from their original coordinates to a local Lambert Conformal Grid system (Pakistan Zone 1), using control points marked on the maps. The satellite image was rectified to the same grid, using stream intersections from the topographic maps. It was assumed that the mountain terrain and stream beds did not change drastically over time. The final precision between the two datasets was about 30m (1 pixel), increasing to 100m (3 pixels) in a few locations where good control points were not available due to clouds or braided stream intersections.
An iterative finite difference interpolation technique (TOPOGRID algorithm in Arc/Info) was used to generate a 30m pixel, hydrologically correct DEM from contours, spot heights and drainage (Esri, 1994). From this DEM, sun illumination, slope and aspect datasets are calculated. The sun illumination data shows the relative intensity of sunlight hitting the ground surface throughout the project area. As the satellite image was taken in late morning in August, with the sun high to the southeast, steep northwesterly slopes receive the least amount of sunlight.
An initial classification of the satellite image was undertaken to give a broad picture of the distribution of forest, pasture/crops and non-vegetated areas. The training sites for the supervised image classification were selected by visual inspection of the satellite image and general knowledge of the types of landcover to be expected in northern Pakistan. Although not very accurate, these results helped in planning the ground-truthing field surveys.
Field surveys are required for two purposes. First, the distinct, mappable vegetation and landcover types for each conservancy need to be determined. A descriptive physiognomic classification of vegetation types was defined, adapting the Pakistan-wide scheme (Champion et al., 1965) for local conditions.
Second, field surveys are used in matching reflectance characteristics of satellite data with the land cover and vegetation types observed on the ground. Surveyed sites provide accurate training and test sites for the image classification processes described in the next section.
As the reflectance characteristics of vegetation vary throughout the seasons, ground truthing was carried out in late summer, the same season as the satellite image. Due to the extreme climate, this is also the season when the upper valleys are accessible.
Around 100 sites were surveyed, covering the major vegetation types in different valleys. A customised series of A4 size field maps at 1:50,000 scale were generated from 5,4,2 bands of Landsat satellite and topo-cadastral data digitized from 1:100,000 topographic maps. Data encoding form, digital camera and GPS receivers were used to record different landcover features, their percentage cover on the ground, photographic record of observation and geographic position of survey point. All this information was later stored in a custom built relational database which was linked with the satellite imagery, DEM and other cadastral data in an ArcView GIS. This integrated information system provided an efficient method of organising, visualising and querying all relevant data for the final classification of the satellite imagery into an accurate landcover map.
Figure 2 shows the steps used to build an accurate landcover map through classification of the satellite image, using all of the information described above.
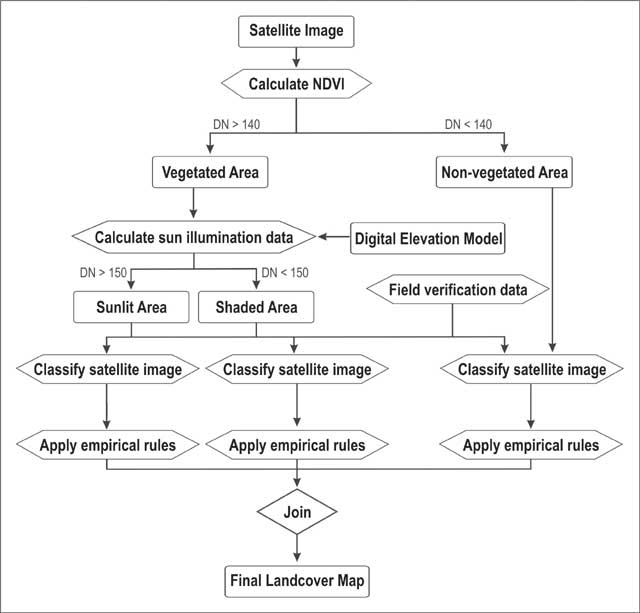
Figure 2. Processing and analysis steps used to calculate a landcover map from satellite data, DEM, field verification and empirical rules.
A normalised difference vegetation ratio (NDVI) was calculated from the satellite image. As NDVI is a ratio, the effect of differences in solar illumination is reduced, with high values indicating higher concentrations of green vegetation (Sabins, 1996). By comparing the results with field survey information, it was decided that the Digital Numbers (DN) above 140 represent green vegetation while below this DN represents non-vegetation. The satellite image was masked using this limit and as a result, satellite data was divided into vegetation and non-vegetation data.
The high topographic relief in the project area results in significant shadowing effects in reflectance values in the satellite data. The sun illumination data created from the DEM (using the same sun azimuth and elevation as of satellite data) was visually compared with the satellite image. An illumination threshold of 150 DN (or 56% of maximum illumination) was determined as providing the most logical break between shaded and sunny slopes. Masking the vegetation data with this threshold placed flat valleys, crests and south-easterly slopes in the sunlit class, with north-westerly slopes making up most of the shaded class.
The vegetation types described during the field survey occur in both the shaded and sunlit areas, with some variations due to habitat preferences. Training sites for the image classification were selected from the field survey data. The classification was refined until there was a good match between the complete set of field data and the boundaries of landcover classes.
Figure 3 illustrates the advantage of separating shaded and sunlit areas of vegetation. The mean pixel value, or digital number (DN) for each band of Landsat data has been calculated for each landcover class. The DNs of broadleaf and conifer forest classes are shown in Figure 3 for both the sunlit and shaded areas. It is obvious from this graph that shaded areas have lower DNs for all bands, compared with sunlit areas. However conifer forests also have lower DNs than broadleaf forests, especially in bands 4, 5 and 6. Many pixels which have been correctly classified as shaded broadleaf class would have been incorrectly classed as conifer if the shaded and sunlit areas were classified together.
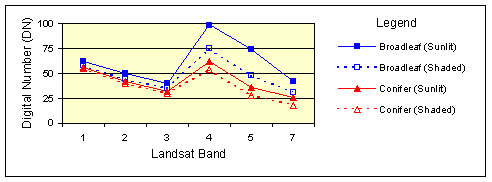
Figure 3. Mean pixel value or digital number for each band of Landsat data, for sunlit and shaded broadleaf and conifer classes.
Classification of the non-vegetated part of the satellite image resulted in a set of classes showing differences in rock and soil character, and variations in the snow and ice cover. As these differences are not of interest for the final landcover map, many classes were merged to create the simpler non-vegetation classes shown on the final map.
The main factor behind the application of empirical rules to the landcover classification is the altitude, slope and aspect limits of vegetation types. The following rules were applied;
The three datasets described above were merged to create a final landcover map of the complete project area. This landcover data is extracted for individual valleys delineated on the basis of watershed.
The final landcover map is shown in Figure 4. A detailed description of each landcover class is given below.
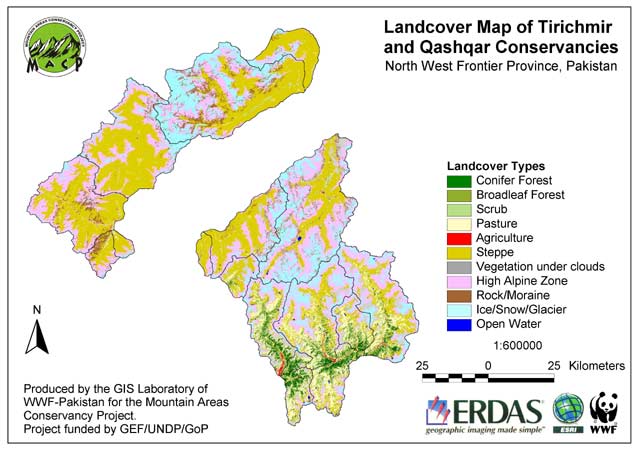
Figure 4. Landcover map of Qashqar and Tirichmir conservancies, showing the distribution of landcover classes and valley boundaries.
South Qashqar holds over 99% of total conifer of these conservancies. Coniferous trees of this region include blue pine, deodar, spruce and fir, however in the North Qashqar and Tirichmir conservancies stunted growth of juniper is also classified as this class. The majority of coniferous forest with a canopy cover greater than 33% falls into this class. Some sparse coniferous or mixed broadleaf forests may also be part of this class.
This class covers both naturally occurring climax species, mainly oak, wild olive and birch, and plantation and orchard trees, including poplar, willow (also found naturally), apricot and walnut. In the northern Qashqar and Tirichmir valleys seabuck thorn is also included. The majority of broadleaf forest with a canopy cover greater than 33% falls into this class. Most dense (greater than 33%) shrub areas also fall into this class. A few areas of vegetation in the valley bottoms (mostly agriculture) covered by light cloud shadow have been wrongly classified into this class.
Shrubs occurring in the region are mainly broadleaf plants including wild rose, artemesia, indigofera and ephedra species. In the upper valleys of southern Qashqar, patchy juniper is also present. The majority of shrub lands with a canopy cover up to 33% are classified as scrub forest.
Sparse cover of broadleaf or coniferous tree species (as defined above) may fall into this class. Some areas of dense pasture (greater than 66%) may also fall into this class, as will some agricultural areas, especially mixed trees and crops.
This class mainly includes good cover of pasture (mostly above 66%, in some places above 33%). The main vegetation types are grasses and herbs. At higher altitudes, mixed sparse tree/shrub (coniferous and/or broadleaf) and pasture areas are also included in the same class. This class does not reflect any information about degraded or overgrazed pasture.
This class is composed of very sparse pasture and shrub land where more than 66% of the ground is barren soil or rock.
All agriculture, both fodder and seed crops, have been classified as agricultural land. In a few cases, very good pasture (with above 67% grass cover) also falls into this class, due to the very similar and high reflectance of crops and pastures. However any fallow or harvested fields may not been classified as agricultural land.
This area has very sparse vegetation on exposed rock and stays under snow during most of the year. The lower altitude limit for the high alpine zone is generally 4200m on northwest slopes and 4400m on southeast slopes.
Any cloud or its shadow below high alpine zone is classified as vegetation under cloud. Although not precise, it allows an estimate of the maximum vegetation cover in each valley. Tirichmir conservancy has all clouds in the high alpine zone so this class does not exist for this conservancy.
The visible or melting snow and glaciers are fall into this class. As many of the snow covered peaks are also covered by cloud, the permanent snow and glaciers digitized from the topographic maps also fall into this class.
Scree slopes, exposed rocks and bare soil near glaciers fall into this class.
All lakes digitized from the topographic maps were added to the final landcover data as open water class. Tirichmir conservancy has no lakes.
Table 1 shows the area covered by each landcover type for Tirichmir, North Qashqar and South Qashqar. It is evident from Figure 3 and Table 1 that the semi moist temperate zone (South Qashqar) is more densely vegetated than the dry temperate zone (North Qashqar and Tirichmir), as expected. The dense vegetation classes of forest, scrub, pasture and agriculture combined cover less than 2% of the total area for the dry temperate zone, while the sparsely vegetated high alpine and steppe classes cover approximately 70% of the total area (Table 1, North Qashqar and Tirichmir). For the semi moist temperate zone of South Qashqar, dense vegetation and sparse vegetation are equally common, covering approximately 40% of the total area each (Table 1, South Qashqar).
Table 1: Percentage area covered by each landcover class in Qashqar and Tirichmir conservancies.
|
Class |
South Qashqar (semi moist temperate) |
North Qashqar (dry temperate) |
Tirichmir (dry temperate) |
Total Area |
|
Conifer forest |
5.85 |
0.01 |
0.00 |
1.99 |
|
Broadleaf forest |
8.60 |
0.08 |
0.13 |
3.00 |
|
Scrub |
2.96 |
0.56 |
0.46 |
1.33 |
|
Pasture |
18.91 |
0.98 |
1.20 |
7.16 |
|
Agriculture |
0.61 |
0.16 |
0.20 |
0.33 |
|
Dense vegetation (conifer, broadleaf, scrub, pasture, agriculture) |
36.93 |
1.78 |
1.99 |
13.81 |
|
Steppe |
18.80 |
31.10 |
46.87 |
33.76 |
|
High alpine zone |
23.26 |
35.32 |
28.76 |
28.38 |
|
Sparse vegetation (steppe, high alpine) |
42.07 |
66.42 |
75.63 |
62.14 |
|
Vegetation under cloud |
8.84 |
6.14 |
0.00 |
4.39 |
|
Rock/Moraine |
0.00 |
4.86 |
6.80 |
4.05 |
|
Ice/Snow/Glacier |
11.73 |
20.57 |
15.58 |
15.40 |
|
Open water |
0.43 |
0.23 |
0.00 |
0.20 |
The distribution of vegetation and other landcover classes has also been calculated by valley (Tables 2 and 3). Tables 4 and 5 show the distribution of major landcover types in each valley. Within South Qashqar, the southern valleys of Lamuti, Zhandrai and Utror have the highest percentages of all types of forest (conifer, broadleaf and scrub), while Madaglasht valley, which is transitional to the dry temperate zone, has the lowest percentage of all types of vegetation. Other than Madaglasht, the percentage of rangeland (pasture and steppe) is relatively constant for each valley, but Kumrat has by far the greatest percentage of agricultural land.
In North Qashqar, the large Laspur valley has the highest percentage of high altitude land (high alpine and snow/ice) and the lowest percentage of steppe while smaller Koghozi has the highest percentage of steppe and the lowest percentage of high altitude land. In Tirichmir, the southern valleys of Begusht, Gabor and Manur have higher percentage of scrub forest, pasture and vegetation than the northern valleys of Arkari, Tirich and Zewar. All valleys have similar percentages of steppe.
Table 2: Percentage area covered by each landcover class for Qashqar Conservancy valleys.
|
Class/Valleys |
Bhan |
Gabral |
Goleen |
Koghozi |
Kumrat |
Lamuti |
Laspur |
Madaglasht |
Mahodand |
Utror |
Zhandrai |
|
Conifer forest |
6.21 |
3.26 |
0.01 |
0.05 |
7.19 |
23.01 |
0.00 |
1.38 |
3.07 |
10.31 |
16.18 |
|
Broadleaf forest |
10.69 |
6.09 |
0.11 |
0.55 |
12.12 |
18.12 |
0.04 |
2.42 |
5.23 |
14.26 |
15.22 |
|
Scrub |
2.45 |
1.81 |
0.23 |
0.45 |
5.41 |
7.23 |
0.71 |
0.49 |
1.58 |
5.03 |
5.74 |
|
Pasture |
23.62 |
18.44 |
0.99 |
2.55 |
17.89 |
14.94 |
0.88 |
8.87 |
13.46 |
32.74 |
27.84 |
|
Agriculture |
0.27 |
0.49 |
0.04 |
0.04 |
1.60 |
0.88 |
0.21 |
0.16 |
0.39 |
0.60 |
0.47 |
|
Steppe |
17.43 |
19.52 |
45.66 |
67.63 |
11.86 |
5.23 |
22.56 |
39.14 |
22.40 |
15.52 |
10.60 |
|
Vegetation under cloud |
10.03 |
4.22 |
3.98 |
2.48 |
10.89 |
27.54 |
7.30 |
10.68 |
10.29 |
5.63 |
13.35 |
|
High alpine zone |
19.53 |
28.75 |
31.86 |
22.66 |
21.07 |
1.78 |
37.59 |
27.02 |
29.33 |
11.66 |
7.19 |
|
Rock/Moraine |
0.00 |
0.00 |
4.43 |
1.10 |
0.00 |
0.00 |
5.28 |
0.00 |
0.00 |
0.00 |
0.00 |
|
Ice/Snow/ Glacier |
9.33 |
17.17 |
12.62 |
2.45 |
11.37 |
1.27 |
25.13 |
9.57 |
14.03 |
3.30 |
2.39 |
|
Open water |
0.44 |
0.25 |
0.07 |
0.05 |
0.60 |
0.00 |
0.31 |
0.26 |
0.22 |
0.95 |
1.02 |
Table 3: Percentage area covered by each landcover class for Tirichmir Conservancy valleys.
|
Class/Valleys |
Arkari |
Begusht |
Gabor |
Manur |
Tirich |
Zewar |
|
Conifer forest |
0.00 |
0.00 |
0.00 |
0.00 |
0.01 |
0.00 |
|
Broadleaf forest |
0.12 |
0.02 |
0.06 |
0.03 |
0.21 |
0.09 |
|
Scrub |
0.30 |
1.51 |
0.55 |
1.86 |
0.39 |
0.32 |
|
Pasture |
0.56 |
2.63 |
2.81 |
2.99 |
0.62 |
0.82 |
|
Agriculture |
0.04 |
0.63 |
0.72 |
0.36 |
0.01 |
0.01 |
|
Steppe |
56.14 |
41.31 |
51.89 |
60.17 |
32.67 |
68.00 |
|
High alpine zone |
30.83 |
31.40 |
35.05 |
26.66 |
26.34 |
14.88 |
|
Rock/Moraine |
2.26 |
19.02 |
5.83 |
0.36 |
10.77 |
2.17 |
|
Ice/Snow/Glacier |
9.75 |
3.48 |
3.09 |
7.57 |
28.99 |
13.71 |
Table 4: Percentage area covered by major landcover types for Qashqar conservancy valleys.
|
Valleys/Class |
Forest (Conifer, Broadleaf and Scrub) |
Rangeland (Pasture and Steppe) |
Agriculture |
Non-vegetation (High alpine, Ice/Snow, Rock, and Water) |
Unclassified (Vegetation under cloud) |
|
Bhan |
19.35 |
41.05 |
0.27 |
29.57 |
10.03 |
|
Gabral |
11.16 |
37.96 |
0.49 |
46.65 |
4.22 |
|
Goleen |
0.35 |
46.65 |
0.04 |
49.02 |
3.98 |
|
Koghozi |
1.05 |
70.18 |
0.04 |
26.29 |
2.48 |
|
Kumrat |
24.72 |
29.75 |
1.60 |
34.65 |
10.89 |
|
Lamuti |
48.36 |
20.17 |
0.88 |
3.93 |
27.54 |
|
Laspur |
0.74 |
23.44 |
0.21 |
68.51 |
7.30 |
|
Madaglasht |
4.29 |
48.01 |
0.16 |
37.02 |
10.68 |
|
Mahodand |
9.89 |
35.86 |
0.39 |
43.97 |
10.29 |
|
Utror |
29.60 |
48.26 |
0.60 |
16.51 |
5.63 |
|
Zhandrai |
37.14 |
38.44 |
0.47 |
11.07 |
13.35 |
Table 5: Percentage area covered by major landcover types for Tirichmir conservancy valleys.
|
Valley/Class |
Forest (Conifer, Broadleaf and Scrub) |
Rangeland (Pasture and Steppe) |
Agriculture |
Non-vegetation (High alpine, Ice/Snow, Rock, and Water) |
|
Arkari |
0.42 |
56.70 |
0.04 |
42.84 |
|
Begusht |
1.53 |
43.94 |
0.63 |
53.91 |
|
Gabor |
0.61 |
54.70 |
0.72 |
43.97 |
|
Manur |
1.89 |
63.15 |
0.36 |
34.59 |
|
Tirich |
0.60 |
33.29 |
0.01 |
66.10 |
|
Zewar |
0.41 |
68.82 |
0.01 |
30.76 |
The Hindu Kush mountains of northern Pakistan are a complex environment to undertake landcover mapping. The use of a GIS to combine and analyse disparate sources of knowledge about the area allowed the effects of high relief to be overcome. Satellite image classification was improved by the use of sun illumination data derived from a digital elevation model (DEM), and field verification surveys. The landcover classes were further refined through the application of empirical rules related to slope, aspect and altitude data derived from the digital elevation model (DEM).
The resultant landcover map and description of landcover classes provide an invaluable, spatially located natural resource inventory for conservation measures in the project areas. This level of verifiable, spatially accurate detail on landcover has not been previously achieved in conservation efforts in Pakistan. Field conservationists will be able to identify the level of pressure within each valley, based on available natural resources, particularly potential grazing lands and forest cover, and the human and livestock population and land use activities. This will help them to target conservation and community education activities.
In the long term, this baseline landcover map will allow conservationists to monitor the impact of conservation practices on the natural resources, by identifying changes in landcover. Having accurate, verifiable data on the state of natural resources in the project area will also help to raise awareness of the need for sustainable land use amongst the local community, government departments and the wider community in Pakistan.
We carried out this study as part of MACP (Mountain Areas Conservancy Project) funded by UNDP/GEF and executed by IUCN. We particularly acknowledge the support from MACP staff who helped us in conducting ground verification surveys as without this data this landcover classification would not have been possible. We also acknowledge the drafting team lead by Tahir Ehsan for digitizing contours and other topographic data. A special thanks to Charles Convis, coordinator Esri Conservation Programme and Lawrie E. Jordan, President ERDAS Inc. whose personal efforts made available their state-of-the-art software to the GIS Lab of WWF-Pakistan to help in conducting such studies.
Salman Ashraf is working with World Wide Fund for Nature - Pakistan (WWF-Pakistan) as Manager, GIS Lab. Correspondence may be sent to: WWF-Pakistan, PO Box 5180, Ferozepur Road, Lahore, Pakistan, Tel: +92 42 586 2360, or by email: sashraf@wwf.org.pk
Kate Crossing was a GIS Analyst at WWF-Pakistan. She is currently with the Environmental Research Institute of the Supervising Scientist, Australia. Correspondence may be sent to: Eriss, Locked Bag 2, Jabiru, NT, 0886, Australia, Tel: +61 8 89799786, or by email katec@eriss.erin.gov.au
Qaisar Nadeem is GIS Analyst at WWF-Pakistan. Correspondence may be sent to: WWF-Pakistan, PO Box 5180, Ferozepur Road, Lahore, Pakistan, Tel: +92 42 586 2360, or by internet email :gislab@wwf.org.pk