Expanding upon the pilot study presented at the 21st Annual Esri International Users Conference, this paper reports on the continuing research into the application of GIS to identifying target recruitment areas, school districts, to improve the enrollments of minority students at Kutztown University of Pennsylvania. Two aspects of this expanded research are (1) the use of travel time rather than straight-line distance to estimate the demand potential model and (2) an evaluation of the impact of a significant minority recruitment effort by the University during the 2000 academic year by comparing freshmen enrollment patterns between Fall 2000 and Fall 2001 academic years. In addition, these freshmen enrollment patterns are compared to the results of the demand potential model. ArcView GIS is used to build the travel time matrix, estimate the demand potential model, and analyze the enrollment patterns spatially.
During the 2000 academic year Kutztown University was required to complete a Performance Outcomes Plan. The University was found to be behind the other 13 System universities in minority enrollment. A pilot study presented at the last year's Esri International Users Conference showed how GIS could be used estimate a Demand Potential Model to identify target school districts to improve minority enrollment [Martin, 2001]. This paper expands on the pilot study by developing a more 'realistic' Demand Potential Model using travel time rather than straight-line distance to identify target school districts. The Demand Potential Model is implemented through ArcView GIS, ArcGIS, and ArcInfo software using data from the U.S. Bureau of the Census, the Pennsylvania Department of Education, Pennsylvania Department of Transportation, ACT, Inc., and Kutztown University.
The second purpose of this paper is to look at the impacts of an enhanced minority recruitment effort that was undertaken by the University during the 2000 academic year. Recruitment patterns are compared to changes in freshmen enrollment patterns between Fall 2000 and Fall 2001. The enhanced recruitment efforts are also compared to the results of the Demand Potential model.
The remainder of this paper is divided into the following sections. After a review of the Demand Potential Model, the processes involved in building the databases and calculating the model are discussed. This is followed by discussion of the results of the Demand Potential model; and how the model may be applied to identify those school districts in which minority recruitment efforts should be enhanced. The applications of the model are then compared to the recruitment effort by Kutztown University. The paper concludes with recommendations for future research.
The Demand Potential Model is a simplification of the Demand Potential Surface model that was developed by Chauncy Harris in the 1950's [Harris, 1954]. The model is a measure or index of the accessibility of a location relative to other locations within a study area, which states that the demand at any location j for goods at point i is proportional to the size market at j and inversely related to the distance between j and i. As indicated in last year's paper, this model is appropriate for this study since the universities within the State System of Higher Education were established to be accessible, regional centers of higher education [Martin, 2000].
The Kutztown University demand potential, Pij, of college bound students within a school district is directly proportional to the number of college bound students in the district and inversely proportional to the intervening distance between the school district and Kutztown University. The model is represented by the following equation.
Dij is the travel time between school district j and Kutztown University, i.
The straight-line distance used in the pilot study was replaced in this study with travel time between the origin and destination. The use of travel time makes the model more realistic in the sense that most individuals in our automobile dependent society perceive time as more important than distance.
School districts to be targeted for additional recruitment efforts can be identified based on the calculated demand potentials. Kutztown University can increase the diversity of its student population by focusing on those districts with high potential and significant minority enrollment. The quality of the school district's student population may also be considered by looking at the average SAT scores along with the demand potential and the minority composition of the graduates.
As in the previous paper, data were drawn from several sources to calculate the Demand Potential Model and to identify the student composition of the school districts. Kutztown University's records, ACT (Academic Collegiate Testing), Inc., Esri data CD-ROMs, Pennsylvania Department of Education, Pennsylvania Department of Transportation, and the U.S. Bureau of the Census data sources were used in this study.
The polygon file from the previous study provides the spatial data set of all school districts within Pennsylvania used in this study. This file was originally created from Bureau of the Census unified school district files available through ArcData On Line. In addition to the name of the school district, this file contains the accounting unit number, AUN, which uniquely identifies each school district. The use of the AUN allows the Kutztown University, the High School Graduate, the Travel Time, and the Demand Potential Model databases to be joined to the school district polygons. The steps taken to develop the aforementioned databases are discussed in the following sections of the paper.
The Office of Research and Planning at Kutztown University provided a data file for the freshmen class for Fall 2001, while the Admissions Office supplied data on the visits of recruiters to high schools during the fall term of 2000. The Fall 2001 Enrollment Report provides the basic information for the spatial identification of minority enrollments patterns for the University and the basis for comparison with the Demand Potential Model. This file contained the same type of information as the Fall 2000 Enrollment Report file used in paper presented last year. Specifically, it contained information on gender, ethnicity, degree program code, high school ID code, county, state, and country for each of the 1,681 freshmen entering the University in the fall of 2001. The ethnicity codes divided the incoming students into five groups: Black, non-Hispanic; American Indian / Alaskan Native; Asian / Pacific Islander; Hispanic; and White, non-Hispanic, see Table 1.
Following the process used in the previous research, all freshmen graduating from a Pennsylvania high school were extracted from the Fall 2001 Enrollment Report. Using the high school ID code, the record for each student was matched with information from the ACT High School Address File [ACT, 2001]. The resulting file contained the school name, street address, city, state and postal code, as well as the original data for each Pennsylvania freshmen attending the University. The next step in the process was to query, match and merge this file with data from the Pennsylvania Department of Education "School Contact Directory" [PDE, 2002]. This process assigned the school district accounting unit number, AUN, to each student record in the freshmen class. This step was critical since the AUN allows the student records to be summarized by ethnicity, and school district. The summarized file was joined to the spatial database of Pennsylvania school districts using the AUN.
The high school visits information within the Recruitment Schedule from the University's Admission Office was code with the appropriate AUN for the school district of the high school. This file was then summarized AUN to provide information on the total number of visits by University Admission staff and the total number of visits was add to the spatial database.
The enrollment pattern for the freshmen classes of Fall 2000 and Fall 2001 are shown in Figure 1.
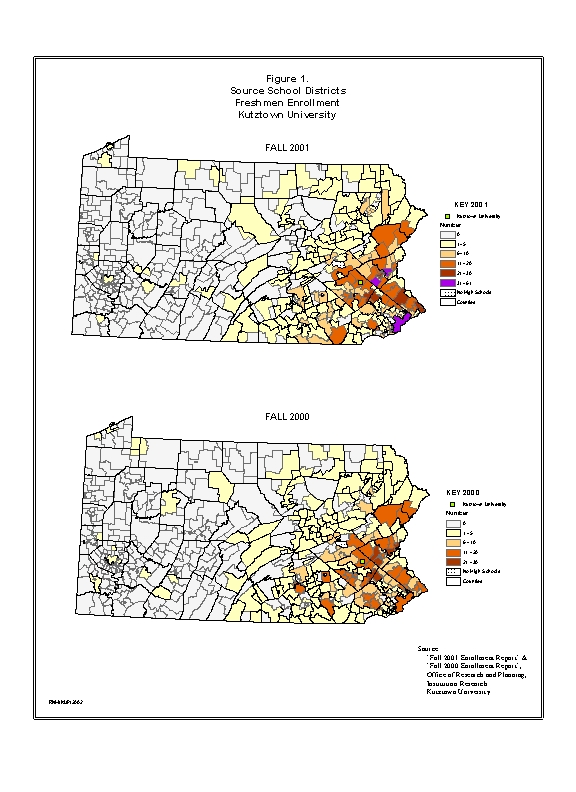
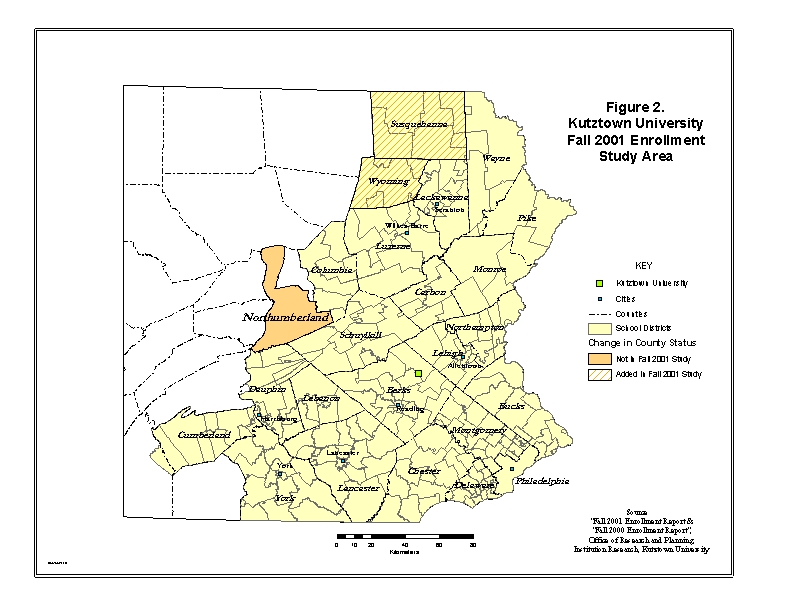
The spatial distribution of incoming freshmen shown in Figure 1 is very localized reflecting the regional character of Kutztown University. School districts in the eastern third of Pennsylvania accounted for the majority of freshmen. Reflecting this regional character of the Kutztown University market, the study area for this paper was limited to those schools districts in counties from which Kutztown received 10 or more freshmen in the Fall 2001 term, see Table 2 and Figure 2. Pike and Wyoming counties were included in the study area for contiguity. As shown in Table 2, the 212 school districts within these twenty-three counties accounted for nearly 83% of the 1,485 freshmen coming to Kutztown University from Pennsylvania's 530 school districts.
| Berks | |||
| Bucks | |||
| Lehigh | |||
| Montgomery | |||
| Northampton | |||
| Lancaster | |||
| Chester | |||
| Philadelphia | |||
| Delaware | |||
| Monroe | |||
| Schuykill | |||
| York | |||
| Dauphin | |||
| Lackawanna | |||
| Luzerne | |||
| Lebanon | |||
| Carbon | |||
| Cumberland | |||
| Wayne | |||
| Susquehanna | |||
| Columbia | |||
| Pike | |||
| Wyoming |
The Public High School Graduate Report for the 2001 academic year from the Pennsylvania Department of Education was used to develop the demand variable for the Demand Potential Model [PDE, 2002]. This file contained data on school district name, AUN, high school name, ethnic category, gender, and post-high school activity for the graduates of Pennsylvania's public high schools. While a similar report was available for private and non-public high schools, the data set was not used since there was no spatial database to which the data could be joined and graduates from private schools represent a small proportion of Kutztown University's freshmen class.
As in the pilot study reported on last year, the demand variable for the potential model was created from the Public High School Graduate Report by summarized for each school district the number of college bound high school graduates by ethnic group. This summary process was accomplished by using the pivot table analysis capabilities of MS Excel. This summary file was joined to the spatial database containing the Kutztown University freshmen enrollment data using the accounting unit number for the district.
The values of the 'distance' variable for the Demand Potential Model were calculated using the best route capability of ArcView Network Analyst. The road network used to determine the minimum travel time routes was developed from several sources of information.
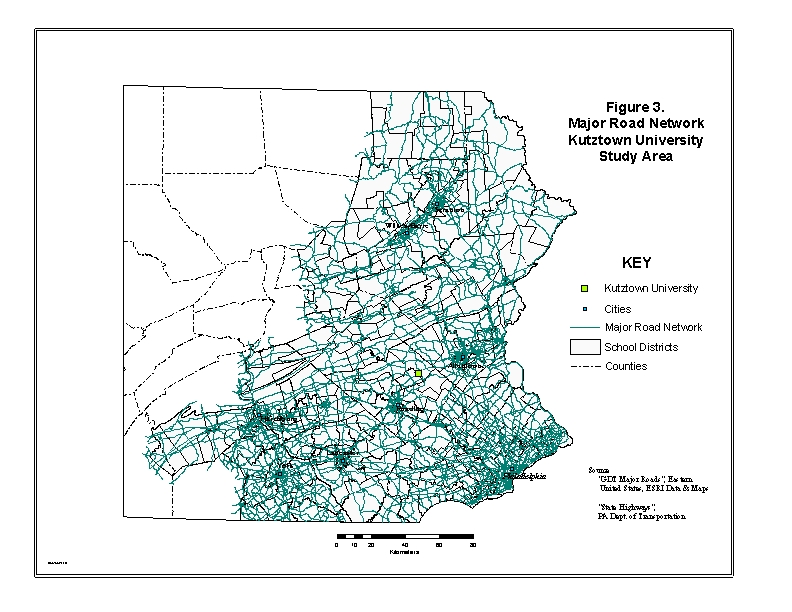
The primary road network for the analysis was a portion of the major highway file available on the detailed Eastern United States data CD-ROM distributed with ArcGIS. The GDT road network file for Pennsylvania was clipped to those roads within the counties of the study area plus a 20 km buffer. This buffer was necessary to preclude the situation where a road exits the study area and then re-enters thus making a potential route discontinuous. This initial network consisted of 29,231 arcs shown in Figure 3.
The next step in building the routing database was to code the arcs for limited accessibility. The determination as to whether an arc represented a limited access highway or not was determined by using the Census Function Classification Code, CFCC, within the GDT file and the accessibility code within the Pennsylvania Department of Transportation, PaDOT, county-based state highway network. All limited access highways in the PaDOT file were exported to a separate shape file. This 'limited access' network was then compared to the GDT road network. Any none or miscoded arcs within the GDT file were updated to indicated their limited accessibility.
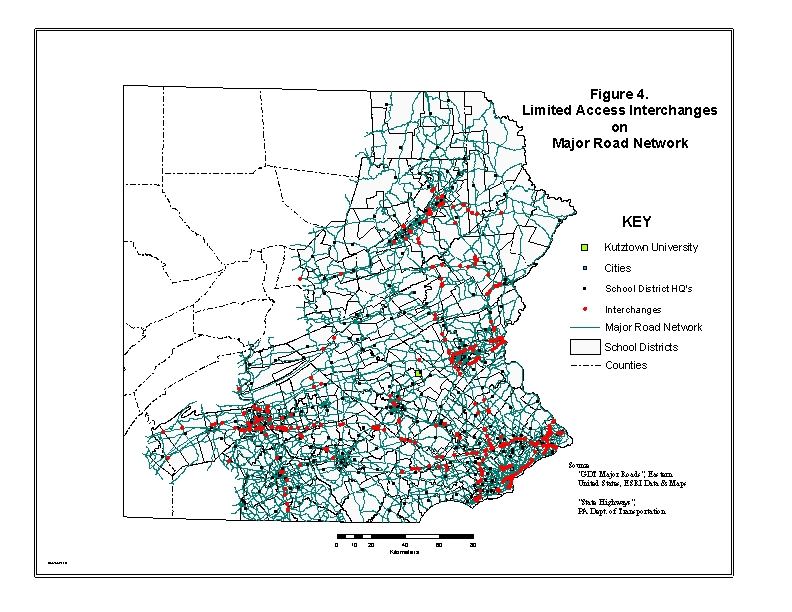
Once each of the arcs within the GDT road network had been coded for limited accessibility, all pseudo nodes were removed from the file through a dissolve process in ArcEdit. The removal of the pseudo nodes resulted in network of a little over 9,600 links. This network was again compared to the PaDOT limited access network to ensure that no accessibility coding had been lost. The removal of the pseudo nodes left a file containing only those nodes where roadways intersected. >From this node set, all 434 nodes that were coincident to a limited access roadway were identified and can be seen in Figure 4.
This subset of the original node set was then examined to determine if they represented a "no-turn" situation, i.e. and over or under pass. Having determined which intersection nodes represented non-interchange points, the intersections were coded with 'pseudo-elevation' values so that the routing algorithm would reflect the reality of the interactions. It was assumed for this study that for all other intersections interchange was possible.
For Network Analyst to generate a route between Kutztown University and the school districts within the study area, a set of nodes had to be developed to represent the districts and a single node coded for the University. For this study it was assumed that the location of a school district headquarters would represent the district. To geocode the location of the school district headquarters, the Pennsylvania portion of the ArcGIS StreetMap USA data was copied and then clipped to the study area. From this clipped data set of a little over 535,300 streets, a geocoding service was created for the study area.
Geocoding of the school district headquarter addresses resulted in 100 matches with 11 ties for the 212 school districts. The low match rate reflects two factors. The primary reason for the low match rate was that many of streets within the study area did not have address ranges. A little over 234,000 streets or 43% of the geocoding street file did not have address ranges or zip codes. The second factor that accounts for the low match rate is that many district headquarters were located outside of cities on rural delivery routes and could not be accounted for with the geocoding process. To resolve the unmatched district headquarters, the street file was manually scanned by street name and zip code. A headquarter node was then located based on the 'best' estimate of the address ranges within a town using blocks.
The finally two steps in preparing the travel time database were making sure that the school district headquarter nodes were on the road network and assigning speed limits to the network arcs in order to calculate travel time. Using the study area geocoding street file and the geocoded school district headquarter nodes, the GDT road network was then edited by digitizing road linkages to add any 'missing' arcs using the geocoding street file as background. The school district headquarter nodes were then snapped to the nodes on the road network. If the arc existed in the GDT network but a node did not exist at the appropriate location, the arc was split at the appropriate location and the school district headquarter node was snapped to the location. For the snapping process in ArcView, I used the "Snap2Other" extension, developed by John Grayson and available through ArcScripts. The speed limits for the arc were based on the functional classification of the road segments. Travel times in minutes were then calculated based on the length of the arcs.
Using the edited GDT road network for the study area, the routing capabilities of Network Analyst was used to the determine the minimum travel time route between each school district headquarter node and Kutztown University. Figure 5 shows the 212 shortest travel time paths were merged into a single shapefile of arcs. Since each route contained the AUN for the school district, the file was joined to the spatial database of school districts.
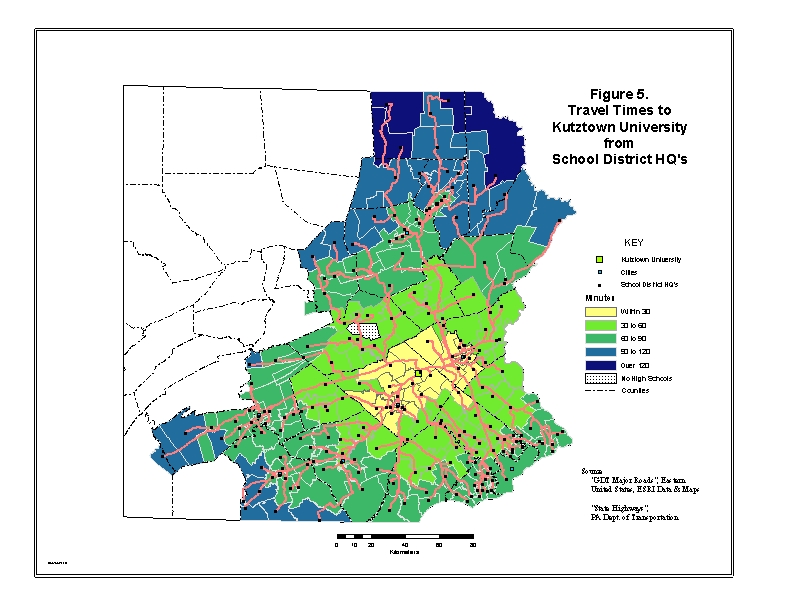
At this point each school district in the Kutztown University GIS Database has information on Fall 2001 freshmen enrollment by ethnic group; the number of college bound high school graduates broken down by ethnicity and total; average verbal and mathematics SAT scores; number of visits to district high schools by Kutztown Admissions Office staff; and the travel time between the district's headquarters and Kutztown University.
Using the Kutztown University GIS database the Demand Potential Model was calculated for the college bound high school graduates both total and ethnic minorities by dividing the number of students in each category by the minimum travel time between the school district headquarters and Kutztown University. The ranked results of applying the Demand Potential Model are shown in Figure 6.
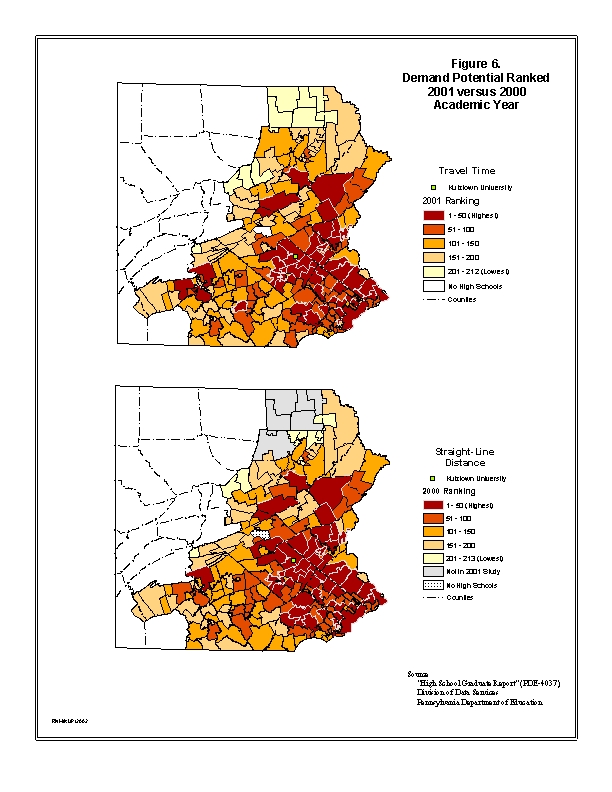
As shown in Figure 6 the spatial variation in the demand potential for this study is similar to that found in the pilot study. Specifically, school districts closest to Kutztown University in travel time or those districts with large college bound graduating classes have the highest potential (rank). The primary difference in the rankings between the two studies is that the use of travel time rather than straight-line distance produces a higher potential, especially for those districts farther from the campus. This can be seen from the relationship between travel time and distance shown in Figure 7.
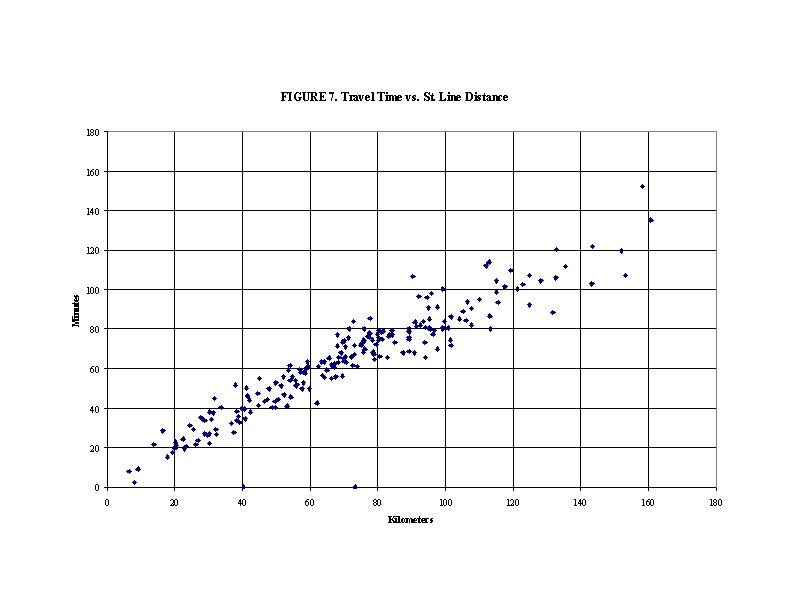
Because of the curvilinear relationship between travel time and straight-line distance, especially at distances over 60 kilometers, for a given student population size travel time will produce a higher potential than straight-line distance.
The Kutztown University GIS Database is a tool that allows recruitment decisions to be based on the characteristics of the school district's student graduating population and the demand potential. An example of one type of application is shown in Figure 8 where the database has been queried to identify those school districts with a demand potential ranking in the top 50 and more than 10 Blacks who are college bound.
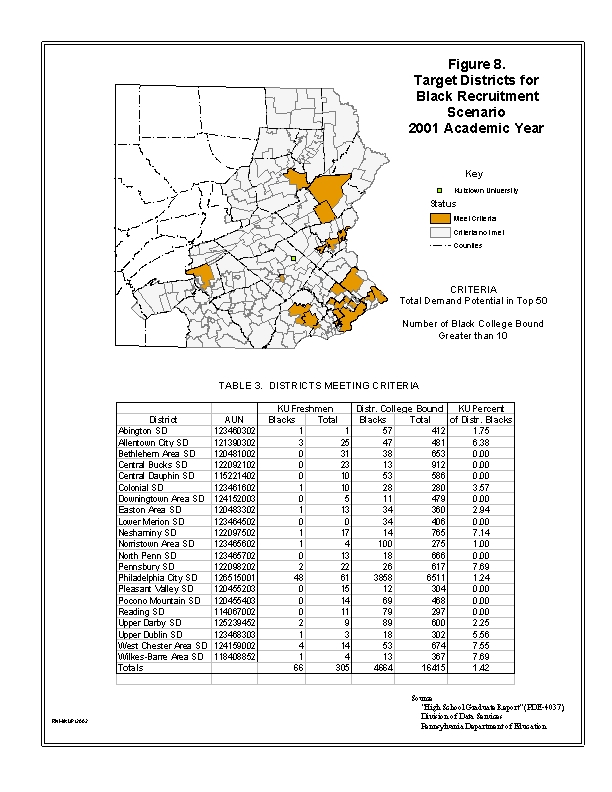
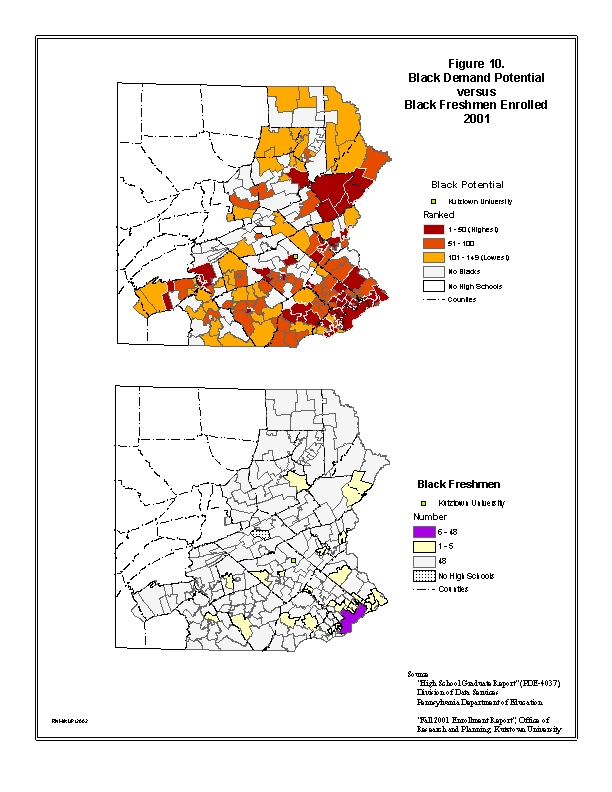
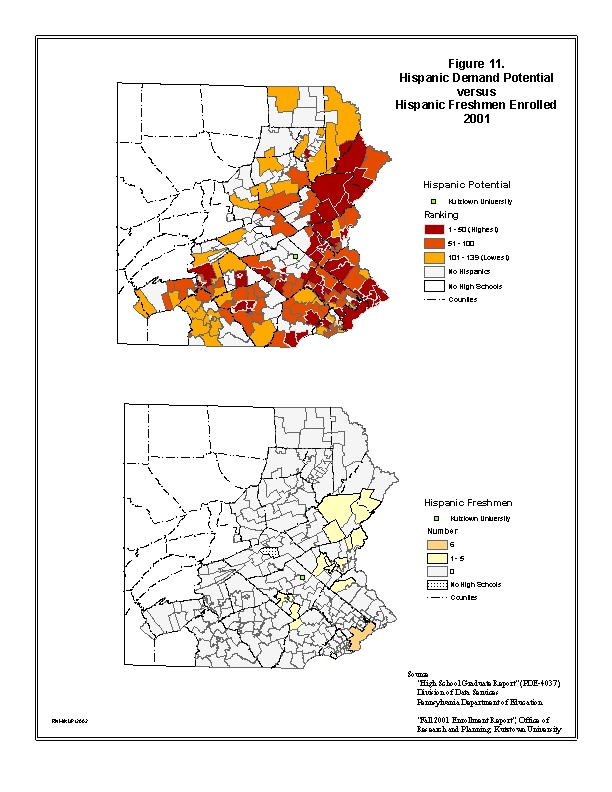
As indicated in the Table 3 within Figure 8, Kutztown University freshmen represent a relatively small percentage of the number of Blacks who are college bound. Another method of using the database is shown in Figures 9, 10 and 11. In this set of comparative maps it is relatively easy to identify school districts with high potential but low enrollment of freshmen at Kutztown University.
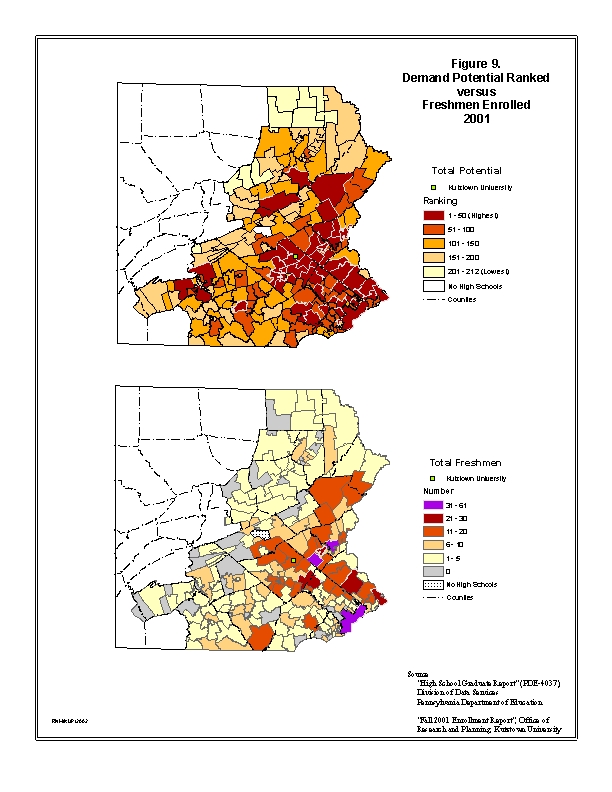
While Figure 9 shows the general pattern of total demand potential and freshmen enrollment, the differences between demand potential and enrollment for Blacks and Hispanics in Figures 10 and 11, respectively, is striking. For both ethnic groups there are many districts with high potential but no freshmen enrolled at the University. Focusing on these school districts with high demand potential may have significant impacts on the diversity of the student population at Kutztown University.
As mentioned at the beginning of this paper, the second purposed of this research was to look hat the relationship between recruitment by the Admissions Office of the University, the Demand Potential Model, and freshmen enrollment at Kutztown. Clearly, the previous section of this paper demonstrates how the Kutztown University Database can be used as a tool to enhance recruiting efforts.
However, as is evident in Figure 12, the relationship between Admission staff visits and freshmen enrolling at the University is unclear.
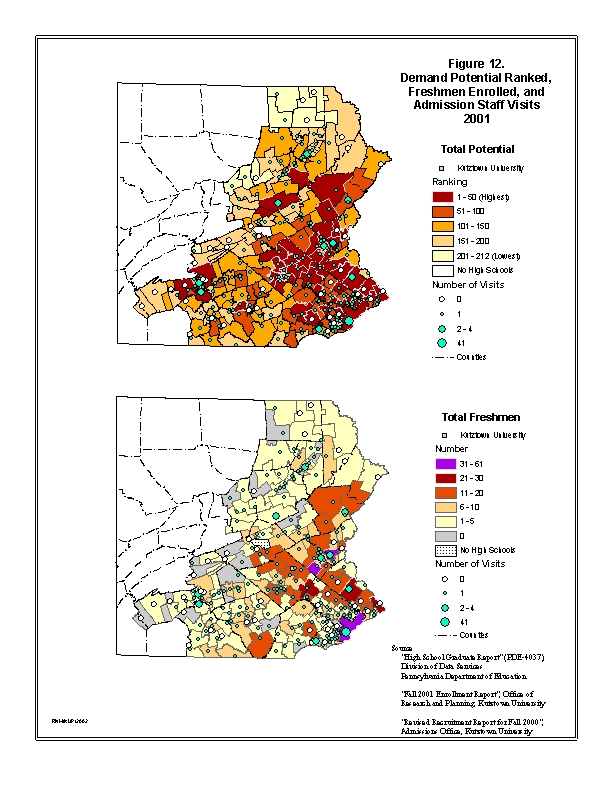
A majority of the school districts were visited only once, while a few districts had multiple visits. The districts with multiple visits typically have more than one high school. The one clear relationship between the number of Admission staff visits and freshmen enrolling at the University is the City of Philadelphia school district. This district had the largest number of visits and the highest enrollment at Kutztown University of any school district in the study area. In addition, there is a positive relationship between the number of visits and the number of Black freshmen enrolling in the fall term of 2001 as can be seen if Figures 8 and 10.
| Black | ||||
| Amer Indian | ||||
| Asian Pac. Is. | ||||
| Hispanic | ||||
| White | ||||
| Total | ||||
| Minority % |
While Figure 12 does not clarify the relationship between Admission staff visits during the fall of 200 and freshmen enrolling in the fall 2001, Table 4 clearly shows that there has been a significant increase in the number of Black and Hispanic freshmen enrolling which can be attributed to the recruitment effort. However, it should be noted that while Black freshmen had a five-fold increase and Hispanics freshmen nearly doubled, the number of Asian freshmen was cut by more than half. Even with this decrease in Asian freshment enrolling, Kutztown Univesity has met and exceeded the System average of 7.5% for minority enrollment.
This paper and the pilot study have shown how GIS can be used to build and analyze a database to improve the recruitment of students to Kutztown University. One significant outcome of this research project is that the Admissions Office and the Assistant to the President for Enrollment Management have recently expressed a great interest in the research and workshops are being planned to review how GIS may be used to assist their offices in meeting their goals.
Because of the approach used in the research to develop the Demand Potential Model competition between higher education institutions for the college bound graduates from Pennsylvania high schools has not been considered. One area of possible future research is the use of entropy maximizing gravity models to addressing this competitive aspect for the student market [Haynes, 1984]. Using a production constraints based on the number of college bound graduates in school districts and an attraction constraints based on student housing available at the competing univeristies and colleges, a gravity model using travel time could be built to replicate the patterns of spatial interaction.
ACT High School Address File, ACT (Academic Collegiate Testing), Inc., Des Moines, IA, 2001.
Revised Recruitment Schedule for Fall 2000, Admissions Office, Kutztown University.
M. DeLaune, Xtools Extension, Available at http://www.odf.state.or.us/stateforests/sfgis/Documents/Xtools.htm
J. Grayson, Snap2Other Extension, Available in ArcScripts at www.Esri.com.
C.D. Harris, "The Market as a Factor in the Localization of Industry in the United States," Annals, Association of American Geographers, Vol. 44, No. 4, 1954, pp. 315-33.
K.E. Haynes and A.S. Fotheringham, Gravity and Spatial Interaction Models, Beverly Hills, CA: SAGE Publications, 1984.
R.N. Martin, "The Shrinking Student Pool and Higher Education: An Example from Pennsylvania," Proceedings of the 20th Annual Esri International Users Conference, Redlands, CA: Esri, 2000.
R.N. Martin, "Identifying Target Enrollment Areas to Improve Diversity," Proceedings of the 21st Annual Esri International Users Conference, Redlands, CA: Esri, 2001.
Fall 2000 Enrollment Report, Kutztown University, Office of Research and Planning, Institution Research, Kutztown University.
Fall 2001 Enrollment Report, Kutztown University, Office of Research and Planning, Institution Research, Kutztown University.
High School Graduate Report (PDE-4037), School Contacts Directory (S01), and District SAT Scores (D08) for the 2000-2001 academic year, Division of Data Services, Pennsylvania Department of Education at http://www.pde.psu.edu.
W.J. Reilly, The Law of Retail Gravitation, New York, 1931 as referenced in Economics of Location, 2nd ed., A. Losch, translated by W.H. Woglom, New Haven: Yale University Press, 1954, pp 410-412.
A.G Wilson and R.J. Bennett, Mathematical Methods in Human Geography and Planning, Chichester: John Wiley & Sons, 1985, Chapter 12.